MO Freight Executive Summary
MO Freight Executive Summary
MO Freight Executive Summary
You also want an ePaper? Increase the reach of your titles
YUMPU automatically turns print PDFs into web optimized ePapers that Google loves.
Wilbur Smith Associates<br />
HNTB Corporation<br />
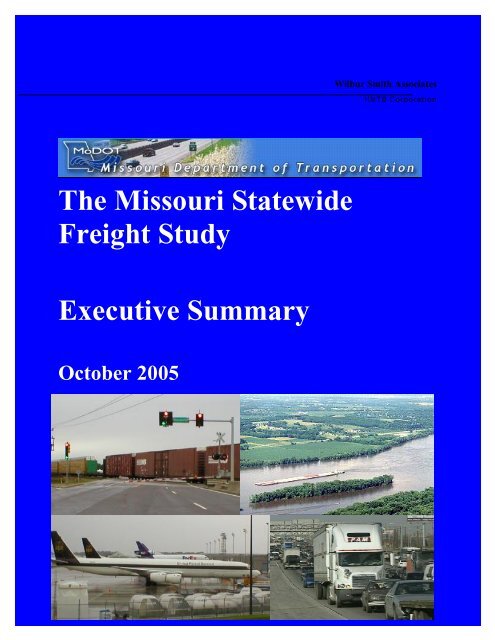
The Missouri Statewide<br />
<strong>Freight</strong> Study<br />
<strong>Executive</strong> <strong>Summary</strong><br />
October 2005
Missouri Statewide <strong>Freight</strong> Study Page 1<br />
<strong>Executive</strong> <strong>Summary</strong><br />
Making the Case for <strong>Freight</strong> Transportation Planning<br />
Today national, regional and local economies rely on international trade to remain competitive in a<br />
global market place. In the current business environment, cost effective, time sensitive<br />
transportation services have become a strategy for competitive advantage in manufacturing and<br />
service based industries. Public transportation agencies today are being challenged to support<br />
modern product supply-chains through infrastructure investments and policy actions. To support<br />
economic prosperity in this environment, public planning agencies must understand and support<br />
new economy transportation needs.<br />
In the ten years since the North American Free Trade<br />
Agreement (NAFTA) went into effect, trade using surface<br />
transportation between the United States and its partners,<br />
Canada and Mexico, has grown more than 80 percent and<br />
as of September 2004, was valued at $54.9 billion. In 2000,<br />
Missouri’s surface trade with Canada and Mexico totaled<br />
nearly $7 billion. 1 Surface transportation consists of freight<br />
movements by truck, rail, and pipeline. About 90 percent of<br />
U.S. trade with Canada and Mexico moves by surface<br />
transportation.<br />
The Missouri Department of Transportation undertook the<br />
Missouri Statewide <strong>Freight</strong> Study as a precursor to an<br />
update of Missouri’s Long Range Transportation Plan.<br />
Specifically, the primary objective of this study is:<br />
Kansas City and St. Louis provide key<br />
markets and intermodal connections for<br />
Missouri’s highway transportation system.<br />
Highway constraints that limit mobility<br />
and/or access to these centers are especially<br />
important. Interstate 70 is a key route<br />
for freight travel in both St. Louis and<br />
Kansas City. The beltway surrounding<br />
St. Louis is also a major connection for<br />
freight in the city of St. Louis. Most of<br />
the major east-west thoroughfares crossing<br />
the St. Louis metropolitan area experience<br />
truck traffic volumes of 100,000 vehicles<br />
or more on a daily basis.<br />
“…to study the movement of freight through all modes of Missouri’s transportation system in an effort to<br />
improve efficiency and safety throughout the system. This study will inventory the existing system, identify key<br />
components and needs, and identify current trends to forecast future needs. The study will serve as a starting<br />
point for developing a working model of Missouri’s freight transportation system.” 2<br />
Missouri’s <strong>Freight</strong> Networks<br />
Missouri maintains 32,397 miles of state roadways. 3 For the Missouri Statewide <strong>Freight</strong> Analysis a<br />
“freight highway network” consisting of just over 22,000 miles was defined early in the study.<br />
Missouri’s railroad network consists of 4,168 main line miles of track, with the majority of the track<br />
owned and operated by Class I carriers. The two largest rail carriers in Missouri are the Burlington<br />
Northern and Santa Fe (BNSF) and the Union Pacific (UP). Other Class I carriers include the<br />
Kansas City Southern Railway Company, the Norfolk Southern Corporation and CSX<br />
Transportation. In addition to highway and rail modes, the U.S. Army Corps of Engineers<br />
(U.S.A.C.E) maintains 1,050 miles of navigable waterways in Missouri. The inland waterway system<br />
throughout the State of Missouri is divided into two river systems, the Missouri River and the<br />
Mississippi River. The largest nodes of water freight activity are located in Kansas City and St.<br />
Louis. There are 12 Missouri airports that support air cargo operations; seven conduct scheduled<br />
operations for integrated and all-cargo carriers, while five others support ad-hoc charter operations<br />
to varying degrees of volume and frequency.<br />
Wilbur Smith Associates<br />
HNTB Corporation
Missouri Statewide <strong>Freight</strong> Study Page 2<br />
<strong>Executive</strong> <strong>Summary</strong><br />
Missouri’s <strong>Freight</strong> Highway Network<br />
Missouri’s <strong>Freight</strong> Railroad Network<br />
Missouri’s Waterway Network<br />
Missouri’s Air Cargo Network<br />
Wilbur Smith Associates<br />
HNTB Corporation
Missouri Statewide <strong>Freight</strong> Study Page 3<br />
<strong>Executive</strong> <strong>Summary</strong><br />
Missouri’s <strong>Freight</strong> Movement Profile<br />
In 2001, Missouri’s transportation system facilitated the movement of approximately 1.1<br />
billion tons of freight with an estimated value exceeding $1.3 trillion dollars.<br />
By weight approximately 65 percent of all freight moving in, out, within and through Missouri<br />
moves by truck; 33 percent by rail; 2 percent by water; and less than 1 percent by air. By value, the<br />
significance of the truck mode increases even further, to nearly 80 percent.<br />
Of all freight on Missouri’s transportation<br />
system, the majority [approximately 719<br />
million tons (64 percent by value)] moves<br />
through Missouri from origins outside of the<br />
state to destinations also outside the state.<br />
The remainder is comprised of imports to<br />
and exports from Missouri, and shipments<br />
where both the origin and destination are<br />
within the state of Missouri.<br />
Missouri is a bridge state for both truck and<br />
rail movements to other parts of the U.S., as<br />
74 percent of rail traffic by tonnage and 55<br />
percent of truck traffic by tonnage has<br />
neither an origin nor destination in Missouri.<br />
Approximately 59.7<br />
percent of the tons<br />
moved through Missouri<br />
are moved by truck. Of<br />
the approximately 409.6<br />
million tons of freight<br />
that moves through<br />
Missouri by truck, the<br />
most common<br />
commodity types include<br />
Farm Products (17<br />
percent), Food or<br />
Kindred Products (15<br />
percent), Secondary<br />
Traffic (12 percent) and<br />
Nonmetallic Minerals<br />
(11 percent).<br />
The Nature of Goods Movement in Missouri<br />
Truck<br />
65.1%<br />
Mode Share by Tonnage, Including<br />
"Through" Traffic<br />
Air<br />
0.04%<br />
Source: TRANSEARCH 2001<br />
Water<br />
2.1%<br />
Rail<br />
32.8%<br />
Missouri <strong>Freight</strong> Movements by Mode: Tonnage and Value<br />
<strong>Summary</strong> Statistics Including Through Traffic for Truck and Rail<br />
Tonnage<br />
Value<br />
Mode Tons Percent Value Percent<br />
Truck 740,085,994 65.1% $1,297,895,492,510 78.8%<br />
Rail 372,643,710 32.8% $340,387,354,245 20.7%<br />
Water 24,092,707 2.1% $4,921,787,993 0.3%<br />
Air 437,410 0.04% $3,838,112,826 0.2%<br />
Total 1,137,259,820 $1,647,042,747,573<br />
<strong>Summary</strong> Statistics Without Through Traffic for Truck and Rail<br />
Tonnage<br />
Value<br />
Mode Tons Percent Value Percent<br />
Truck 330,460,671 73.3% $487,549,273,699 83.1%<br />
Rail 96,135,653 21.3% $90,693,694,699 15.5%<br />
Water 24,092,707 5.3% $4,921,787,993 0.8%<br />
Air 437,410 0.10% $3,838,112,826 0.7%<br />
Total 451,126,440 $587,002,869,217<br />
Source: 2001 TRANSEARCH Data, mapped using the Commodity Information Management System<br />
Wilbur Smith Associates<br />
HNTB Corporation
Missouri Statewide <strong>Freight</strong> Study Page 4<br />
<strong>Executive</strong> <strong>Summary</strong><br />
In 2001, over 370 Million tons of freight moved<br />
on Missouri’s railway network, with an<br />
estimated value exceeding $340 Billion.<br />
Of the freight tons on Missouri’s railroad system, 48<br />
percent is Coal. Farm Products, Chemical Products,<br />
and Food/ Kindred Products combine for an<br />
additional 34%. Seventy-four percent of rail tons<br />
pass through the state, 20.5 percent are imports, and<br />
5.3 percent are exports<br />
In 2001, over 190 Million tons of freight moved<br />
by water in Missouri, valued at nearly $5 billion.<br />
Industrial<br />
Chemicals<br />
4%<br />
Petroleum<br />
Products<br />
10%<br />
Coal & Coke<br />
10%<br />
Fertilizers<br />
4%<br />
Source: U.S.A.C.E<br />
Animal<br />
Feed<br />
3%<br />
Wheat<br />
1%<br />
Iron & Steel<br />
6%<br />
Other<br />
8%<br />
Construction<br />
Mtls<br />
9%<br />
Corn<br />
32%<br />
Soybeans<br />
13%<br />
Railway <strong>Freight</strong> Movements in Missouri<br />
(Millions of U.S. $)<br />
Through,<br />
$249,694<br />
74% Intra-State,<br />
$4,318<br />
1%<br />
Imports,<br />
$41,646<br />
12%<br />
Exports,<br />
$44,729<br />
13%<br />
The Upper Mississippi River system continues to be a major mode of transportation for a variety of<br />
farm products, as well as other bulk materials such as chemicals and building materials.<br />
Commodity Groups on the Upper Mississippi River<br />
Historically, commodities transported<br />
by barge tow on the Missouri River<br />
include agricultural products,<br />
chemicals such as fertilizers and<br />
petroleum products, and<br />
manufactured goods such as building<br />
materials. However, in recent years<br />
fluctuating water levels on the<br />
Missouri River have significantly<br />
impacted barge traffic.<br />
Kansas City International and St.<br />
Louis International represent the<br />
state’s largest markets and highest<br />
respective air cargo volumes.<br />
The combined draw or “catchment” area<br />
of these airports covers the majority of<br />
the State. Kansas City International<br />
Airport acts as a consolidation point for<br />
FedEx, UPS, Airborne, BAX Global,<br />
Emery and DHL feeder aircraft and<br />
trucks that serve western Missouri and<br />
eastern Kansas.<br />
St. Louis-Lambert International Airport<br />
performs the same function for eastern<br />
Missouri and western Illinois.<br />
Missouri Air Drayage – Origin and Destination<br />
Source: Reebie TRANSEARCH, 2001<br />
Wilbur Smith Associates<br />
HNTB Corporation
Missouri Statewide <strong>Freight</strong> Study Page 5<br />
<strong>Executive</strong> <strong>Summary</strong><br />
Missouri: A Central Location to National and International Markets<br />
Origin Locations for Commodity Imports to Missouri (Excludes Coal)<br />
Missouri occupies a<br />
key location in North<br />
America’s trade<br />
network. A one-day<br />
drive by truck to<br />
significant U.S.<br />
population centers,<br />
Missouri also sits at<br />
the nexus of major rail<br />
and water routes.<br />
The red production<br />
icons on the<br />
commodity import<br />
map suggest that<br />
businesses in Missouri<br />
take ready advantage<br />
of neighboring<br />
Source: 2001 TRANSEARCH Data, mapped using the Commodity Information Management System (CIMS)<br />
industrial/commercial<br />
centers in Kansas, Arkansas, and Illinois. Other major suppliers of Missouri’s economy include<br />
Ohio, Minnesota, Colorado and states along the Gulf Coast. Rail links to Southern California also<br />
result in the Ports of Los Angeles and Long Beach being a significant portal for goods flowing into<br />
Missouri.<br />
Destination Locations for All Commodity Exports from Missouri<br />
Export trade with<br />
Latin America has<br />
burgeoned over the<br />
past decade, and at<br />
times exports have<br />
grown by as much as<br />
10 percent per year. 4<br />
As a result, the Gulf<br />
Coast states have<br />
become major portals<br />
for Missouri exports.<br />
The blue circle<br />
destination icons<br />
located at the<br />
termination of the<br />
Mississippi River is<br />
the dominate feature<br />
of the commodity export map. Chicago, with the nation’s largest rail hub, is also a major recipient<br />
of commodities exported from the state.<br />
Source: 2001 TRANSEARCH Data, mapped using the Commodity Information Management System (CIMS)<br />
Wilbur Smith Associates<br />
HNTB Corporation
Missouri Statewide <strong>Freight</strong> Study Page 6<br />
<strong>Executive</strong> <strong>Summary</strong><br />
<strong>Freight</strong> Forecasts<br />
The chart on this page shows the<br />
forecasted percentage change in<br />
commodity tonnages for Missouri<br />
between 2001 and 2020. The<br />
forecasts are presented by industry<br />
at the two-digit Standard<br />
Transportation Commodity Code<br />
(STCC). Over the 20 year period<br />
seven commodity groups are<br />
projected to decline. Several other<br />
commodity groups are projected to<br />
grow by more than 100% including<br />
Secondary Traffic (intermodal<br />
drayage and movements between<br />
warehouses); Instruments, Photo<br />
Equipment or Optical Equipment;<br />
Electrical Equipment; Machinery;<br />
and, Apparel.<br />
Over 17% of the truck tonnage<br />
moving on Missouri highways is<br />
through traffic, i.e., originates outside<br />
of state and is destined to locations<br />
also outside the state. The origins,<br />
destinations, and nature of through<br />
truck traffic in Missouri were<br />
examined using the Commodity<br />
Information Management System<br />
(CIMS), a GIS planning application<br />
developed for the study.<br />
Missouri’s Forecasted Through Truck Traffic<br />
The Missouri CIMS application can<br />
create reports and map forecasted<br />
commodity flows comparing current<br />
year and forecasted volumes. The map<br />
here shows the difference by tonnage<br />
between Year 2001 and 2020, as a result<br />
of through truck traffic. The analysis<br />
for current and year 2020 through truck<br />
traffic suggests that some routes such as<br />
I-29 and I-55 will see in excess of 50<br />
million tons of additional commodity<br />
flows each year in the future.<br />
Wilbur Smith Associates<br />
HNTB Corporation
Missouri Statewide <strong>Freight</strong> Study Page 7<br />
<strong>Executive</strong> <strong>Summary</strong><br />
The Impact of <strong>Freight</strong> on Missouri’s Economy<br />
<strong>Freight</strong> activity on Missouri’s transportation system supports $56.0 billion in output<br />
throughout the Untied States.<br />
The national impact of Missouri’s freight infrastructure accounts for $14.6 billion that is paid in<br />
wages to 455,600 employees. Of the jobs supported by Missouri’s transportation system, 243,000<br />
(53 percent) are located outside the state of Missouri.<br />
Within Missouri, the transportation system supports $24.3 billion of output in the state’s<br />
economy of which $6.4 billion is paid in earnings to 212,600 jobs.<br />
The greatest impacts Missouri enjoys from its transportation system result from the internal<br />
connectivity of the system for freight movements within the state. Over 60 percent of Missouri’s<br />
jobs supported by freight transportation system are attributable to commodity flows for which both<br />
the origin and destination are within the state.<br />
<strong>Freight</strong> movement through Missouri, as well as Missouri’s imports and exports generate significant<br />
jobs, output, and earnings outside of Missouri.<br />
Economic Impacts of Missouri’s <strong>Freight</strong> Transportation System<br />
Impact Region and<br />
Direction of Flow<br />
Direct Exp.<br />
($Million)<br />
Type of Impact<br />
Output<br />
($Million)<br />
Earnings<br />
($Million)<br />
Jobs<br />
In-State Impacts (Missouri-only)<br />
Internal (Internal to Internal) $6,616 $13,441 $3,895 128,600<br />
Export (Internal to External) 2,410 4,948 1,205 41,700<br />
Import (External to Internal) 2,853 5,840 1,322 42,300<br />
Total In-State $11,879 $24,229 $6,422 212,600<br />
Out-of-State Impacts (US Only)<br />
Through (External to External) 5,828 16,801 4,289 127,700<br />
Export (Internal to External) $2,410 $6,664 $1,730 52,800<br />
Import (External to Internal) 2,853 8,303 2,151 62,500<br />
Total Out-of-State $11,091 $31,768 $8,170 243,000<br />
Total Impacts<br />
Internal (Internal to Internal) $6,616 $13,441 $3,895 128,600<br />
Through (External to External) 5,828 16,801 4,289 127,700<br />
Export (Internal to External) 4,820 11,612 2,935 94,500<br />
Import (External to Internal) 5,706 14,143 3,473 104,800<br />
Total of All Economic Impacts $22,970 $55,997 $14,592 455,600<br />
Wilbur Smith Associates<br />
HNTB Corporation
Missouri Statewide <strong>Freight</strong> Study Page 8<br />
<strong>Executive</strong> <strong>Summary</strong><br />
<strong>Freight</strong> Transportation Challenges Facing Missouri<br />
As part of the freight study process, shippers in the state were asked about challenges they face in<br />
moving goods in, out, within and through Missouri. The interviews gathered responses on shipping<br />
decisions such as mode choices, time of day operations and access to a range of transportation<br />
services. The responses to the question gravitated toward five key areas: 1) driver and equipment<br />
availability, 2) maintaining costs, 3) compliance with regulations, 4) on-time deliveries and 5) traffic<br />
congestion. The chart below shows the overall frequency of shipper’s responses.<br />
Shipper Response Frequency to “Challenges” Question<br />
The congestion challenge was most<br />
notable in the St. Louis area as specific<br />
locations were mentioned. Traffic<br />
Congestion<br />
back-ups at weigh stations were also<br />
On-Time Deliveries<br />
cited as a concern. Specific congested<br />
locations identified included:<br />
• I-70 near Lambert and I-55<br />
• Bottleneck at St. Louis bridges<br />
• Near Earth City<br />
• I-64/US 40<br />
Regulatory Compliance<br />
Controlling Costs<br />
Driver/Equip Availability<br />
0 5 10 15 20<br />
Shipper Response to “Weakest Link” Question<br />
When asked what they viewed as the<br />
weakest link in Missouri’s<br />
Other<br />
transportation system, shippers as<br />
previously mentioned, noted a<br />
Regulatory Compliance<br />
generally high level of satisfaction with<br />
Operation Items<br />
the access to services and<br />
transportation choices available to<br />
Railroads<br />
them. However, when presented<br />
with the question, shippers indicated<br />
Road Conditions<br />
the “weakest links” were road<br />
0 2 4 6 8 10 12 14<br />
conditions, railroad services, a variety<br />
of operational issues (maintenance, etc.), regulations, and a handful of other items. The results of<br />
this question are summarized in the chart above. The road condition comments varied from general<br />
sweeping statements such as “need a better connection to Arkansas” to comments about specific<br />
roadways such as I-70, I-44, US-71, US-60 and US-36. Comments related to the railroad also varied<br />
widely in terms of the issues identified.<br />
Comments about operating issues facing shippers/carriers included the lack of carriers, lack of<br />
drivers, retaining quality employees, and back hauling concerns. The vast majority of the comments<br />
regarding regulations were concerning the new hours of service regulation for drivers. A number of<br />
respondents indicated they were very satisfied with the transportation system, while other<br />
commented that the State should be more business friendly.<br />
Wilbur Smith Associates<br />
HNTB Corporation
Missouri Statewide <strong>Freight</strong> Study Page 9<br />
<strong>Executive</strong> <strong>Summary</strong><br />
Road Conditions - A Closer Look at Key Highway Infrastructure<br />
Total domestic freight flows are expected to grow an average of 3.4% from 1998-2010, and<br />
2.4% from 2010-2020. 5<br />
While the extensive multi-modal network found in Missouri has played an important role in the<br />
State’s economic growth and prosperity. Many elements of the freight movement system are now<br />
showing signs of fatigue. Missouri’s extensive surface transportation systems for moving freight are<br />
a key asset underlying Missouri’s diverse economy, maintaining these assets presents a continuing<br />
challenge. In the analysis performed for this study, segments of Missouri’s <strong>Freight</strong> Highway<br />
Network where analyzed and mapped to examine the following condition attributes:<br />
• Pavement Condition<br />
• Percent Truck Traffic<br />
• Level of Service<br />
• Bridge Condition Ratings<br />
• Safety Index<br />
The table below displays the top ranking highways in terms of deficient route miles when highways<br />
in the freight network are sorted by Level of Service (LOS), safety index and percent of truck traffic.<br />
Many of the same highways appearing in this table, are the same routes cited by shippers and carriers<br />
as deficient facilities.<br />
Route Mileage for Various Service and Safety Related Attributes<br />
Route<br />
Level of<br />
Service<br />
E or F<br />
40-50%<br />
Truck<br />
Traffic<br />
Safety<br />
Index -<br />
Poor<br />
Safety<br />
Index -<br />
Very Poor<br />
Pavement<br />
Condition<br />
Poor<br />
Pavement<br />
Condition<br />
Very Poor<br />
<strong>MO</strong> 5 134.1 1.2 45.9 18.5<br />
US 71 86.4 7.1 5.2 32.5 0.4<br />
I-70 82.1 166.2 35.8 5.8 62.4<br />
<strong>MO</strong> 13 79.4 6.0 34.0 18.9<br />
US 60 72.6 4.2 3.9<br />
US 40 54.8 29.8 3.6 39.0 20.2<br />
I-44 52.8 12.1 27.3 61.2<br />
I-64 48.7 2.9 1.1<br />
US 63 45.9 4.0 28.7 9.1<br />
<strong>MO</strong> 46 44.0 4.2<br />
<strong>MO</strong> 7 40.0 3.1 10.7<br />
It should also be noted that MoDOT has in recent years undertaken an aggressive program to<br />
rehabilitate many roadways, and that pavement condition and other information about traffic flows<br />
and congestion may change as resurfacing projects are completed or as pavement surface continues<br />
to deteriorate over time. The information provided is a snap shot of pavement, traffic, and safety<br />
conditions as of the year 2002.<br />
Wilbur Smith Associates<br />
HNTB Corporation
Missouri Statewide <strong>Freight</strong> Study Page 10<br />
<strong>Executive</strong> <strong>Summary</strong><br />
Defining a Framework for <strong>Freight</strong> Planning in Missouri<br />
Missouri’s modal freight networks are necessary foundations of a prosperous economy. Future<br />
investments in these critical assets should be in accordance with the key economic development<br />
needs and long range direction of Missouri’s economy. Previous studies conducted for the State of<br />
Missouri acknowledges the link between transportation investment and economic development, and<br />
the increased business dependence on reliable transportation systems to support the evolving global<br />
trade economy.<br />
Historically, freight has not received the same level of attention in transportation planning as<br />
passenger transport initiatives. Yet, commercial transport is vital to the businesses generating and<br />
receiving freight and all facets of society benefit from efficient freight transport as end users of<br />
goods and services. Missouri’s recognition of the important role of freight in the state’s economy<br />
will help ensure the quality of life for future generations.<br />
In developing a freight policy framework to address the challenges facing Missouri from increases in<br />
freight traffic, an effort was made to explicitly construct a bridge between the state’s transportation<br />
goals and the state’s economic development goals, while “Maintain the Existing Transportation<br />
System” acts as the foundation for future investments.<br />
Proposed <strong>Freight</strong> Planning Strategies Framework<br />
Wilbur Smith Associates<br />
HNTB Corporation
Missouri Statewide <strong>Freight</strong> Study Page 11<br />
<strong>Executive</strong> <strong>Summary</strong><br />
Recommendation #1: Improve <strong>Freight</strong> System Reliability<br />
The level of freight mobility<br />
across Missouri, and especially in<br />
metropolitan areas should be a key<br />
consideration in future planning<br />
efforts. Highway congestion<br />
affects the cost and efficiency of<br />
truck transport, and subsequently<br />
the reliability required for just-intime<br />
delivery. The general<br />
evolution from push to pull<br />
logistics and subsequent demands<br />
for just-in-time delivery,<br />
combined with growth in<br />
distribution centers will likely<br />
heighten regional business<br />
sensitivity to disruptions caused<br />
by traffic congestion.<br />
Focus on Key Truck Corridors<br />
Missouri has a well developed network of highways with specific routes playing specific roles in<br />
freight distribution networks. From a freight movement standpoint, network roles should be<br />
recognized and acknowledged in planning efforts. At least three network roles on the state highway<br />
system should be explicitly recognized and planned for how they will accommodate freight traffic:<br />
• Through routes<br />
• Regional arterial stem routes<br />
• Local connectors to freight activity centers<br />
Through Routes – The commodity flow analysis using the CIMS/TRANSPLAN interface suggests<br />
that four of the five major Interstate Highways that traverse Missouri carry much of the through<br />
truck traffic in the state: I-70, I-44, I-29, and I-55. U.S. highway 61 is also heavily used for passthrough<br />
truck traffic. Continued investment in these key through routes is important to sustaining<br />
Missouri’s Highway <strong>Freight</strong> Network.<br />
Bypasses - A complete highway bypass system, integrated with growth plans and managed for freight<br />
accommodation should be considered a requisite part of the response to through truck traffic<br />
moving through metropolitan areas. Related to bypasses are methods of encouraging their use.<br />
Simple steps like route designation and signage can be effective, or traveler information channels can<br />
be applied to advertise the advantage of preferred routes to unfamiliar drivers. Distance, time, and<br />
their cost implications are the principle criteria for motor carrier route selection. Since most bypass<br />
routes are likely to be longer, having variable message signs with the time implications of route<br />
choices may be one way to encourage their use under heavily congested conditions.<br />
Wilbur Smith Associates<br />
HNTB Corporation
Missouri Statewide <strong>Freight</strong> Study Page 12<br />
<strong>Executive</strong> <strong>Summary</strong><br />
Tolling - Toll roads currently are under investigation around the nation as a means of generating<br />
partial financing of infrastructure and influencing travel behavior. Federal flexibility on tolling is<br />
becoming greater than in the past, and although policy is not fixed, the option is justified for<br />
consideration. The trucking industry is generally opposed to tolls on existing facilities, but has<br />
expressed willingness to considering tolls on new capacity expansions.<br />
Truck Separation – Separating freight and passenger/commuter traffic is a relatively new traffic<br />
management strategy that is increasingly being examined in areas of high traffic density, where few<br />
alternatives exist. The most fundamental form of separation is to design roadways with sufficient<br />
lane widths, providing traffic sufficient maneuverability. Another form of separation is to restrict<br />
specific types of traffic along specific corridors.<br />
Regional Truck Routes - Through truck traffic in Missouri has been described as a significant portion<br />
of overall truck volumes. However, while through traffic is large, it does not overshadow the need<br />
to understand and plan for regional traffic development, which is the segment to likely have the<br />
most effect on the state’s economy. Operationally, regional routes should be managed for freight,<br />
for instance traffic signals can be timed for truck movements from known freight generators and<br />
receivers. Relief routes can be pre-defined, so that incidents can be handled with diversion as well as<br />
intervention.<br />
High-Value Commodity Movements in Missouri<br />
The ability to move freight<br />
efficiently between<br />
Missouri’s key trade centers<br />
is critical to bringing new<br />
industry to the area. Highvalue<br />
commodity producing<br />
industrial groups in Missouri<br />
are likely to be important in<br />
terms of economic impact<br />
and jobs, and these<br />
industries are likely to be<br />
service sensitive with regard<br />
to freight transportation.<br />
This means their inventories<br />
are low and their time<br />
Source: 2001 TRANSEARCH Data, mapped using the Commodity Information Management System (CIMS)<br />
commitments to customers are fast. Their business processes require a high degree of reliability in<br />
transportation performance. The automotive industry has refined their inventory systems to the<br />
point where delays in the arrival of a shipment can cause an expensive production line to be shut<br />
down. The cost of this occurrence is monumental. Therefore, the speed and the reliability of the<br />
transportation network are critical. The map above shows the CIMS modeled output of key<br />
highway routes used in transporting high-value commodities from the Electrical Equipment,<br />
Chemical and Transportation Equipment Industries.<br />
Wilbur Smith Associates<br />
HNTB Corporation
Missouri Statewide <strong>Freight</strong> Study Page 13<br />
<strong>Executive</strong> <strong>Summary</strong><br />
Recommendation #2: Develop <strong>Freight</strong> Data and Measure Performance<br />
Given the investments MoDOT has<br />
made in the TRANSEARCH<br />
database, and the tools developed<br />
during the course of this project,<br />
Missouri has an excellent<br />
foundation for building a<br />
comprehensive freight data<br />
program. Next steps for building<br />
on these tools could include<br />
integrating the CIMS application<br />
with data available from the<br />
Missouri Economic Research and<br />
Information Center, and integrating<br />
CIMS data with MoDOT’s<br />
Transportation Management System<br />
Build On MoDOT’s “Tracker”<br />
Tracker is a performance measurement tool to assess how well MoDOT is delivering its products<br />
and services. Average speed on selected roadway segments is one measure is intended to provide<br />
indications of congestion on key roadways. Data from Traffic Management Centers (TMC) in urban<br />
areas that collect traffic data from roadside detectors will be used for Interstate facilities. Signal<br />
timing surveillance will be used to evaluate average speeds on non-interstate arterials.<br />
Recently the FHWA and American<br />
Transportation Research Institute<br />
(ATRI) entered into a “partnership<br />
to explore methods and approaches<br />
for measuring freight performance<br />
on the nation’s highways.” 6 The<br />
Phase I study evaluated methods for<br />
collecting real-time travel speeds on<br />
high volume freight corridors. Five<br />
methods for real time data<br />
collection were evaluated, including<br />
data from trucking company GPS<br />
transponders. I-70 between St.<br />
Louis and Kansas City was one of<br />
the corridors for which data was<br />
collected. Such partnerships should<br />
be explored to further enhance<br />
MoDOT’s Tracker performance<br />
measures for freight.<br />
Average Truck Speeds from GPS data for I-70<br />
(Graphic provided by ATRI)<br />
Wilbur Smith Associates<br />
HNTB Corporation
Missouri Statewide <strong>Freight</strong> Study Page 14<br />
<strong>Executive</strong> <strong>Summary</strong><br />
Recommendation #3: Strengthen Intermodal Connectors<br />
Intermodal connectors impact the<br />
movement of freight in Missouri and<br />
elsewhere by affecting access to<br />
modes and often reducing overall<br />
transportation efficiency. The<br />
accessibility to the National Highway<br />
System (NHS) and other important<br />
transportation gateways is a significant<br />
factor which influences new business<br />
start-ups, new warehouse locations,<br />
and new freight terminals and<br />
facilities. Additional costs as a result<br />
of poor accessibility are often realized<br />
as lost driver time, equipment damage,<br />
Capitalize on<br />
New Federal<br />
Programs<br />
3.<br />
Strengthen<br />
Intermodal<br />
Connections<br />
Suggested Goal Objectives<br />
Improve<br />
Examine State<br />
interrmodal data<br />
Funding Programs<br />
and planning resources<br />
Potential Strategies for Achieving Policy Objectives<br />
Consider shipper<br />
incentives for new or<br />
expanded rail use<br />
•Improve access roads<br />
to facilities<br />
•Develop appropriate<br />
staging areas<br />
•Fund regional university<br />
research<br />
•Partner with neighboring<br />
jurisdictions<br />
and transit delays. Local congestion is often increased when trucks have to navigate inadequate<br />
turning lanes and narrow roadways to pick up or deliver freight off the NHS.<br />
A significant effort was made for this study to expand and document terminal and intemodal<br />
facilities that generate significant levels of truck traffic (50+ truck trips per day) in Missouri. The<br />
inventory of freight facilities developed during this study can assist MoDOT planners in identifying<br />
and prioritizing connector routes needed in Missouri. Some connector route needs have already<br />
been identified by MPOs in Missouri, for instance Kansas City undertook the Intermodal <strong>Freight</strong><br />
Strategies Study that provided recommendations to improve access to several key industrial areas in<br />
the Kansas City region with large concentrations of freight terminals (Missouri River valley, the Blue<br />
River valley and at the junctions of major freeways). St. Louis in its long range transportation plan<br />
Legacy 2020, identified terminal access issues related to the highway system, and also identified a<br />
Priority Goods Movement Network that encompasses highway, rail, water and air facilities<br />
considered to be essential to the efficient movement of freight in the region. Through interviews<br />
and surveys undertaken with carriers and shippers in Missouri, other needs related to terminal access<br />
were also identified.<br />
Terminal Access Needs Identified by Rail Carriers:<br />
• Terminal infrastructure: Kansas City and Chicago threaten the ongoing vitality of the St.<br />
Louis gateway as a major connection point between the eastern and western rail networks.<br />
• The St. Louis metro region should be seen in a bi-state context. Much of the developable<br />
land for rail-served clients is on the Illinois side of the river. Lack of adequate bridge<br />
capacity is hampering abilities to improve the overall level of rail service.<br />
• Highway improvement projects should be considered and designed in the context of an<br />
overall regional infrastructure plan that includes rail and transit modes. The needs of rail<br />
carriers and users appear to be treated as an afterthought by sections of the Illinois and<br />
Missouri DOT’s.<br />
Wilbur Smith Associates<br />
HNTB Corporation
Missouri Statewide <strong>Freight</strong> Study Page 15<br />
<strong>Executive</strong> <strong>Summary</strong><br />
Air Cargo Terminal Access Needs<br />
Identified by Airports and Air Carriers:<br />
• St. Louis Lambert International:<br />
Frequent trains and an at-grade rail<br />
crossing to the north of the airport at<br />
James S. McDonnell Blvd., the primary<br />
access road to STL air cargo facility,<br />
causes truck delays.<br />
• Columbia Regional Airport: Access to<br />
air cargo facilities is via Airport Rd., same passenger traffic (no dedicated freight access).<br />
The south entry road, Angel Lane, provides a more direct route to the cargo facility for<br />
freight arriving and departing to the south. However, truck traffic is prohibited on the road<br />
forcing all freight traffic to Airport Road.<br />
Recommendation #4: Use Technology to Enhance <strong>Freight</strong> Operations<br />
One of the key differences between<br />
commercial truck and passenger<br />
travel is the tendency for long<br />
distance, multi-jurisdictional trips<br />
required for freight movements.<br />
While the majority of passenger<br />
vehicle movements are made for<br />
home to work, or shopping trips<br />
within a single metropolitan region,<br />
the typical for-hire commercial truck<br />
travels long distances often across<br />
multiple local and state jurisdictions.<br />
According to the 2002 Vehicle<br />
Inventory and Use Survey, the<br />
typical “for-hire” truck in Missouri<br />
averages nearly 72,000 miles per year.7<br />
Partner with<br />
the Private<br />
Sector<br />
Suggested Goal Objectives<br />
Form Regional<br />
Partnerships for<br />
Operations and<br />
ITS Data Sharing<br />
Expand<br />
Research and<br />
Development<br />
Potential Strategies for Achieving Policy Objectives<br />
•Truckways/Tollways<br />
•Open platform rail<br />
technology for medium<br />
haul freight<br />
•Container on barge<br />
•Containerized grain<br />
4.<br />
Use Innovative<br />
Technology<br />
•ITS Corridor Initiatives<br />
•Form regional<br />
partnering agreements<br />
•Participate in Federal<br />
initiatives such as CVISN<br />
•Fund regional university<br />
research<br />
•Partner with neighboring<br />
jurisdictions<br />
A prominent goal of ITS integration strategies over the next 10 to 20 years is to significantly increase<br />
the efficiency of freight operations by making available accurate real time information to carriers and<br />
commercial vehicle drivers across heavily traveled corridors. The integration of public and private<br />
information systems along significant corridors such as I-70, I-44 and I-55 can also provide motor<br />
carrier enforcement agencies the opportunity to streamline safety and security assurance procedures.<br />
Public / private data exchange is also likely to become a hallmark of efficient intermodal operations.<br />
Electronic transactions supporting intermodal interchanges among trucks, railroads, ships, and airfreight<br />
lines can reduce wait times at terminals and staging areas.<br />
Wilbur Smith Associates<br />
HNTB Corporation
Missouri Statewide <strong>Freight</strong> Study Page 16<br />
<strong>Executive</strong> <strong>Summary</strong><br />
Recommendation #5: Involve <strong>Freight</strong> Stakeholders in the Process<br />
Recently MoDOT completed<br />
the Planning Framework that<br />
emphasizes the importance of<br />
having a transparent planning<br />
process that merges public<br />
involvement with decision<br />
making.<br />
The general public generally<br />
views freight, and the vehicles<br />
used to transport goods, as<br />
obstacles to their personal travel<br />
needs: i.e. large intimidating<br />
trucks or long annoying trains.<br />
However, the logistics<br />
revolution is changing the<br />
Suggested Goal Objectives<br />
Include Affected Interests<br />
in Transportation<br />
Build Consensus and<br />
Political Support for<br />
Decisions<br />
Transportation Investments<br />
Potential Strategies for Achieving Policy Objectives<br />
•Conduct periodic stakeholder<br />
surveys / interviews<br />
•Form a <strong>Freight</strong> Advisory Committee<br />
•Include <strong>Freight</strong> Stakeholders at the<br />
District and Project Level<br />
5.<br />
Involve<br />
Stakeholders<br />
in Planning<br />
• Partner with Chambers of Commerce<br />
and organizations such as CSCMP<br />
•Partner with Carrier Associations<br />
•Hold or participate in forums<br />
nature of business competition. The ability of state and local economies to compete and supply<br />
quality jobs is becoming increasingly dependent on the accommodation of business transportation<br />
needs. Transportation affects many facets of the private sector – but often they are affected<br />
differently than stakeholders using the transportation system for commuting, shopping or personal<br />
auto trips. When planning transportation systems, public agencies must also think about whom the<br />
system is serving, and there can be significant differences between facilities designed exclusively for<br />
passenger travel, versus a facility designed to move freight. For instance, while passengers are<br />
interested in smooth pavements and the ability to maintain speed, shippers and trucking companies<br />
will be more interested in whether the pavement or bridge is weight restricted.<br />
While commercial transport is important to the business and industrial sectors generating and<br />
receiving freight, all facets of society benefit from efficient freight transport as end users of goods<br />
and services. Historically transportation planning agencies have fostered arms length relationships<br />
with modal representatives from trucking, rail and waterway carriers. Shippers and receivers, the real<br />
stakeholders in economic development and job creation, have typically not been involved in the<br />
transportation planning process at all. This public sector attitude toward freight can be attributed to<br />
many factors, including the lack of communication between the public and private sectors, the<br />
attitude that investments in freight infrastructure is a public subsidy benefiting private business,<br />
fierce competitive between the freight modes, and the historical focus of public funds aimed<br />
towards passenger transport.<br />
To engage private sector freight stakeholders requires different approaches, but remains simply<br />
another form of public involvement. Defining a successful program for engaging the private-sector<br />
might be modeled after the definitions for successful public involvement. Ultimately stakeholders<br />
affected by the process or project should be informed and to feel that they have had an opportunity<br />
for input. Virtually every guide to public involvement also emphasizes the need for a variety of<br />
approaches or techniques for getting the message out and for gathering stakeholder feedback.<br />
Creating a formal freight advisory group has become a common first step for many public<br />
transportation agencies wanting routine, meaningful dialogue between planners and freight interests.<br />
Wilbur Smith Associates<br />
HNTB Corporation
Missouri Statewide <strong>Freight</strong> Study Page 17<br />
<strong>Executive</strong> <strong>Summary</strong><br />
While shippers, carriers and planners sometimes work together, more often than not the shippers<br />
and their customers (who are also key stakeholders) are not typically engaged in the transportation<br />
planning process, even though it may directly affect their business operations. Planners, carriers and<br />
shippers should all be included in meaningful, routine dialogues for creative problem-solving that is<br />
required of this unique type of transportation planning.<br />
More recently state governments have also looked to the private sector to assist in project<br />
prioritization, and to assist their efforts to move freight projects forward.<br />
Using freight advisory groups to provide policy guidance, and even provide direct input into the<br />
program prioritization is becoming a more common practice among state and MPO planning<br />
agencies.<br />
The federal transportation reauthorization package for instance further emphasizes freight in the<br />
planning process. For example, among the provisions in The Safe, Accountable, Flexible and<br />
Efficient Transportation Equity Act: A Legacy for Users (SAFETEA-LU) reauthorization package:<br />
• A requirement that freight transportation needs and projects be incorporated in<br />
statewide and urban plans and project development processes;<br />
• Expansion of STP eligibility to include intermodal transfer facilities access to them;<br />
• Expansion of TIFIA eligibility to include public or private freight rail projects.<br />
• The creation of authority to issue private activity bonds to finance intermodal<br />
facilities and freight rail projects.<br />
• The inclusion of a freight emphasis in a planning capacity building program<br />
Philosophical approaches to planning in the public and private sectors are usually quite divergent.<br />
Often public transportation planners are looking for input to assist in formulating long range, 20<br />
year plans. In the private sector, long-range may be seen as a matter of months or a few years. To<br />
create momentum early in the formation of an advisory group, it is often helpful to identify a<br />
number of “quick start” projects. Quick start projects can provide the sorts of tangible outcomes<br />
business interests expect and allow public agencies to educate freight stakeholders about the intricate<br />
and challenging transportation planning process.<br />
It is often most effective to work with state or regional Chambers of Commerce and local Council<br />
of Logistics Management Area Roundtables to help get an advisory group up and running.<br />
Universities with a strong logistics or supply chain management program can also be great resources<br />
for identifying key industry players. A freight advisory group can assist MoDOT in identifying and<br />
prioritizing transportation projects that can have a positive impact on freight mobility.<br />
Support Local / Regional Efforts to Engage <strong>Freight</strong> Stakeholders<br />
During the literature review of freight related efforts that have been undertake by urban and regional<br />
governments in Missouri, several examples of freight stakeholder outreach were discovered.<br />
MoDOT should encourage the inclusion of freight stakeholders in the MPO and district planning<br />
processes. It is also important to be aware of local activities to prevent the same stakeholders being<br />
called upon repeatedly for the same information.<br />
Wilbur Smith Associates<br />
HNTB Corporation
Missouri Statewide <strong>Freight</strong> Study Page 18<br />
<strong>Executive</strong> <strong>Summary</strong><br />
1 Bureau of Transportation Statistics (BTS) Transborder Database & press release at: http://www.bts.gov<br />
2 Missouri Department of Transportation, REQUEST FOR PROPOSAL: <strong>Freight</strong> Movements on Missouri’s<br />
Transportation System, March 6, 2003. pp.1.<br />
3 U.S. DOT, Bureau of Transportation Statistics; State Transportation Statistics 2004<br />
4 WilburSmith Associates, Latin American Trade and Transportation Study; <strong>Executive</strong> <strong>Summary</strong> March 2001.<br />
5 Ibid. FHWA<br />
6 Methods of Travel Time Management in <strong>Freight</strong> Significant Corridors, FHWA and ATRI, Paper Submission to the 2005 TRB<br />
Annual Meeting. January 2005. pp. 1<br />
7 U.S. Census Bureau, 2002 Vehicle Inventory and Use Survey: Missouri. Table 2a, page 12.<br />
Wilbur Smith Associates<br />
HNTB Corporation


