MO Freight Executive Summary
MO Freight Executive Summary
MO Freight Executive Summary

You also want an ePaper? Increase the reach of your titles
YUMPU automatically turns print PDFs into web optimized ePapers that Google loves.
Missouri Statewide <strong>Freight</strong> Study Page 3<br />
<strong>Executive</strong> <strong>Summary</strong><br />
Missouri’s <strong>Freight</strong> Movement Profile<br />
In 2001, Missouri’s transportation system facilitated the movement of approximately 1.1<br />
billion tons of freight with an estimated value exceeding $1.3 trillion dollars.<br />
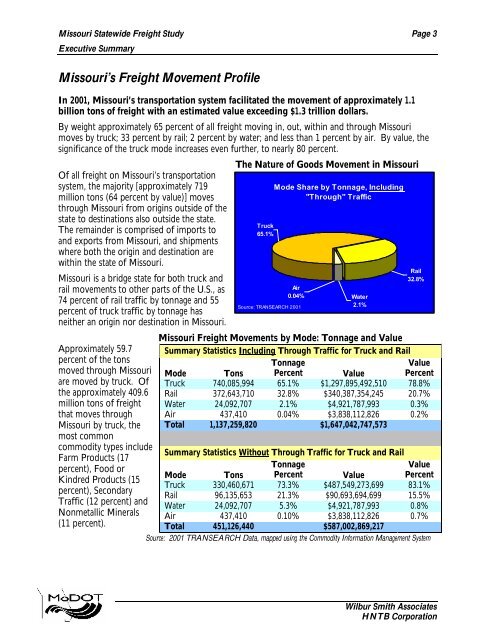
By weight approximately 65 percent of all freight moving in, out, within and through Missouri<br />
moves by truck; 33 percent by rail; 2 percent by water; and less than 1 percent by air. By value, the<br />
significance of the truck mode increases even further, to nearly 80 percent.<br />
Of all freight on Missouri’s transportation<br />
system, the majority [approximately 719<br />
million tons (64 percent by value)] moves<br />
through Missouri from origins outside of the<br />
state to destinations also outside the state.<br />
The remainder is comprised of imports to<br />
and exports from Missouri, and shipments<br />
where both the origin and destination are<br />
within the state of Missouri.<br />
Missouri is a bridge state for both truck and<br />
rail movements to other parts of the U.S., as<br />
74 percent of rail traffic by tonnage and 55<br />
percent of truck traffic by tonnage has<br />
neither an origin nor destination in Missouri.<br />
Approximately 59.7<br />
percent of the tons<br />
moved through Missouri<br />
are moved by truck. Of<br />
the approximately 409.6<br />
million tons of freight<br />
that moves through<br />
Missouri by truck, the<br />
most common<br />
commodity types include<br />
Farm Products (17<br />
percent), Food or<br />
Kindred Products (15<br />
percent), Secondary<br />
Traffic (12 percent) and<br />
Nonmetallic Minerals<br />
(11 percent).<br />
The Nature of Goods Movement in Missouri<br />
Truck<br />
65.1%<br />
Mode Share by Tonnage, Including<br />
"Through" Traffic<br />
Air<br />
0.04%<br />
Source: TRANSEARCH 2001<br />
Water<br />
2.1%<br />
Rail<br />
32.8%<br />
Missouri <strong>Freight</strong> Movements by Mode: Tonnage and Value<br />
<strong>Summary</strong> Statistics Including Through Traffic for Truck and Rail<br />
Tonnage<br />
Value<br />
Mode Tons Percent Value Percent<br />
Truck 740,085,994 65.1% $1,297,895,492,510 78.8%<br />
Rail 372,643,710 32.8% $340,387,354,245 20.7%<br />
Water 24,092,707 2.1% $4,921,787,993 0.3%<br />
Air 437,410 0.04% $3,838,112,826 0.2%<br />
Total 1,137,259,820 $1,647,042,747,573<br />
<strong>Summary</strong> Statistics Without Through Traffic for Truck and Rail<br />
Tonnage<br />
Value<br />
Mode Tons Percent Value Percent<br />
Truck 330,460,671 73.3% $487,549,273,699 83.1%<br />
Rail 96,135,653 21.3% $90,693,694,699 15.5%<br />
Water 24,092,707 5.3% $4,921,787,993 0.8%<br />
Air 437,410 0.10% $3,838,112,826 0.7%<br />
Total 451,126,440 $587,002,869,217<br />
Source: 2001 TRANSEARCH Data, mapped using the Commodity Information Management System<br />
Wilbur Smith Associates<br />
HNTB Corporation