Elementary DataBook 2001-2002 - Jefferson County Public Schools
Elementary DataBook 2001-2002 - Jefferson County Public Schools
Elementary DataBook 2001-2002 - Jefferson County Public Schools

You also want an ePaper? Increase the reach of your titles
YUMPU automatically turns print PDFs into web optimized ePapers that Google loves.
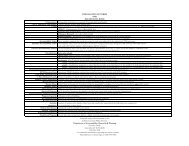
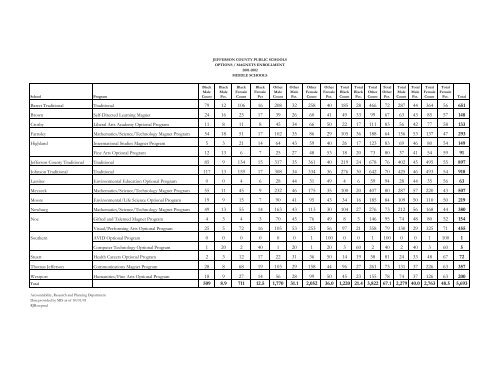
JEFFERSON COUNTY PUBLIC SCHOOLS<br />
OPTIONS / MAGNETS ENROLLMENT<br />
<strong>2001</strong>-<strong>2002</strong><br />
MIDDLE SCHOOLS<br />
School<br />
Program<br />
Black<br />
Male<br />
Count<br />
Black<br />
Male<br />
Pct.<br />
Black<br />
Female<br />
Count<br />
Barret Traditional Traditional 79 12 106 16 208 32 258 40 185 28 466 72 287 44 364 56 651<br />
Brown Self-Directed Learning Magnet 24 16 25 17 39 26 60 41 49 33 99 67 63 43 85 57 148<br />
Crosby Liberal Arts Academy Optional Program 11 8 11 8 45 34 66 50 22 17 111 83 56 42 77 58 133<br />
Farnsley Mathematics/Science/Technology Magnet Program 54 18 51 17 102 35 86 29 105 36 188 64 156 53 137 47 293<br />
Highland Intermational Studies Magnet Program 5 3 21 14 64 43 59 40 26 17 123 83 69 46 80 54 149<br />
Black<br />
Female<br />
Pct<br />
Other<br />
Male<br />
Count<br />
Fine Arts Optional Program 12 13 6 7 25 27 48 53 18 20 73 80 37 41 54 59 91<br />
<strong>Jefferson</strong> <strong>County</strong> Traditional Traditional 85 9 134 15 317 35 361 40 219 24 678 76 402 45 495 55 897<br />
Johnson Traditional Traditional 117 13 159 17 308 34 334 36 276 30 642 70 425 46 493 54 918<br />
Lassiter Environmental Education Optional Program 0 0 4 6 28 44 31 49 4 6 59 94 28 44 35 56 63<br />
Meyzeek Mathematics/Science/Technology Magnet Program 55 11 45 9 232 46 175 35 100 20 407 80 287 57 220 43 507<br />
Moore Environmental/Life Science Optional Program 19 9 15 7 90 41 95 43 34 16 185 84 109 50 110 50 219<br />
Newburg Mathematics/Science/Technology Magnet Program 49 13 55 14 163 43 113 30 104 27 276 73 212 56 168 44 380<br />
Noe Gifted and Talented Magnet Program 4 3 4 3 70 45 76 49 8 5 146 95 74 48 80 52 154<br />
Visual/Performing Arts Optional Program 25 5 72 16 105 53 253 56 97 21 358 79 130 29 325 71 455<br />
Southern AVID Optional Program 0 0 0 0 0 0 1 100 0 0 1 100 0 0 1 100 1<br />
Computer Technology Optional Program 1 20 2 40 1 20 1 20 3 60 2 40 2 40 3 60 5<br />
Stuart Health Careers Optional Program 2 3 12 17 22 31 36 50 14 19 58 81 24 33 48 67 72<br />
Thomas <strong>Jefferson</strong> Communications Magnet Program 28 8 68 19 103 29 158 44 96 27 261 73 131 37 226 63 357<br />
Westport Humanities/Fine Arts Optional Program 18 9 27 14 56 28 99 50 45 23 155 78 74 37 126 63 200<br />
Total 509 8.9 711 12.5 1,770 31.1 2,052 36.0 1,220 21.4 3,822 67.1 2,279 40.0 2,763 48.5 5,693<br />
Other<br />
Male<br />
Pct.<br />
Other<br />
Female<br />
Count<br />
Other<br />
Female<br />
Pct.<br />
Total<br />
Black<br />
Count<br />
Total<br />
Black<br />
Pct.<br />
Total<br />
Other<br />
Count<br />
Total<br />
Other<br />
Pct.<br />
Total<br />
Male<br />
Count<br />
Total<br />
Male<br />
Pct.<br />
Total<br />
Female<br />
Count<br />
Total<br />
Female<br />
Pct.<br />
Total<br />
Accountability, Research and Planning Department<br />
Data provided by MIS as of 10/01/01<br />
RJR:se:pmd