Slow Wave Sleep Enhancement with Gaboxadol Reduces Daytime ...
Slow Wave Sleep Enhancement with Gaboxadol Reduces Daytime ...
Slow Wave Sleep Enhancement with Gaboxadol Reduces Daytime ...

Create successful ePaper yourself
Turn your PDF publications into a flip-book with our unique Google optimized e-Paper software.
<strong>Slow</strong> <strong>Wave</strong> <strong>Sleep</strong> <strong>Enhancement</strong> and <strong>Daytime</strong> <strong>Sleep</strong>iness<br />
<strong>Slow</strong> <strong>Wave</strong> <strong>Sleep</strong> <strong>Enhancement</strong> <strong>with</strong> <strong>Gaboxadol</strong> <strong>Reduces</strong> <strong>Daytime</strong> <strong>Sleep</strong>iness<br />
During <strong>Sleep</strong> Restriction<br />
James K. Walsh, PhD 1,2 ; Ellen Snyder, PhD 3 ; Janine Hall, MS 1,2 ; Angela C. Randazzo, PhD 1 ; Kara Griffin, MA 1 ; John Groeger, PhD 4 ; Rhody Eisenstein, MD 1 ;<br />
Stephen D. Feren, MD 1 ; Pam Dickey, BS 1 ; Paula K. Schweitzer, PhD 1<br />
1<br />
<strong>Sleep</strong> Medicine & Research Center, St. John’s Mercy Medical Center/St. Luke’s Hospital, St. Louis, MO; 2 Department of Psychology, St. Louis<br />
University, St. Louis, MO; 3 Merck Research Laboratories, Upper Gwynedd, PA; 4 Surrey <strong>Sleep</strong> Research Centre and Department of Psychology,<br />
University of Surrey, Guildford, UK<br />
Study Objectives: To evaluate the impact of enhanced slow wave<br />
sleep (SWS) on behavioral, psychological, and physiological changes<br />
resulting from sleep restriction.<br />
Design: A double-blind, parallel group, placebo-controlled design was<br />
used to compare gaboxadol (GBX) 15 mg, a SWS-enhancing drug, to<br />
placebo during 4 nights of sleep restriction (5 h/night). Behavioral, psychological,<br />
and physiological measures of the impact of sleep restriction<br />
were assessed in both groups at baseline, during sleep restriction and<br />
following recovery sleep.<br />
Setting: <strong>Sleep</strong> research laboratory.<br />
Participants: Forty-one healthy adults; 9 males and 12 females (mean<br />
age: 32.0 ± 9.9 y) in the placebo group and 10 males and 10 females<br />
(mean age: 31.9 ± 10.2 y) in the GBX group.<br />
Interventions: Both experimental groups underwent 4 nights of sleep<br />
restriction. Each group received either GBX 15 mg or placebo on all<br />
sleep restriction nights, and both groups received placebo on baseline<br />
and recovery nights.<br />
Measurements and Results: Polysomnography documented a SWSenhancing<br />
effect of GBX <strong>with</strong> no group difference in total sleep time during<br />
sleep restriction. The placebo group displayed the predicted deficits<br />
Disclosure Statement<br />
This research was funded by Merck & Co., Inc., Whitehouse Station, NJ.<br />
and Lundbeck, A/S, Copenhagen, Denmark. Dr. Walsh has consulted<br />
for Pfizer, Sanofi-Aventis, Cephalon, Organon, Neurocrine Biosciences,<br />
Takeda, Actelion, Sepracor, Jazz, Elan, Guilford, Respironics, TransOral,<br />
Neurogen, GlaxoSmithKline, <strong>Sleep</strong>Tech, Somaxon, Eli Lilly, Evotec Neuroscience,<br />
Concert, and Merck. Dr. Snyder is an employee of Merck. Dr.<br />
Groeger has received research support from GlaxoSmithKline, Lundbeck<br />
H/S, and Merck and has consulted for Lundbeck H/S and Merck. Dr.<br />
Schweitzer has been a principal investigator on research projects funded<br />
by Merck, Somaxon, Evotec Neurosciences, and Jazz. The other authors<br />
have indicated no financial conflicts of interest.<br />
Editor’s Footnote<br />
The clinical development program for gaboxadol was discontinued by<br />
Merck and Lundbeck because of an overall unfavorable therapeutic profile,<br />
including lack of efficacy in a three-month study and a higher incidence<br />
of psychiatric side effects.<br />
Submitted for publication July, 2007<br />
Accepted for publication January, 2008<br />
Address correspondence to: James K. Walsh, PhD, <strong>Sleep</strong> Medicine and<br />
Research Center, 232 S. Woods Mill Road, Chesterfield, MO 63017; Tel:<br />
(314) 205-6030; Fax: (314) 205-6025; E-mail: walsjk@stlo.smhs.com<br />
due to sleep restriction on the multiple sleep latency test (MSLT) and on<br />
introspective measures of sleepiness and fatigue. Compared to placebo,<br />
the GBX group showed significantly less physiological sleepiness<br />
on the MSLT and lower levels of introspective sleepiness and fatigue<br />
during sleep restriction. There were no differences between groups<br />
on the psychomotor vigilance task (PVT) and a cognitive test battery,<br />
but these measures were minimally affected by sleep restriction in this<br />
study. The correlation between change from baseline in MSLT on Day<br />
6 and change from baseline in SWS on Night 6 was significant in the<br />
GBX group and in both groups combined.<br />
Conclusions: The results of this study are consistent <strong>with</strong> the hypothesis<br />
that enhanced SWS, in this study produced by GBX, reduces physiological<br />
sleep tendency and introspective sleepiness and fatigue which<br />
typically result from sleep restriction.<br />
Keywords: <strong>Slow</strong> wave sleep, slow wave activity, sleep restriction,<br />
sleepiness, gaboxadol<br />
Citation: Walsh JK; Snyder E; Hall J; Randazzo AC; Griffin K; Groeger<br />
J; Eisenstein R; Feren SD; Dickey P; Schweitzer PK. <strong>Slow</strong> <strong>Wave</strong> <strong>Sleep</strong><br />
<strong>Enhancement</strong> <strong>with</strong> <strong>Gaboxadol</strong> <strong>Reduces</strong> <strong>Daytime</strong> <strong>Sleep</strong>iness During<br />
<strong>Sleep</strong> Restriction. SLEEP 2008;31(5):659-672.<br />
A NUMBER OF INVESTIGATORS HAVE PROPOSED<br />
THAT INCREASED SLOW WAVE SLEEP (SWS), AS MEA-<br />
SURED VISUALLY, OR ITS SPECTRAL POWER DENSITY<br />
counterpart, slow wave activity (SWA), represent ongoing<br />
cortical recovery from prior wakefulness. Moreover, NREM<br />
sleep periods <strong>with</strong> more SWS/SWA are hypothesized to be periods<br />
of relatively heightened neurophysiologic restoration or<br />
recuperation. 1,2 The hypothesized role of SWS in sleep homeostatic<br />
regulation has been the result of a number of findings, including:<br />
(1) SWA increase in proportion to the duration of prior<br />
wakefulness, 3 (2) reduced SWA during nocturnal sleep following<br />
afternoon/evening naps, 4 (3) the decline in SWA across a<br />
night of sleep, 5 and (4) increased SWS following fragmented<br />
sleep. 6 The two-process model of sleep regulation views heightened<br />
SWS/SWA as reflecting Process S, the homeostatic component.<br />
7 Some authors have proposed that increased SWS/<br />
SWA, represents ongoing cortical recovery from prior wakefulness<br />
activities. That is, periods <strong>with</strong> more SWS/SWA have been<br />
widely hypothesized to be a time of relatively heightened neurophysiologic<br />
restoration or recuperation. 8,9 Tononi and Cirelli 10<br />
hypothesize more specifically that SWS/SWA reflect synaptic<br />
changes necessary to conserve energy, save space for future<br />
synaptic growth, and to enhance signal-to-noise ratio.<br />
On the other hand, most investigations of selective deprivation<br />
of SWS or stage 4 alone have failed to support the concept<br />
SLEEP, Vol. 31, No. 5, 2008 659<br />
<strong>Slow</strong> <strong>Wave</strong> <strong>Sleep</strong>, <strong>Sleep</strong>iness, Performance, <strong>Gaboxadol</strong>—Walsh et al
of enhanced recuperative “value” of SWS relative to other sleep<br />
stages. Neither performance nor alertness has been found to be<br />
impaired after reduction of SWS by approximately 25% to 90%<br />
relative to baseline. 11-14 Significant methodological limitations<br />
probably contribute to the negative findings of these studies.<br />
For example, in one study 12 more than a 50% reduction in SWS<br />
was observed in the “control” condition (i.e., designed to retain<br />
SWS), versus an 85% reduction in the “no-SWS” condition.<br />
With the additional influence of approximately 55-65 experimental<br />
arousals per night, finding differences in performance<br />
between two conditions <strong>with</strong> 50% and 85% reductions of SWS<br />
would be unlikely. Other studies by Lubin et al. 13 and Johnson<br />
et al. 14 deprived subjects of stage 4 only, not SWS, and therefore<br />
considerable SWS occurred. Compared to baseline, SWS was<br />
reduced by 78% and 63% in the 2 studies, respectively. Moreover,<br />
the sample size per condition in both studies was small<br />
(N = 4 and 7, respectively). The statistical power to detect differences<br />
in performance associated <strong>with</strong> sleep stage differences<br />
when sleep is highly disrupted by the experimental procedures<br />
is likely to be exceedingly low. Similar concerns exist for the<br />
other SWS deprivation studies. 11<br />
Drugs <strong>with</strong> varying mechanisms of action have been found<br />
to increase SWS and/or SWA, including several antagonists of<br />
5HT2 A<br />
receptors, 15,16 gabapentin and pregabalin, which are alpha-<br />
2-delta calcium channel modulators, 17,18 tiagabine, 19-21 a selective<br />
GABA reuptake inhibitor, and gaboxadol (GBX), a selective (for<br />
alpha 4<br />
delta receptors) extrasynaptic GABA A<br />
agonist. 22 Whether<br />
the increases in SWS/SWA <strong>with</strong> one or more of these drugs reflect<br />
the same or similar neural processes to those which characterize<br />
natural SWS/SWA is an important scientific question.<br />
One experimental approach to testing whether pharmacologically<br />
enhanced SWS has a functional correlate involves production<br />
of increased SWS simultaneously <strong>with</strong> sleep restriction.<br />
If enhanced SWS increases the restorative capacity of NREM<br />
sleep, the predictable consequences of sleep restriction, such<br />
as those documented by Dinges and colleagues, 23,24 should be<br />
reduced or prevented. In a prior investigation using that experimental<br />
approach, tiagabine 8 mg was found to enhance SWS<br />
and to markedly attenuate the deficit in sustained attention seen<br />
<strong>with</strong> sleep restriction, although physiologic sleep tendency was<br />
not altered by tiagabine. 25<br />
In the present study we investigated the impact of enhanced<br />
SWS/SWA <strong>with</strong> GBX 15 mg on behavioral, psychological, and<br />
physiological changes resulting from sleep restriction. GBX is<br />
a direct GABA A<br />
agonist which is selective for the extrasynaptically<br />
located alpha 4<br />
-delta receptor subtype. 26 When activated,<br />
alpha 4<br />
-delta receptors produce a tonic inhibitory conductance<br />
which is thought to result in a more stable inhibitory pattern, as<br />
compared to phasic synaptic inhibition. 27 GBX has consistently<br />
increased SWS/SWA, in a dose-related manner, in adult and<br />
elderly healthy subjects and in primary insomnia patients. 22,28-30<br />
METHODS<br />
Study Design and General Methods<br />
A randomized, double-blind, placebo-controlled, parallel<br />
groups design was used to compare GBX 15 mg and placebo.<br />
Each participant’s activities consisted of: (1) a screening office<br />
visit, (2) 8 consecutive nights/days of sleep laboratory procedures:<br />
2 screening/baseline nights and days; 4 sleep restriction<br />
nights and 2 days; 2 recovery nights and 1 day; and (3) endof-study<br />
procedures. Subjects received single-blind placebo<br />
(PBO) on screening /baseline nights as well as on both recovery<br />
nights. Subjects received PBO or GBX 15 mg in randomized<br />
double-blind fashion on the four sleep restriction nights. Study<br />
drug was administered 30 min prior to scheduled bedtime. For<br />
each subject the study period was a minimum of 11 days and a<br />
maximum of 28 days from initial screening to follow-up. The<br />
protocol was approved by the institutional review board of St.<br />
Luke’s Hospital. All subjects signed an informed consent and<br />
were compensated for participation. The study was performed<br />
in accordance <strong>with</strong> the Declaration of Helsinki and the Good<br />
Clinical Practice guidelines.<br />
The study design and methods were jointly developed by<br />
authors (JKW, JG, PKS) and sponsor representatives. Full disclosure<br />
of the data was provided by the sponsor to the authors.<br />
Data analyses were performed by Dr. Snyder, a Merck employee,<br />
and key analyses were confirmed by Dr. Schweitzer. The<br />
writing of the manuscript and interpretation of study findings<br />
was the sole responsibility of the authors.<br />
Subject Recruitment and Screening<br />
Subjects were recruited via media advertisements. A general<br />
description of the study was provided and preliminary screening<br />
was conducted by telephone. Interested and qualified persons<br />
were scheduled for a clinical screening visit during which a thorough<br />
explanation of the study was provided and subjects gave<br />
written informed consent. Clinical screening procedures included<br />
a sleep, psychiatric, and medical history; physical examination;<br />
ECG; clinical laboratory testing (hematology, chemistry, urinalysis);<br />
and urine screen for drugs of abuse. These procedures insured<br />
that subjects were free of chronic sleep disturbance, DSM-<br />
IV psychiatric diagnoses including substance abuse in the past 2<br />
years, and current or recent medical illness. Females could not<br />
be pregnant or lactating and had to confirm the use of adequate<br />
contraceptive procedures throughout the study.<br />
During the prior 2 months the subjects must have maintained<br />
a bedtime between 22:00 and 24:00 at least 5 nights per week,<br />
and usual nightly sleep duration between 6.5 and 9 h. A body<br />
mass index < 34 kg/m 2 was also required.<br />
Subjects could not work night or rotating shifts or have<br />
crossed more than 3 time zones in the prior 2 weeks. Subjects<br />
were also excluded if they used any psychotropic medication<br />
or sedating or alerting over-the-counter drugs during the prior<br />
2 weeks or 5 half-lives (whichever was longer), usually consumed<br />
more than 500 mg caffeine per day, or were regular users<br />
of nicotine. Participation in a clinical research trial or weight<br />
loss program <strong>with</strong>in 30 days, prior exposure to GBX, history of<br />
a positive test for human immunodeficiency virus, hepatitis B<br />
surface antigen, and/or hepatitis C virus were additional exclusion<br />
criteria.<br />
The screening visit also included training on performance tests<br />
used in the study, and completion of the Horne-Ostberg Morningness-Eveningness<br />
Questionnaire 31 and the <strong>Sleep</strong> Timing Questionnaire.<br />
32 Polysomnographic (PSG) screening was performed<br />
during the first 2 nights in the sleep laboratory, and a multiple<br />
SLEEP, Vol. 31, No. 5, 2008 660<br />
<strong>Slow</strong> <strong>Wave</strong> <strong>Sleep</strong>, <strong>Sleep</strong>iness, Performance, <strong>Gaboxadol</strong>—Walsh et al
sleep latency test (MSLT) followed each screening PSG. On<br />
Night 1, respiratory recordings and leg electromyography were<br />
included. Participation was discontinued if on PSG Night 1 the<br />
apnea-hypopnea index was >10/h or the periodic leg movement<br />
arousal index was >10/h. On Night 2, total sleep time (TST) was<br />
required to be < 510 min (time in bed was 540 min), and the<br />
mean latency on the Day 2 MSLT was required to be > 7 min.<br />
Seventy-one individuals signed informed consent. Six persons<br />
<strong>with</strong>drew consent prior to randomization. Twenty-three<br />
individuals failed screening (13 MSLT, 1 TST, 8 medical, 1<br />
positive drug screen) and one person was discontinued prior to<br />
randomization because enrollment was met. Forty-one healthy<br />
male and female subjects aged 18-55 inclusive, were randomized<br />
to the 2 study groups, 21 to PBO and 20 to GBX. Randomization<br />
was based on preliminary TST and MSLT scoring and<br />
confirmed subsequently by final scoring. Thirty-nine subjects<br />
completed all study procedures; 2 subjects terminated participation<br />
early for personal reasons, 1 following Night 6 and 1<br />
following Night 7. The 2 study groups were similar in age, sex<br />
distribution, body mass index, Horne-Ostberg Morningness-<br />
Eveningness, and usual rise time and bedtime from the <strong>Sleep</strong><br />
Timing Questionnaire (Table 1).<br />
General Study Procedures<br />
Participation involved 8 consecutive nights and the intervening<br />
7 days from laboratory screening to study completion<br />
for each subject. PSG Nights 1 and 2 were screening/baseline<br />
nights. The MSLT on Day 2 served as a screening procedure.<br />
Baseline MSLT values were calculated as the mean of MSLTs<br />
on Days 1 and 2. Data from Days 1 and 2 served as baseline for<br />
other daytime measures. PSG recording time was 10 h on Night<br />
1 (22:00 to 08:00) and 9 h on Night 2 (23:00 to 08:00). The<br />
durations of the recordings on Nights 1 and 2 were selected to<br />
minimize the impact of prior sleep history. Single-blind placebo<br />
was administered on both nights to all subjects, 30 min prior to<br />
bedtime.<br />
After all screening and baseline procedures were completed<br />
subjects were randomized to receive GBX 15 mg or matching<br />
placebo on all 4 sleep restriction nights (Nights 3-6). Group<br />
assignment was stratified to ensure approximate balance in age<br />
and sex distribution. Double-blind study drug was administered<br />
at 00:30 on Nights 3-6, and PSG start time was 01:00. Preliminary<br />
sleep scoring was performed in real time so that total sleep<br />
time would be as close as possible to 5 h on each sleep restriction<br />
night. Night 3-6 PSGs were terminated at variable times<br />
when sleep duration was judged to be 5 h. Actual PSG termination<br />
time ranged from 06:05 to 06:30. Following the first 2<br />
sleep restriction nights (Nights 3 and 4), subjects were allowed<br />
to go about their normal routines from about 08:00 until approximately<br />
22:30. They were monitored <strong>with</strong> actigraphy for<br />
compliance <strong>with</strong> the instruction not to sleep when out of the<br />
laboratory. They were cautioned about the effects of sleep loss<br />
on driving and other potentially dangerous activities. Following<br />
the last 2 sleep restriction nights (Nights 5 and 6), subjects<br />
remained in the laboratory to complete the MSLT, subjective<br />
scales, neurocognitive tests, and mood measures, and collection<br />
of saliva, urine, and electrocardiographic samples (Days<br />
5 and 6).<br />
Table 1—Demographic and Baseline Characteristics of the Study<br />
Groups<br />
Placebo <strong>Gaboxadol</strong><br />
(N = 21) (N = 20)<br />
Mean (SD) Age in years 32.0 (9.9) 31.9 (10.2)<br />
Sex 9 male, 10 male,<br />
12 female 10 female<br />
Race 1 Asian, 3 black, 4 black,<br />
17 white 16 white<br />
Mean (SD) BMI, kg/m 2 25.8 (2.8) 26.6 (3.9)<br />
Morningness-Eveningness a :<br />
Moderate Morning, N 7 8<br />
Neither, N 12 11<br />
Moderate Evening, N 2 1<br />
<strong>Sleep</strong> Timing: b<br />
Mean Bedtime (SD) 23:15 (00:36) 23:08 (00:49)<br />
Mean Rise time (SD) 07:47 (00:50) 07:40 (01:02)<br />
Mean (SD) Day 2 MSLT, min. 13.0 (4.1) 12.4 (4.4)<br />
Mean (SD) Night 2 TST, min. 475.7 (37.8) 479.2 (26.6)<br />
a<br />
From the Horne and Ostberg Questionnaire at baseline<br />
b<br />
From the <strong>Sleep</strong> Timing Questionnaire at baseline<br />
All subjects received single-blind placebo on Nights 7 and 8<br />
at 21:30. PSGs were recorded from 22:00 to 10:00. Twelve hours<br />
were allotted to observe the potential differential effects of sleep<br />
restriction <strong>with</strong> and <strong>with</strong>out GBX upon recovery sleep. On Day<br />
7, between Nights 7 and 8, MSLT, subjective scales, neurocognitive<br />
tests, and mood measures were completed. Urine and saliva<br />
samples and electrocardiographic data were collected.<br />
Alcohol was prohibited beginning 24 hours prior to laboratory<br />
Night 1 for the duration of participation. Caffeine consumption<br />
on study Days 3 and 4 was limited to a single drink<br />
<strong>with</strong>in 1 h of morning awakening. No caffeine was allowed on<br />
the remaining study days. Vigorous exercise was prohibited on<br />
study Days 1, 2, 5, 6, and 7.<br />
Polysomnography<br />
Digital PSG recordings were made on all 8 study nights. The<br />
recording montage for all nights included the following: right<br />
and left electrooculogram, submental electromyogram (EMG),<br />
electrocardiogram (V5), and 10 EEG derivations (C3-A2, C4-<br />
A1, O1-A2, O2-A1, FP1-A2, FP2-A1, F3-A2, F4-A1, F7-A2,<br />
F8-A1). On Night 1, the recording also included nasal thermocouple,<br />
oximetry, respiratory movement, and right and left anterior<br />
tibialis EMG. Sampling rate for all EEG signals was 200<br />
Hz. All PSGs were scored according to standard methods 33 using<br />
the C3-A2 derivation. Each subject’s PSGs were scored by<br />
a single scorer. Spectral analysis of the EEG reported here are<br />
from the C3-A2 recording.<br />
<strong>Daytime</strong> Testing<br />
Multiple <strong>Sleep</strong> Latency Test<br />
The MSLT evaluates sleep propensity by electrophysiologically<br />
measuring the latency to fall asleep at multiple times<br />
SLEEP, Vol. 31, No. 5, 2008 661<br />
<strong>Slow</strong> <strong>Wave</strong> <strong>Sleep</strong>, <strong>Sleep</strong>iness, Performance, <strong>Gaboxadol</strong>—Walsh et al
throughout the day. MSLT subtests were conducted at 10:00,<br />
12:00, 14:00, 16:00, and 18:00 on Days 1, 2, 5, 6 and 7. The<br />
10:00 subtest was omitted on Day 7 because of the extended<br />
time in bed for recovery sleep PSGs. MSLTs were conducted<br />
using standard procedures 34 and all MSLTs for the study were<br />
scored by a single scorer.<br />
Psychomotor Vigilance Test<br />
The PVT is a simple reaction time test which measures sustained<br />
attention and psychomotor function. 35 The PVT was<br />
performed for 15 minutes at 08:25, 10:25, 12:25, 14:25, and<br />
16:25 on Days 1, 2, 5, 6, and 7; the 08:25 test was omitted on<br />
Day 7 because subjects were still in bed. Dependent variables<br />
include: mean reaction time (RT), 1/RT, number of lapses (reaction<br />
time > 500 msec), square root transformed lapses [√x<br />
+ √(x+1)], mean of the slowest 10% reaction times, and mean<br />
of the fastest 10% reaction times. Ratings of sleepiness were<br />
collected on a visual analog scale immediately before and after<br />
each PVT session.<br />
Profile of Mood States<br />
The POMS is a self-administered questionnaire that measures<br />
6 dimensions of affect or mood. Subjects rate how they<br />
feel “now” <strong>with</strong> respect to 65 adjectives on a 5-point scale (0 =<br />
“not at all,” 4 = “extremely”). 36 The POMS was completed at<br />
13:50 on Days 2, 6, and 7.<br />
Karolinska <strong>Sleep</strong>iness Scale<br />
The KSS is a 9-point rating scale which provides a subjective<br />
measurement of sleepiness (1 = very alert, 9 = very sleepy). 37<br />
The KSS was completed approximately 2 min prior to each<br />
MSLT subtest.<br />
Morning and Evening Questionnaires<br />
These were administered each evening and each morning<br />
and included visual analog scales for subjective ratings of<br />
daytime feelings including relaxation, energy, tiredness, and<br />
overall daytime function as well as ratings for sleep quality<br />
and the refreshing nature of sleep. Subjects also estimated<br />
sleep latency, sleep duration, and number of awakenings during<br />
sleep.<br />
Salivary Cortisol Samples<br />
Salivary cortisol samples were collected hourly from 14:20<br />
to 21:20 on Days 2, 6, and 7. No food or drink was allowed for<br />
30 min before each sample collection. Each subject inserted a<br />
cotton salivette (Sarstedt AG & Co., Numbrecht, Germany) into<br />
his or her mouth. The salivette was chewed until the subject<br />
could no longer prevent swallowing excess saliva produced.<br />
The salivette was then placed in a tube, weighed to assure adequate<br />
saturation, and then stored at −20°C until shipped to<br />
Esoterix, Inc. (Calabrasas Hills, CA) for analysis by radioimmunoassay.<br />
Urine Catecholamine Determinations<br />
These determinations were made from 2 contiguous 12-hour<br />
aliquots (22:00 to 10:00 and 10:00 to 22:00) on Night2/Day2,<br />
Night 6/Day 6, and Night7/Day 7. Subjects collected all urine<br />
for each aliquot in a single container which contained 6N hydrochloric<br />
acid (Fisher Scientific, Pittsburgh, PA) to preserve<br />
the specimen. At the end of each aliquot, approximately 50 milliliters<br />
of the well-mixed specimen was poured into a sealed<br />
container and stored at −20°C until sent to Esoterix for analysis<br />
by high performance liquid chromatography.<br />
Procedural Memory Test<br />
A Procedural Memory Test was administered at baseline<br />
and at the end of sleep restriction. The task required subjects to<br />
press a series of numeric keys in a predetermined sequence. The<br />
number sequence was continuously displayed throughout training<br />
and testing. Twelve 30-sec training trials occurred at 09:10<br />
on Days 1 and 5. Each training session used a single unique<br />
number sequence. Three 30-sec testing trials were conducted<br />
approximately 24 hours later on Days 2 and 6, using the number<br />
sequence from the prior training day. The number and accuracy<br />
of sequences were recorded.<br />
Cognitive Testing Battery<br />
A battery consisting of 14 individual tests (see appendix) was<br />
administered at 10:40, 14:40, and 16:40 on Days 1, 2, 5, 6, and<br />
7. Memory, attention, executive function, and other cognitive<br />
domains were assessed. Total testing time was 40 min.<br />
Statistical Analyses<br />
The prespecified criteria for the full analyses set included all<br />
subjects who had a baseline value (which was used as a covariate<br />
in all models), took the randomized study medication on at<br />
least one sleep restriction night, and had a sleep restriction value.<br />
All 41 subjects (20 GBX and 21 placebo) took study medication<br />
on all study nights and all were included in the full analysis<br />
set. MSLT and SWS were also analyzed using the per-protocol<br />
set (N = 33), which excluded data for subjects <strong>with</strong> predefined<br />
protocol violations. Prior to unblinding, the following protocol<br />
violations were noted: 4 subjects had TST > 510 min on Night 2<br />
(range 513.5–525 min <strong>with</strong> only one > 516 min) and one subject<br />
had mean MSLT on Day 2 of < 7 min (6.7 min). These violations<br />
occurred because randomization was based on preliminary scoring.<br />
In addition, actigraphy indicated napping during the daytime<br />
likely occurred on the first and/or second sleep-restriction day<br />
in three individuals. Analyses excluding the 8 protocol violators<br />
produced the same group differences, at times <strong>with</strong> increased significance<br />
levels, as compared to the full analysis set comparisons.<br />
Analysis of safety endpoints included all subjects as treated; in<br />
this study all 41 subjects received the correct treatment (i.e., that<br />
to which the subject was randomized).<br />
For endpoints measured multiple times per day (MSLT, KSS,<br />
PVT and cognitive battery endpoints), a mixed model <strong>with</strong> an<br />
unstructured covariance matrix to account for the correlation<br />
between observations on the same subject over time was used<br />
SLEEP, Vol. 31, No. 5, 2008 662<br />
<strong>Slow</strong> <strong>Wave</strong> <strong>Sleep</strong>, <strong>Sleep</strong>iness, Performance, <strong>Gaboxadol</strong>—Walsh et al
A<br />
B<br />
140<br />
700<br />
120<br />
600<br />
100<br />
500<br />
Minutes<br />
80<br />
60<br />
Minutes<br />
400<br />
300<br />
40<br />
200<br />
20<br />
100<br />
0<br />
1 2 3 4 5 6 7 8<br />
Baseline <strong>Sleep</strong> Restriction Recovery<br />
Night<br />
0<br />
1 2 3 4 5 6 7 8<br />
Baseline <strong>Sleep</strong> Restriction Recovery<br />
Night<br />
C<br />
D<br />
120<br />
80<br />
100<br />
60<br />
80<br />
Minutes<br />
60<br />
Number<br />
40<br />
40<br />
20<br />
20<br />
0<br />
1 2 3 4 5 6 7 8<br />
Baseline <strong>Sleep</strong> Restriction Recovery<br />
0<br />
1 2 3 4 5 6 7 8<br />
Baseline <strong>Sleep</strong> Restriction Recovery<br />
Night<br />
Night<br />
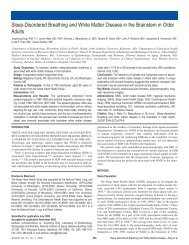
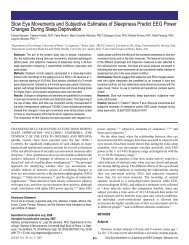
Figure 1—Unadjusted (observed) mean minutes of slow wave sleep (Panel A), total sleep time (Panel B), minutes of stage 1 (Panel C), and<br />
shifts to wake or stage 1 (Panel D) on Nights 1-8 for both study groups. Error bars indicate standard deviations. Time in bed varied across<br />
Nights (9 h on baseline Night 2, approximately 5 h on Nights 3-6, 12 h on Nights 7 and 8). All subjects received placebo on Nights 1, 2, 7,<br />
and 8. Double-blind GBX 15 mg (filled symbols) or placebo (open symbols) were administered on Nights 3-6. SWS was significantly greater<br />
and stage 1 and shifts to wake or 1 were significantly less for the GBX group as compared to the placebo group on Nights 3-6 (P < 0.001 for<br />
each). Total sleep time did not differ between groups on any night. No variable differed between groups at baseline (Nights 1 and 2) or on<br />
recovery nights (7 and 8).<br />
to evaluate treatment group differences while controlling for<br />
age, sex, and baseline value. A general linear model controlling<br />
for age, sex, and baseline value was used for endpoints<br />
measured once per day (PSG variables, morning and evening<br />
diary endpoints, POMS endpoints and overnight differences in<br />
the Procedural Memory Test). The mean over the last 2 sleep<br />
restriction days (at each time point for MSLT, KSS, PVT and<br />
cognitive battery endpoints) was used for the treatment value<br />
and the mean over the 2 baseline days (at each time point for<br />
MSLT, KSS, PVT and cognitive battery endpoints) was used<br />
for the baseline value. The PSG results were similar when the<br />
mean of all four sleep restriction nights was used as the treatment<br />
value and PSG Night 2 alone was used as baseline. If the<br />
value for a time point was missing on one of the last 2 sleep<br />
restriction days then the value for the non-missing day was used<br />
rather than the mean. No imputation was made for missing data<br />
(at a time point) after the measures were averaged over the last<br />
2 sleep restriction days. For daytime measures, all data were<br />
missing for Day 6 for one subject. That same subject was missing<br />
the 18:00 data point on the MSLT on Day 5. The other time<br />
points on Day 5 for this subject were included from the analysis<br />
which included a factor for time of day, since the model<br />
appropriately handles the missing data. This subject was also<br />
included in the ANCOVA performed using means for the entire<br />
day; Day 5 values were used as the mean of Days 5 and 6. A<br />
second subject, missing an 18:00 data point on Day 6, was also<br />
included in the analysis which included a factor for time of day,<br />
as well as in the ANCOVA. We included in the ANCOVA (for<br />
the MSLT, PVT, KSS, etc) all subjects having values for at least<br />
4 time points on a given day. Age, sex, and baseline values were<br />
used as covariates in all analyses.<br />
Because the hypotheses of interest were directional in nature<br />
(e.g., GBX group would show higher MSLT scores and higher<br />
SWS values), one-sided significance tests were used <strong>with</strong> α<br />
equal to 0.05. Power calculations were conducted <strong>with</strong> the assumption<br />
of one-sided statistical comparisons.<br />
When statistical comparisons are being described the values<br />
reported in the text are least square means generated by the<br />
models (unless noted otherwise). Error estimates indicated by<br />
± refers to the standard error for least square means and for difference<br />
scores, and standard deviations for unadjusted means.<br />
In Tables 2-5 and Figures 1 and 3 unadjusted (observed) means<br />
and standard deviations are presented for the readers’ convenience.<br />
Mean power spectra were computed for each subject by 1-Hz<br />
bin (ranging from 1 to 32 Hz) relative to the average of baseline<br />
SLEEP, Vol. 31, No. 5, 2008 663<br />
<strong>Slow</strong> <strong>Wave</strong> <strong>Sleep</strong>, <strong>Sleep</strong>iness, Performance, <strong>Gaboxadol</strong>—Walsh et al
Nights 1 and 2 during all NREM (Stages 1, 2, 3, and 4) epochs.<br />
Power density values at baseline were calculated for the entire<br />
(9 h) night and for the first 5 h of sleep and comparisons to<br />
sleep restriction nights were made <strong>with</strong> both. No correction was<br />
made for multiplicity.<br />
Correlation and partial correlations (controlling for age and<br />
sex) were computed for changes from baseline in MSLT and<br />
changes from baseline in KSS versus changes from baseline<br />
in PSG variables including SWS and power density endpoints.<br />
Principal components analysis was used to reduce the number<br />
of power density ranges by identification of clusters of 1-Hz<br />
bins that accounted for significant portions of the variance. The<br />
frequency clusters reported in Table 5 are based on the results<br />
of this analysis.<br />
MSLT was the a priori primary dependent variable and was<br />
used for power calculations. Assuming 20 evaluable subjects<br />
per group and a standard deviation of 2.5 min, the study was<br />
planned to have 80% power to declare significant (one-sided<br />
test, 5% level of significance) a 2-min difference between<br />
groups in change from baseline MSLT scores.<br />
Effect sizes (i.e., Cohen’s d) were computed using parameter<br />
estimates from the regression models for exploratory endpoints<br />
such as those in the neurocognitive battery, self-reported sleep<br />
measures from the morning and evening diaries, and subscale<br />
endpoints from the POMS.<br />
RESULTS<br />
<strong>Sleep</strong> Restriction Period<br />
Polysomnography<br />
Unadjusted (observed) mean PSG data for baseline, sleep restriction,<br />
and recovery nights for both groups are shown in Table<br />
2. Groups were numerically very similar at baseline. Least<br />
square mean TST during sleep restriction (Nights 3-6) did not<br />
differ between groups (PBO = 299.4 ± 0.94; GBX = 300.8 ±<br />
0.96 min; Figure 1) as predicted from the restricted time in bed.<br />
During sleep restriction the GBX group demonstrated significantly<br />
more stage 4 and SWS (stage 3 plus stage 4) compared<br />
to the PBO group (P < 0.001 for both). GBX averaged 20.5 min<br />
more SWS on the last 2 sleep restriction nights (5 and 6) and<br />
21.8 min more SWS than PBO on all 4 sleep restriction nights<br />
(3 through 6). Compared to baseline, GBX averaged 17.2 more<br />
min of SWS on Nights 3-6, whereas the PBO group averaged<br />
1.8 more min than at baseline on Nights 3-6 (Figure 1). During<br />
sleep restriction as compared to PBO, GBX also had less stage<br />
1 sleep (7.1 ± 2.4 minutes less on Nights 5-6, P = 0.003 and 9.3<br />
± 2.1 min less on Nights 3-6, P < 0.001; Figure 1), less REM<br />
(9.7 ± 4.2 min less on Nights 5-6, P = 0.014 and 6.7 ± 3.2 min<br />
less on Nights 3-6, P = 0.022), fewer shifts to wake or stage 1<br />
(5.4 ± 2.1 fewer on Nights 5-6, P = 0.007 and 5.4 ± 1.8 fewer<br />
on Nights 3-6, P < 0.001; Figure 1), and a longer REM latency<br />
(13.7 ± 6.1 min longer on Nights 5-6, P = 0.015 and 11.8 ± 5.9<br />
min longer on Nights 3-6, P = 0.027). WASO did not differ<br />
between groups on Nights 5-6 (P = 0.26) but averaged 3.0 ±<br />
1.5 min less on Nights 3-6 <strong>with</strong> GBX (P = 0.03). There were no<br />
group differences for latency to persistent sleep (LPS), stage 2,<br />
or stage 3.<br />
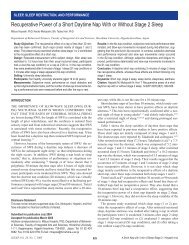
Spectral Analyses<br />
Spectral analysis of the EEG produced power density findings<br />
consistent <strong>with</strong> the visually scored increase in SWS <strong>with</strong><br />
GBX. Figure 2 illustrates the group differences in relative (to<br />
the mean of baseline Nights 1 and 2) NREM power density during<br />
the first 5 h of the recording for each sleep restriction night<br />
individually and for the average of Nights 5-6. The specific preplanned<br />
statistical comparisons were made between groups for<br />
the mean values of Nights 5-6, and differences between groups<br />
are shown in the figure. In general, GBX significantly increased<br />
relative power density, as compared to PBO, in all 1-Hz frequency<br />
bins from 1 to 8 Hz.<br />
Inspection of the placebo group data show that sleep restriction<br />
alone produced mild numerical changes in relative spectral<br />
power density, <strong>with</strong> the spectral profile showing increases and<br />
decreases at approximately the same frequencies as seen <strong>with</strong><br />
GBX, although at slow frequencies the magnitude of change<br />
was much smaller.<br />
Group comparisons in relative spectral power density were<br />
also conducted using the average of all 4 sleep restriction nights<br />
and for each sleep restriction night alone. These analyses were<br />
in agreement <strong>with</strong> the data for Nights 5-6 presented above. Relative<br />
power was also calculated using 9 h of baseline and the<br />
group differences were essentially identical to those obtained<br />
using 5 h of baseline data. In all of these additional analyses,<br />
GBX produced relative spectral power increases as compared<br />
to PBO at all frequencies up to 8 Hz.<br />
Self-reported Ratings of <strong>Sleep</strong><br />
GBX subjects reported fewer awakenings on average during<br />
Nights 5 and 6 than PBO (GBX 0.36 ± 0.15; PBO 0.97 ± 0.15;<br />
P = 0.003). There were no other group differences in subjective<br />
ratings of sleep including ratings of sleep quality and the restorative<br />
nature of sleep. Unadjusted (observed) self-report measures<br />
of sleep for both groups on each study night are shown<br />
in Table 3.<br />
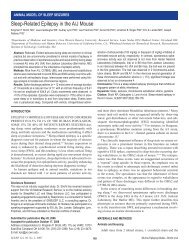
Multiple <strong>Sleep</strong> Latency Test<br />
Baseline (Days 1 and 2) unadjusted mean MSLT values for<br />
the 2 groups were nearly identical and were consistent <strong>with</strong> normal<br />
alertness levels (PBO 12.4 ± 3.9; GBX 12.2 ± 4.2 min). During<br />
sleep restriction MSLT latencies were considerably reduced<br />
as anticipated; however, the GBX group was significantly less<br />
sleepy than the PBO group (P = 0.047; see Figure 3). The PBO<br />
group mean for Days 5 and 6 decreased to 5.8 ± 0.81 min during<br />
sleep restriction, whereas the GBX group mean latency was 7.8<br />
± 0.83 min. A supportive analysis on precomputed MSLT daily<br />
mean values using a general linear model (controlling for age,<br />
sex and baseline value), also indicated that the groups differed<br />
significantly (P = 0.033). Exclusion of protocol violators did<br />
not change these findings.<br />
Psychomotor Vigilance Test<br />
Table 4 shows unadjusted (observed) mean data for each<br />
group for key PVT measures (Figure 4). There were no group<br />
SLEEP, Vol. 31, No. 5, 2008 664<br />
<strong>Slow</strong> <strong>Wave</strong> <strong>Sleep</strong>, <strong>Sleep</strong>iness, Performance, <strong>Gaboxadol</strong>—Walsh et al
Table 2—Observed Mean (SD) Polysomnography Variables for <strong>Gaboxadol</strong> (GBX) and Placebo (PBO) Groups on Nights 1-8<br />
Baseline <strong>Sleep</strong> Restriction Recovery<br />
Night 1 Night 2 Night 3 Night 4 Night 5 Night 6 Night 7 Night 8<br />
PBO GBX PBO GBX PBO GBX PBO GBX PBO GBX PBO GBX PBO GBX PBO GBX<br />
N=21 N=20 N=21 N=20 N=20 N=20 N=21 N=20 N=21 N=20 N=21 N=20 N=20 N=20 N=20 N=19<br />
Total <strong>Sleep</strong> Time (min)<br />
503.9 506.5 475.7 479.2 299.7 301.5 299.1 302.1 297.9 299.9 301.0 300.0 616.8 606.3 482.1 500.0<br />
(75.4) (39.5) (37.8) (26.7) (5.2) (6.6) (9.1) (3.8) (9.6) (5.9) (3.5) (3.4) (69.5) (60.8) (61.6) (75.0)<br />
Latency to Persistent <strong>Sleep</strong> (min)<br />
31.0 26.9 18.0 17.0 15.5 12.0 10.0 6.5 6.6 5.6 8.5 6.9 21.9 26.3 60.7 69.6<br />
(18.2) (17.5) (12.3) (11.0) (14.0) (9.9) (12.2) (5.5) (11.5) (7.0) (17.3) (7.3) (18.1) (22.3) (32.6) (50.0)<br />
Stage 1 (min)<br />
84.5 79.4 72.5 66.5 39.2 26.0 33.5 20.9 28.7 22.1 28.5 19.2 82.0 73.8 74.6 76.5<br />
(24.1) (31.9) (29.5) (27.7) (17.9) (14.5) (13.7) (10.6) (13.6) (11.2) (13.7) (8.5) (33.4) (23.9) (23.5) (27.8)<br />
Stage 2 (min)<br />
254.2 256.9 239.3 232.2 138.5 123.9 137.0 120.5 127.4 121.8 126.5 112.3 307.2 295.9 243.0 249.6<br />
(52.6) (40.2) (34.0) (32.8) (24.0) (34.3) (25.3) (36.5) (28.3) (34.0) (23.2) (38.9) (46.0) (32.2) (38.8) (40.2)<br />
Stage 3 (min)<br />
39.4 38.1 43.7 42.0 38.2 41.1 37.9 40.6 40.5 39.3 40.8 45.7 45.9 44.2 39.7 36.2<br />
(17.4) (15.1) (19.0) (17.3) (19.5) (19.7) (18.9) (16.0) (17.9) (16.0) (16.6) (18.8) (22.5) (17.6) (19.2) (17.7)<br />
Stage 4 (min)<br />
23.7 31.0 23.2 35.8 25.6 48.6 23.7 58.6 26.5 53.2 29.5 52.8 27.7 37.9 19.8 30.9<br />
(21.9) (25.0) (21.5) (26.7) (24.0) (32.9) (26.3) (35.0) (26.2) (32.6) (27.5) (37.3) (27.3) (31.6) (21.4) (26.5)<br />
SWS (min)<br />
63.0 69.0 66.9 77.8 63.9 89.7 61.6 99.1 67.1 92.6 70.3 98.5 73.6 82.1 59.4 67.1<br />
(31.9) (31.9) (33.1) (34.7) (32.5) (36.7) (32.8) (34.2) (31.1) (35.5) (32.8) (39.1) (40.6) (40.6) (32.9) (33.1)<br />
REM (min)<br />
102.1 101.3 97.1 102.6 58.2 62.0 67.0 61.6 74.7 63.4 75.8 69.9 154.0 154.6 105.1 106.8<br />
(31.0) (21.3) (25.0) (25.0) (11.6) (15.3) (13.7) (15.2) (16.8) (17.2) (16.2) (15.8) (31.0) (30.9) (25.5) (30.4)<br />
Wake After <strong>Sleep</strong> Onset (min)<br />
71.0 72.6 49.2 47.6 13.1 11.0 13.8 6.6 10.5 7.9 10.2 10.6 83.3 92.2 181.7 155.0<br />
(70.1) (38.1) (37.9) (28.0) (8.5) (8.6) (19.3) (4.5) (8.8) (5.5) (7.2) (14.1) (66.5) (62.6) (65.6) (94.7)<br />
Number of Shifts to Wake or S1<br />
46.4 50.1 50.8 50.3 31.9 28.4 31.0 23.3 26.3 23.6 28.0 21.8 42.6 40.4 43.3 40.7<br />
(14.5) (12.8) (11.7) (13.9) (11.0) (12.7) (9.5) (10.6) (11.1) (9.6) (10.2) (8.4) (14.7) (8.2) (13.4) (10.3)<br />
Number of Awakenings<br />
14.8 13.7 10.3 9.2 4.6 2.7 3.4 2.0 3.3 1.8 3.5 2.0 13.0 10.7 13.5 13.9<br />
(6.6) (6.7) (6.2) (4.3) (3.3) (2.5) (3.5) (2.2) (3.3) (1.7) (2.7) (2.4) (9.3) (6.6) (8.1) (7.7)<br />
Latency to <strong>Slow</strong> <strong>Wave</strong> <strong>Sleep</strong> (min)<br />
29.9 28.7 20.6 16.6 19.7 16.2 15.4 13.6 15.8 16.7 15.7 16.9 33.4 24.0 25.3 26.9<br />
(22.0) (21.7) (13.5) (5.4) (15.9) (7.2) (7.9) (4.6) (12.5) (13.6) (11.0) (12.0) (56.1) (14.7) (19.2) (18.9)<br />
REM Latency (min)<br />
93.2 100.7 63.3 66.6 57.8 66.6 57.8 66.7 47.5 70.6 48.8 53.5 67.5 56.7 85.0 63.2<br />
(41.4) (37.1) (16.1) (22.9) (21.7) (24.1) (31.8) (31.6) (28.3) (30.2) (22.6) (8.5) (60.9) (9.3) (67.0) (20.8)<br />
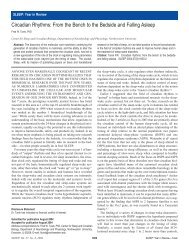
differences on most PVT measures. There was a slight decrement<br />
in the mean of the fastest 10% reaction time in the GBX<br />
group compared to PBO (P = 0.007). This result was no longer<br />
significant when the protocol violators were excluded in an ad<br />
hoc analysis (P = 0.17).<br />
To assess the effects of sleep restriction we examined the<br />
PBO group alone. The changes from baseline to sleep restriction<br />
were numerically mild <strong>with</strong> a decline of approximately<br />
5% to 25% depending upon the variable measured. Significant<br />
changes from baseline to sleep restriction were seen for mean<br />
reaction time (P = 0.006), mean of the slowest 10% of reaction<br />
times (P = 0.007), mean of the fastest 10% of reaction times<br />
(P = 0.015), and mean 1/RT (P = 0.002). There was no significant<br />
increase in number of lapses (P = 0.18); transformed lapses<br />
showed a trend toward a significant difference (P = 0.056).<br />
Introspective <strong>Sleep</strong>iness and Mood<br />
Mean KSS ratings showed a trend towards lower levels of<br />
sleepiness for GBX than PBO during sleep restriction. The<br />
mean KSS score for the PBO group averaged over Days 5 and<br />
6 was 6.7 ± 0.30 as compared to 6.0 ± 0.30 for the GBX group<br />
(P = 0.058). An ad hoc ANCOVA analysis using the general<br />
linear model on the precomputed daily means to compare the<br />
groups provided supportive evidence for this observation (P =<br />
0.036). <strong>Sleep</strong>iness ratings on a visual analog scale made prior to<br />
and following the PVT were also lower for GBX than for PBO<br />
(PBO = 6.5 ± 0.34, GBX = 5.7 ± 0.34, P = 0.044 for pre-PVT<br />
rating; PBO = 7.2 ± 0.33, GBX 6.1 ± 0.34. P = 0.02 for post-<br />
PVT rating).<br />
The Fatigue (PBO 12.8 ± 1.4; GBX 9.6 ± 1.5) and Vigor<br />
(PBO 8.7 ± 1.2; GBX 11.2 ± 1.3) scales on the POMS tended<br />
SLEEP, Vol. 31, No. 5, 2008 665<br />
<strong>Slow</strong> <strong>Wave</strong> <strong>Sleep</strong>, <strong>Sleep</strong>iness, Performance, <strong>Gaboxadol</strong>—Walsh et al
2<br />
A<br />
2<br />
B<br />
1.8<br />
1.8<br />
1.6<br />
1.6<br />
Relative Power Density<br />
1.4<br />
1.2<br />
1<br />
0.8<br />
0.6<br />
Relative Power Density<br />
1.4<br />
1.2<br />
1<br />
0.8<br />
0.6<br />
0.4<br />
0.4<br />
0.2<br />
0.2<br />
0<br />
1 3 5 7 9 11 13 15 17 19 21 23 25 27 29 31<br />
Frequency (Hz)<br />
0<br />
1 3 5 7 9 11 13 15 17 19 21 23 25 27 29 31<br />
Frequency (Hz)<br />
2<br />
C<br />
2<br />
D<br />
1.8<br />
1.8<br />
1.6<br />
1.6<br />
Relative Power Density<br />
1.4<br />
1.2<br />
1<br />
0.8<br />
0.6<br />
0.4<br />
Relative Power Density<br />
1.4<br />
1.2<br />
1<br />
0.8<br />
0.6<br />
0.4<br />
0.2<br />
0.2<br />
0<br />
1 3 5 7 9 11 13 15 17 19 21 23 25 27 29 31<br />
Frequency (Hz)<br />
0<br />
1 3 5 7 9 11 13 15 17 19 21 23 25 27 29 31<br />
Frequency (Hz)<br />
2<br />
E<br />
1.8<br />
1.6<br />
Relative Power Density<br />
1.4<br />
1.2<br />
1<br />
0.8<br />
0.6<br />
0.4<br />
0.2<br />
0<br />
1 3 5 7 9 11 13 15 17 19 21 23 25 27 29 31<br />
Frequency (Hz)<br />
Figure 2—Spectral power density profiles for the GBX group (filled symbols) and the placebo group (open symbols) for nights 3, 4, 5, and<br />
6 (Panels A-D, respectively) and averaged across Nights 5 and 6 (Panel E), relative to baseline (mean of Nights 1 and 2). Geometric mean<br />
values (± SD) for each 1-Hz bin are plotted. Baseline night values are represented by the abscissa at 1.0. Statistical comparisons were made<br />
only between groups for means of Nights 5 and 6 versus baseline. Horizontal lines above the frequency bin demarcations indicate statistically<br />
significant differences between groups (Panel E).<br />
to favor the GBX group (P = 0.067 and 0.080, respectively).<br />
Differences on both scales were more evident (P = 0.030 and<br />
0.024) when the protocol violators were excluded in an ad hoc<br />
analysis.<br />
Cognitive Test Battery and Procedural Memory Test<br />
Two of 25 measures made <strong>with</strong> the 14 tests of the cognitive<br />
battery showed a significant difference between the GBX and<br />
PBO groups, both in favor of GBX. These findings are consistent<br />
<strong>with</strong> chance observations. The two significant findings<br />
were on motor transport time (P = 0.04) and the percent correct<br />
on the spatial 1-back memory task (P = 0.02). Examination of<br />
the data suggests that few of the measures showed a negative<br />
influence of sleep restriction on PBO, leaving little room for<br />
improvement <strong>with</strong> GBX. Additionally, substantial intersubject<br />
variability was characteristic of these measures. Because the<br />
current study was not powered to detect differences between<br />
groups on any neurocognitive measure, the effect size (Cohen’s<br />
d) for each measure (for the mean of Days 5 and 6) was calculated<br />
for 25 endpoints from the 14 tests in the cognitive battery<br />
to gain a global comparison of overall neurocognitive function.<br />
Seven of 25 measures exceeded a moderate Cohen’s d of 0.5<br />
and 6 of those 7 favored GBX. Nevertheless, no clear cognitive<br />
domain pattern was noted and no conclusions can be made from<br />
this exploratory analysis.<br />
No differences between groups were found on any measure<br />
of the Procedural Memory Test. Mild to moderate effect sizes<br />
(0.2 to 0.5) on 4 measures of this test were in favor of GBX.<br />
SLEEP, Vol. 31, No. 5, 2008 666<br />
<strong>Slow</strong> <strong>Wave</strong> <strong>Sleep</strong>, <strong>Sleep</strong>iness, Performance, <strong>Gaboxadol</strong>—Walsh et al
Table 3—Observed Mean (SD) Self-Reported <strong>Sleep</strong> Variables for <strong>Gaboxadol</strong> (GBX) and Placebo (PBO) Groups on Nights 1-8<br />
Screening / Baseline <strong>Sleep</strong> Restriction Recovery<br />
Night 1 Night 2 Night 3 Night 4 Night 5 Night 6 Night 7 Night 8<br />
PBO GBX PBO GBX PBO GBX PBO GBX PBO GBX PBO GBX PBO GBX PBO GBX<br />
Total <strong>Sleep</strong> Time (min)<br />
N=21 N=19 N=21 N=19 N=20 N=19 N=21 N=20 N=21 N=20 N=21 N=20 N=20 N=20 N=20 N=18<br />
517.0 539.8 500.7 500.8 317.6 333.9 311.0 318.7 325.5 314.7 304.8 306.1 635.7 652.5 556.0 582.1<br />
(91.2) (44.7) (49.9) (31.5) (26.8) (44.1) (25.7) (45.0) (31.1) (35.9) (15.9) (18.4) (80.5) (57.1) (109) (84.7)<br />
<strong>Sleep</strong> Latency (min)<br />
N=21 N=20 N=21 N=19 N=21 N=20 N=21 N=20 N=21 N=20 N=20 N=20 N=20 N=20 N=20 N=19<br />
29.0 27.8 18.2 14.5 12.2 7.8 8.9 6.8 8.4 5.7 8.2 5.7 29.7 14.8 50.0 44.0<br />
(27.0) (20.3) (12.6) (9.4) (7.9) (5.3) (8.1) (4.7) (12.8) (4.5) (16.1) (4.7) (42.0) (14.1) (52.0) (46.0)<br />
Wake After <strong>Sleep</strong> Onset (min)<br />
N=19 N=20 N=19 N=18 N=19 N=17 N=20 N=13 N=16 N=14 N=18 N=15 N=20 N=20 N=20 N=17<br />
27.2 16.8 13.5 21.2 2.9 1.9 3.0 2.3 6.0 2.5 3.6 5.1 30.2 35.3 42.1 45.9<br />
(38.6) (13.8) (15.7) (30.6) (2.8) (3.4) (5.1) (3.1) (15.0) (3.6) (3.9) (15.3) (53.9) (37.2) (54.0) (60.0)<br />
Number of Awakenings<br />
N=21 N=20 N=21 N=18 N=21 N=20 N=21 N=20 N=21 N=20 N=21 N=19 N=20 N=20 N=20 N=19<br />
2.9 3.0 2.9 2.3 1.4 0.3 1.0 0.3 0.9 0.4 1.1 0.3 3.1 2.4 2.8 2.7<br />
(1.7) (2.3) (2.8) (1.3) (1.6) (0.6) (1.3) (0.5) (1.4) (0.6) (1.2) (0.5) (2.4) (1.7) (2.4) (1.7)<br />
<strong>Sleep</strong> Quality Rating #<br />
N=21 N=20 N=21 N=19 N=21 N=20 N=21 N=20 N=21 N=20 N=21 N=20 N=20 N=20 N=20 N=19<br />
55.0 51.5 63.6 67.7 73.3 71.5 73.4 77.9 67.5 74.1 66.9 69.6 69.7 77.0 65.0 56.5<br />
(21.4) (19.9) (23.1) (17.3) (18.9) (18.1) (17.4) (14.6) (23.1) (19.6) (19.8) (22.5) (19.3) (14.8) (21.8) (24.4)<br />
Refreshed Upon Awakening Rating #<br />
N=21 N=20 N=21 N=19 N=21 N=20 N=21 N=20 N=21 N=20 N=21 N=20 N=20 N=20 N=20 N=19<br />
67.6 65.6 62.6 60.6 57.6 44.8 57.0 41.1 33.5 34.0 37.1 23.4 75.8 76.8 79.4 64.5<br />
(21.6) (17.8) (25.1) (21.2) (22.5) (22.3) (25.5) (25.2) (18.3) (20.6) (18.3) (21.9) (18.1) (16.3) (21.1) (27.0)<br />
#<br />
100 mm analog scale rating; higher values are more positive<br />
Salivary Cortisol and Urinary Catecholamines<br />
Neither salivary free cortisol nor urinary catecholamine differed<br />
between groups during sleep restriction or recovery. Unadjusted<br />
mean salivary cortisol values (µg/dL), averaged across<br />
the 8 daily samples for the PBO and GBX groups, respectively,<br />
were 0.182 (± 0.057) and 0.171 (± 0.09) at baseline and 0.174<br />
(0.05) and 0.165 (± 0.04) on Day 6. Urinary epinephrine/creatinine<br />
mean ratios, for the 22:00-10:00 and 10:00-22:00 aliquots,<br />
were 6.3 (± 3.6) and 8.9 (± 5.4) at baseline and 5.8 (± 3.3) and<br />
8.4 (± 5.3) on Day 6 for the PBO group and 4.2 (± 2.2) and 7.8<br />
(± 2.6) at baseline and 4.6 (± 2.0) and 6.7 (± 2.2) on Day 6 for<br />
the GBX group. Urinary norepinephrine/creatinine mean ratios,<br />
for the 22:00-10:00 and 10:00-22:00 aliquots, were 18.2 (± 6.0)<br />
and 23.4 (± 8.7) at baseline and 19.5 (± 6.2) and 22.1 (± 6.5)<br />
on Day 6 for the PBO group and 16.1 (± 5.7) and 27.2 (± 9.3)<br />
at baseline and 18.3 (± 6.3) and 20.6 (± 8.1) on Day 6 for the<br />
GBX group.<br />
Recovery Period<br />
There were no group differences on any PSG variable during<br />
recovery sleep on either Night 7 or 8. Spectral power density did<br />
not differ between groups on Night 7. SWS and spectral power<br />
density showed no differences between Night 7 and baseline.<br />
Groups also did not differ on the MSLT, KSS, or other daytime<br />
measures following recovery sleep. On Day 7, POMS Fatigue<br />
was worse for PBO (8.33 ± 1.41) than for GBX (3.10<br />
± 1.51; P = 0.008). There were no group differences in other<br />
self-report ratings. Following recovery sleep on Night 7, mean<br />
fastest 10% of reaction times was slightly slower for GBX than<br />
for PBO (P = 0.02), <strong>with</strong> less evidence of this effect when the<br />
protocol violators were excluded (P = 0.06). No other PVT<br />
measures differed between groups on Day 7.<br />
Association of MSLT, KSS, <strong>Sleep</strong> Stages, and Spectral Power<br />
Density<br />
Table 5 contains Pearson partial correlation coefficients (adjusted<br />
for age and sex) describing the association of MSLT and<br />
KSS <strong>with</strong> sleep stages and spectral power density. The change<br />
from baseline (Day 2) to Day 6 mean MSLT latency was positively<br />
and significantly correlated <strong>with</strong> the change in SWS from<br />
baseline (Night 2) to Night 6, for both the GBX group alone<br />
(r = 0.58 P < 0.05; see Figure 5), and for all subjects (r = 0.51,<br />
P = 0.001), but not for the PBO group (r = 0.18, ns). Change<br />
from baseline in MSLT was not significantly correlated <strong>with</strong><br />
change in TST, as expected given the control over TST in this<br />
study, nor <strong>with</strong> changes in minutes of REM or stage 1. Change in<br />
minutes of stage 2 was not associated <strong>with</strong> change in MSLT for<br />
all subjects, and showed a trend toward a negative correlation in<br />
the GBX group. When changes in MSLT from baseline to Day 6<br />
were compared <strong>with</strong> changes in SWS averaged across Nights 3-6<br />
the correlation was lower for all subjects (r = 0.36, P < 0.05) and<br />
was not significant for GBX subjects (r = 0.28, ns).<br />
Change from baseline to Day 6 MSLT scores for all subjects<br />
were also positively associated <strong>with</strong> the change in power<br />
density from baseline to Night 6 in the 1-5 Hz band (r = 0.33,<br />
SLEEP, Vol. 31, No. 5, 2008 667<br />
<strong>Slow</strong> <strong>Wave</strong> <strong>Sleep</strong>, <strong>Sleep</strong>iness, Performance, <strong>Gaboxadol</strong>—Walsh et al
20<br />
A<br />
4<br />
15<br />
3.5<br />
3<br />
Minutes<br />
10<br />
Number<br />
2.5<br />
2<br />
5<br />
1.5<br />
0<br />
P = 0.052), but not for the 6-11 Hz band (r = 0.28, P = 0.099),<br />
or other frequency bands. Although the correlation between<br />
change from baseline to Day 6 MSLT and change in 1-5 Hz<br />
power density from baseline to Night 6 for GBX alone was<br />
higher (r = 0.44), it was not significant (P = 0.075), probably<br />
due to the smaller sample size in single group analyses. No association<br />
was indicated for the PBO group (r = −0.10, ns).<br />
KSS change scores correlated negatively <strong>with</strong> change in min<br />
of SWS (i.e, more SWS was associated <strong>with</strong> less introspective<br />
sleepiness) for all subjects (r = −0.33, P = 0.05); there was<br />
a trend for the GBX group (r = −0.44, P = 0.13), but not for<br />
the PBO subjects (r = −0.18, ns). No association between the<br />
change in minutes of TST, stage 2 or REM and KSS change<br />
scores was observed for all subjects or either group separately.<br />
KSS change from baseline to Day 6 scores were significantly<br />
correlated <strong>with</strong> change in power in the 1-5 Hz band for all<br />
subjects (r = −0.44, P < 0.01) and there was a trend for the<br />
GBX group (r = −0.44, P = 0.081). In addition, KSS change<br />
from baseline to Day 6 scores were significantly correlated <strong>with</strong><br />
change in power in the 6-11 Hz band for all subjects (r = −0.43,<br />
P = 0.011); there was a trend for the GBX group, (r = −0.45,<br />
P = 0.068), and not in the PBO group (r = −0.31, ns).<br />
Safety Measures<br />
No clinically relevant changes in vital signs, gait and balance,<br />
ECG, hematology, blood chemistry, or routine urinalysis<br />
were detected. No serious adverse effects were reported and<br />
no subject discontinued prematurely due to an adverse effect.<br />
Three subjects in each group reported one or more adverse effects.<br />
Two subjects reported dizziness <strong>with</strong> GBX. No other adverse<br />
effect was reported by more than one subject.<br />
DISCUSSION<br />
1 2 3 & 4 5 6<br />
Study Day<br />
Figure 3—Observed means for sleep latency on the MSLT on<br />
Days 1, 2, 5, 6, and 7 for both groups. Error bars indicate standard<br />
deviations. Least square mean sleep latency of Days 5 and 6 was<br />
significantly longer (P = 0.047) for the GBX group (filled symbols)<br />
than for the placebo group (open symbols).<br />
SWS was consistently increased by GBX 15 mg during the<br />
4-night sleep restriction period, relative to both baseline and to<br />
PBO values. Increased SWS <strong>with</strong> GBX has been shown in a<br />
7<br />
B<br />
Milliseconds<br />
C<br />
Milliseconds<br />
1<br />
300<br />
250<br />
200<br />
150<br />
300<br />
250<br />
200<br />
150<br />
1 2 3 & 4 5 6<br />
Study Day<br />
1 2 3 & 4 5 6<br />
Study Day<br />
1 2 3 & 4 5 6<br />
Study Day<br />
Figure 4—Psychomotor Vigilance Task (PVT) data for baseline<br />
(Days 1 and 2), sleep restriction (Days 5 and 6), and recovery<br />
(Day 7) conditions for the GBX group (filled symbols) and the<br />
placebo group (open symbols). Square root transformed lapses<br />
(Panel A), mean reaction time (Panel B), and mean of the slowest<br />
10% of reaction times (Panel C) are shown. Error bars indicate<br />
standard deviations. There were no group differences at any time<br />
during the study. See text and Table 4 for additional PVT data and<br />
analyses.<br />
number of studies, 22,28-30 and we believe that this represents an<br />
enhancement of at least some of the normal physiological processes<br />
associated <strong>with</strong> NREM sleep and is not simply an electroencephalographic<br />
change. The most compelling finding in<br />
7<br />
7<br />
7<br />
SLEEP, Vol. 31, No. 5, 2008 668<br />
<strong>Slow</strong> <strong>Wave</strong> <strong>Sleep</strong>, <strong>Sleep</strong>iness, Performance, <strong>Gaboxadol</strong>—Walsh et al
Table 4—Observed Mean (SD) PVT Variables for <strong>Gaboxadol</strong> (GBX) and Placebo (PBO) Groups on Days 1,2,5,6, and 7<br />
Baseline <strong>Sleep</strong> Restriction Recovery<br />
Day 1 Day 2 Day 5 Day 6 Day 7<br />
PBO GBX PBO GBX PBO GBX PBO GBX PBO GBX<br />
N 21 20 21 20 21 20 20 20 20 20<br />
Lapses, no. 0.8 (1.7) 0.7 (1.1) 1.2 (2.6) 0.7 (1.2) 1.5 (2.2) 1.7 (2.8) 1.8 (2.4) 1.6 (2.3) 0.6 (1.3) 0.8 (1.5)<br />
Transformed lapses 1.7 (1.0) 1.7 (0.8) 1.9 (1.4) 1.7 (0.9) 2.1 (1.3) 2.2 (1.5) 2.3 (1.4) 2.2 (1.2) 1.5 (1.0) 1.7 (1.1)<br />
Reaction time, msec 257.1 243.3 253.3 253.5 270.0 273.7 276.4 274.8 248.9 249.8<br />
(41.0) (30.4) (43.2) (36.0) (43.4) (50.6) (44.7) (38.2) (37.7) (37.9)<br />
1/reaction time 4.1 (0.5) 4.3 (0.4) 4.2 (0.6) 4.2 (0.5) 4.0 (0.5) 4.0 (0.5) 3.9 (0.5) 3.9 (0.5) 4.2 (0.5) 4.2 (0.5)<br />
Fastest 10% reaction time, msec 199.3 187.8 196.2 195.8 203.5 202.7 206.1 203.9 192.6 193.2<br />
(25.3) (18.6) (25.3) (22.3) (24.0) (22.6) (23.7) (25.7) (19.9) (20.1)<br />
<strong>Slow</strong>est 10% reaction time, msec 368.8 364.8 372.3 379.2 421.2 455.2 431.3 434.6 352.8 377.6<br />
(85.0) (80.6) (94.7) (82.8) (125.0) (232.0) (124.0) (107.0) (91.6) (139.0)<br />
support of this interpretation is the significant reduction in the<br />
degree of physiologically assessed sleepiness following sleep<br />
restriction in the GBX group as compared to the PBO group.<br />
The strong correlation between the increase from baseline in<br />
SWS and the change in MSLT from baseline further suggests<br />
that the SWS effect may contribute to the reduced impact of<br />
sleep restriction in a direct fashion.<br />
There were PSG differences between GBX and PBO groups<br />
other than the increase in SWS during sleep restriction. Specifically,<br />
GBX reduced stage 1, WASO, REM, and number of<br />
stage shifts relative to PBO; although TST and stage 2 did not<br />
differ between groups. Although statistically significant, the<br />
absolute magnitude of the group differences is quite modest<br />
and is not likely to affect next day function when TST is held<br />
constant. The mean group differences in WASO, stage 1, and<br />
REM were 3, 9, and 7 min per night, respectively. The differences<br />
in number of stage shifts to wake or stage 1, a measure of<br />
sleep fragmentation, 38 differed by an average of 7.2 per night,<br />
or about 1.4/h of sleep. That degree of difference in sleep fragmentation<br />
between groups would not be suspected to affect<br />
subsequent waking function when TST is held constant at 5 h.<br />
10<br />
In a population-based study including 483 individuals <strong>with</strong>out<br />
sleep disordered breathing the mean number of stage shifts to<br />
wake or stage 1 was 4.8 + 2.2/h. 38 5<br />
Thus, our group difference of<br />
1.4/h is approximately 0.6 of a standard deviation of the normal<br />
distribution for that measure.<br />
0<br />
The physiologic significance of the 2-min mean MSLT difference<br />
between groups appears to be substantial when compared<br />
<strong>with</strong> the absolute difference on the MSLT <strong>with</strong> other<br />
-5<br />
interventions to reduce sleepiness. For example, modafinil<br />
200 mg administered to narcolepsy or shift work sleep disorder<br />
(SWSD) patients, produces significant increases in MSLT<br />
-10<br />
latencies <strong>with</strong> a magnitude between 1-2 min. 39,40 The mean increase<br />
in MSLT following treatment of sleep apnea <strong>with</strong> con-<br />
-15<br />
tinuous positive airway pressure is approximately 1 minute. 41<br />
These increases in MSLT latencies are judged to be clinically<br />
relevant because they are accompanied by improvements in<br />
quality of life, patient sleepiness ratings, clinician ratings of<br />
treatment effectiveness, and ability to maintain wakefulness<br />
or sustain attention. The KSS has been utilized infrequently in<br />
studies assessing interventions, but in 2 intervention studies,<br />
differences of a magnitude comparable to our findings were<br />
reported. 39,42<br />
Failure to show a beneficial effect of GBX on PVT performance<br />
complicates interpretation of overall study results, especially<br />
since PVT performance was preserved during sleep<br />
restriction in a similar study of SWS enhancement <strong>with</strong> tiagabine.<br />
25 Close inspection of the effect of sleep restriction on PVT<br />
measures in the PBO group in the present study reveals a minimal<br />
change <strong>with</strong> sleep restriction. In fact, the impact of sleep<br />
restriction was only about one-third as large as that in our prior<br />
study. For example, in the prior study 4 nights of sleep restriction<br />
produced increases of 17% in mean reaction time (vs 5%<br />
in the present study), 44% in mean of the slowest 10% of reaction<br />
times (vs 14.4%), and 91% in mean number of transformed<br />
lapses (vs 21%). With such a mild deficit produced by sleep restriction,<br />
separation of the two groups becomes extraordinarily<br />
difficult to demonstrate. Rather than focus on the differences<br />
in findings between the present research and our prior study,<br />
we believe the more relevant observation is the important similarities<br />
in the results. Specifically, in two separate studies, using<br />
different pharmacologic manipulations, SWS enhancement<br />
Change in MSLT Latency (minutes)<br />
-40 -30 -20 -10 0 10 20 30 40 50 60 70<br />
Change in SWS (minutes)<br />
Figure 5—Relationship between change from baseline in mean<br />
minutes of slow wave sleep on Night 6 and change from baseline<br />
in mean MSLT latency on Day 6 for all subjects. GBX subjects<br />
= filled symbols; placebo subjects = open symbols. Solid line is<br />
regression line for all subjects. Pearson correlation coefficients<br />
adjusted for age and sex are r = 0.514 (P < 0.001) for all subjects,<br />
and r = 0.578 (P < 0.05) for GBX subjects.<br />
SLEEP, Vol. 31, No. 5, 2008 669<br />
<strong>Slow</strong> <strong>Wave</strong> <strong>Sleep</strong>, <strong>Sleep</strong>iness, Performance, <strong>Gaboxadol</strong>—Walsh et al
Table 5—Pearson Partial Correlation Coefficients (Adjusted for Age and Sex), for all Subjects Combined and for Both the <strong>Gaboxadol</strong> (GBX)<br />
and Placebo (PBO) Groups Alone, Describing the Association Between Mean Change from Baseline in MSLT and KSS on Day 6 and Change<br />
from Baseline in <strong>Sleep</strong> Stage Amounts and Spectral Power Density in Specific Frequency Bands on Night 6<br />
All Subjects a GBX Group a PBO Group a<br />
MSLT KSS MSLT KSS MSLT KSS<br />
Power 1 - 5 Hz 0.331* −0.437** 0.443 + −0.435 + −0.100 −0.315<br />
Power 6 - 11 Hz 0.284 + −0.426* 0.265 −0.452 + 0.018 −0.314<br />
Power 12 - 14 Hz −0.175 −0.107 −0.229 −0.042 −0.027 −0.397<br />
Power 15 - 17 Hz −0.001 −0.086 −0.074 0.080 −0.069 −0.182<br />
Power 18 - 32 Hz 0.217 0.041 0.374 + 0.169 −0.263 −0.010<br />
Stage 1 (min) 0.197 0.264 0.278 0.241 0.024 0.281<br />
Stage 2 (min) −0.200 0.144 −0.447 + 0.183 0.158 0.110<br />
<strong>Slow</strong> <strong>Wave</strong> <strong>Sleep</strong> (min) 0.514*** −0.326 * 0.578* −0.444 + 0.181 −0.181<br />
REM (min) −0.231 −0.015 −0.124 −0.316 −0.089 0.014<br />
a<br />
sample sizes for all spectral measures were 37 for all subjects, 19 for GBX and 18 for PBO; for sleep stage measures the sample sizes were<br />
40 for all subjects, 20 for GBX and 20 for PBO.<br />
*** P ≤0.001; ** P ≤0.01; * P ≤0.05; + P ≤0.10<br />
This research was funded by Merck & Co., Inc., Whitehouse<br />
Station, NJ. and Lundbeck, A/S, Copenhagen, Denmark Dr. William<br />
Ball (formerly of Merck) and Dr. Steve Deacon (Lundbeck)<br />
provided valuable input and support for the conduct of the study.<br />
Dr. Yan-Ping Zheng and Donna DiGravio (both from Merck Reduring<br />
sleep restriction reduced the impact of sleep restriction<br />
on one or more metrics known to be sensitive to sleep loss. This<br />
supports the hypothesis that increased SWS/SWA has functional<br />
benefit.<br />
None of the individual tests in the cognitive battery were<br />
sensitive to the degree of sleep restriction imposed in this study.<br />
The absence of a deficit on these measures <strong>with</strong> sleep restriction<br />
prevents detection of possible differences between groups.<br />
The reduction of time spent in SWS which occurs <strong>with</strong> aging<br />
needs to be considered when discussing the function of SWS,<br />
since a parallel decline in the restorative value of sleep has not<br />
been definitively documented. Investigators have described that<br />
the SWS decline <strong>with</strong> healthy aging is predominantly, if not<br />
exclusively, the result of changes in EEG amplitude whereas<br />
EEG frequency patterns remain constant. As discussed recently<br />
by Bliwise 43 the loss in EEG amplitude may reflect age-related<br />
changes in neuroendocrine or other humorally-mediated factors<br />
rather than a change in the restorative capacity of sleep. On the<br />
other hand, the EEG frequency pattern (which does not change<br />
<strong>with</strong> age), which is closely associated <strong>with</strong> neuronal synchrony<br />
may relate to certain aspects of restoration. Similarly, drug-related<br />
reductions in SWS such as that seen <strong>with</strong> benzodiazepines<br />
are predominantly the result of EEG wave amplitude reduction<br />
rather than EEG frequency alterations. 44<br />
With respect to the postulated restorative role of NREM sleep,<br />
it is quite interesting that in the current study both GBX and<br />
sleep restriction (i.e., PBO) produce power density increases<br />
at frequencies from 1 to 8 Hz. In fact, the shape of the spectral<br />
curve (see Figure 2) is very comparable between the two groups<br />
although the absolute amplitude is not similar. The difference in<br />
amplitude may be a dose effect, <strong>with</strong> dose being either amount<br />
of GBX or the amount of prior wakefulness. In any case, the<br />
shape of the spectral power density curve is consistent <strong>with</strong> the<br />
hypothesis that GBX produces EEG synchrony changes similar<br />
to those seen <strong>with</strong> naturally increased homeostatic sleep drive.<br />
It is interesting to speculate that a sleep-promoting agent that<br />
elicits spectral changes similar to those observed during sleep<br />
following the development of a sleep debt, may be promoting<br />
sleep through mechanisms involved in homeostatic sleep reg-<br />
ulation. Consistent <strong>with</strong> that hypothesis is the dose response<br />
characteristic of the increase in SWA <strong>with</strong> GBX described<br />
elsewhere, 29 similar to the increasing enhancement of SWA<br />
<strong>with</strong> increasing severity of sleep deprivation. Another observation<br />
which relates the neural activity of GBX to those of natural<br />
sleep is the activation of c-Fos expression by ventrolateral<br />
preoptic area (VLPO) neurons by GBX, at a level similar to<br />
the activation seen <strong>with</strong> spontaneous sleep. 45 Other GABAergic<br />
drugs produce much lower levels of c-Fos expression in VLPO<br />
neurons when administered at sleep-promoting doses. 46<br />
Several lines of evidence support the concept that NREM<br />
sleep is generated locally, in neuronal networks or columns that<br />
are loosely coupled, rather than being reflective of a unitary<br />
brain state. 47 In certain animals unihemispheric sleep reflects local<br />
sleep regulation. 48,49 In humans, parasomnia disorders have<br />
informed us that sleep is not necessarily manifest in the entire<br />
brain. 50 Experimental studies have linked waking experience to<br />
local sleep measures. 51 Moreover, the amount of SWS/SWA in<br />
brain areas has been demonstrated to reflect prior stimulation of<br />
that area during prior waking episodes. 52-56 With the concept of<br />
local sleep regulation, (and specifically SWS regulation) in mind,<br />
it is remarkable that a SWS-behavior association was identified<br />
in the present study given the relatively gross measure of SWS/<br />
SWA employed (as it is in most human sleep research).<br />
In conclusion, the MSLT data and introspective sleepiness<br />
and fatigue findings from this study are consistent <strong>with</strong> the hypothesis<br />
that enhanced SWS, in this study produced by GBX,<br />
reduces the physiological and introspective impact of sleep restriction.<br />
Moreover, the spectral power density changes seen<br />
<strong>with</strong> GBX are similar to those seen <strong>with</strong> homeostatic increases<br />
in sleep drive.<br />
ACKNOWLEDGMENTS<br />
SLEEP, Vol. 31, No. 5, 2008 670<br />
<strong>Slow</strong> <strong>Wave</strong> <strong>Sleep</strong>, <strong>Sleep</strong>iness, Performance, <strong>Gaboxadol</strong>—Walsh et al
search Laboratories) made important contributions to study implementation,<br />
and Junshui Ma and Vladimir Svetnik (both from<br />
Merck Research Laboratories) developed the spectral analysis<br />
software used and performed the spectral analysis. The authors<br />
especially appreciate the dedication of the technical and research<br />
personnel of the <strong>Sleep</strong> Medicine and Research Center, as well as<br />
the time and contributions of the research participants.<br />
REFERENCES<br />
1. Horne J. Human slow wave sleep: a review and appraisal of recent<br />
findings, <strong>with</strong> implications for sleep functions, and psychiatric<br />
illness. Experientia 1992;48:941-54.<br />
2. Bennington JH, Heller HC. Restoration of brain energy metabolism<br />
as the function of sleep. Prog Neurobiol 1995;45:347-60.<br />
3. Dijk DJ, Brunner DP, Beersma DGM, et al. Electroencephalogram<br />
power density and slow wave sleep as a function of prior<br />
waking and circadian phase. <strong>Sleep</strong> 1990;13:430-40.<br />
4. Werth E, Dijk DJ, Achermann P, Borbely AA. Dynamics of the<br />
sleep EEG after an early evening nap: experimental data and simulations.<br />
Am J Physiol 1996;271:R501-10.<br />
5. Borbely AA, Baumann F, Brandeis D, Strauch I, Lehmann D.<br />
<strong>Sleep</strong> deprivation: Effect on sleep stages and EEG power density<br />
in man. Electroencephalogr Clin Neurophysiol 1981;51:483-93.<br />
6. Bonnet MH. <strong>Sleep</strong> restoration as a function of periodic awakening,<br />
movement, or electroencephalographic change. <strong>Sleep</strong><br />
1987;10:364-73.<br />
7. Borbely AA. A two process model of sleep regulation. Hum Neurobiol<br />
1982;1:195-204.<br />
8. Horne J. Human slow wave sleep: a review and appraisal of recent<br />
findings, <strong>with</strong> implications for sleep functions, and psychiatric<br />
illness. Experientia 1992;48:941-54.<br />
9. Bennington JH, Heller HC. Restoration of brain energy metabolism<br />
as the function of sleep. Prog Neurobiol 1995;45:347-60.<br />
10. Tononi G, Cirelli C. <strong>Sleep</strong> and synaptic homeostasis: a hypothesis.<br />
Brain Res Bull 2003;62:143-50.<br />
11. Agnew HW, Webb WB, Williams RL. Comparison of stage<br />
four and 1-REM sleep deprivation. Percept Motor Skills<br />
1967;24:851-8.<br />
12. Bonnet MH. Performance and sleepiness following moderate<br />
sleep disruption and slow wave sleep deprivation. Physiol Behav<br />
1986;37:915-8.<br />
13. Lubin A, Moses JM, Johnson LC, Naitoh P. The recuperative<br />
effects of REM sleep and stage 4 sleep on human performance<br />
after complete sleep loss: Experiment I. Psychophysiol<br />
1974;11:133-46.<br />
14. Johnson LC, Naitoh P, Moses JM, Lubin A. Interaction of REM<br />
deprivation and stage 4 deprivation <strong>with</strong> total sleep loss: Experiment<br />
2. Psychophysiology 1974;11:147-59.<br />
15. Adam K, Oswald I. Effects of repeated ritanserin on middle-aged<br />
poor sleepers. Psychopharmacology (Berl) 1989;99:219-21.<br />
16. Dijk DJ, Beersma DG, Daan S, van den Hoofdakker RH. Effects<br />
of seganserin, a 5-HT2 antagonist, and temazepam on<br />
human sleep stages and EEG power spectra. Eur J Pharmacol<br />
1989;171:207-18.<br />
17. Foldvary-Schaefer N, De Leon Sanchez I, Karafa M, Mascha E,<br />
Dinner D, Morris HH. Gabapentin increases slow-wave sleep in<br />
normal adults. Epilepsia 2002;43:1493-7.<br />
18. Kubota T, Fang J, Meltzer LT, Krueger JM. Pregabalin enhances<br />
nonrapid eye movement sleep. J Pharmacol Exp Ther<br />
2001;299:1095-1105<br />
19. Mathias S, Wetter TC, Steiger A, Lancel M. The GABA uptake<br />
inhibitor tiagabine promotes slow wave sleep in normal elderly<br />
subjects. Neurobiol Aging 2001;22:247-53.<br />
20. Walsh JK, Zammit GK, Schweitzer PK, Ondrasik J, Roth T. Ti-<br />
SLEEP, Vol. 31, No. 5, 2008 671<br />
21.<br />
22.<br />
23.<br />
24.<br />
25.<br />
26.<br />
27.<br />
28.<br />
29.<br />
30.<br />
31.<br />
32.<br />
33.<br />
34.<br />
35.<br />
36.<br />
37.<br />
38.<br />
39.<br />
agabine enhances slow wave sleep and sleep maintenance in primary<br />
insomnia. <strong>Sleep</strong> Med 2006;29:433-43.<br />
Walsh JK, Randazzo AC, Frankowski S, Shannon K, Schweitzer<br />
PK, Roth T. Dose response effects of tiagabine on the sleep of<br />
older adults. <strong>Sleep</strong> 2005;28:673-6.<br />
Lancel M, Wetter TC, Steiger A, Mathias S. Effect of the<br />
GABAA agonist GBX on nocturnal sleep and hormone secretion<br />
in healthy elderly subjects. Am J Physiol Endocrinol Metab<br />
2001;281:E130-7.<br />
Dinges DF, Pack F, Williams K, et al. Cumulative sleepiness,<br />
mood disturbance, and psychomotor vigilance performance decrements<br />
during a week of sleep restricted to 4-5 hours per night.<br />
<strong>Sleep</strong> 1997;20:267-77<br />
Van Dongen HP, Maislin G, Mullington JM, Dinges DF. The cumulative<br />
cost of additional wakefulness: dose-response effects on<br />
neurobehavioral functions and sleep physiology from chronic sleep<br />
restriction and total sleep deprivation. <strong>Sleep</strong> 2003;26:117-26.<br />
Walsh JK, Randazzo AC, Stone K, et al Tiagabine is associated<br />
<strong>with</strong> sustained attention during sleep restriction: evidence for the<br />
value of slow-wave sleep enhancement? <strong>Sleep</strong> 2006;29:433-43.<br />
Ebert B, i Storustovu S, Mortensen M, Frolund B Characterization<br />
of GABA(A) receptor ligands in the rat cortical wedge<br />
preparation: evidence for action at extrasynaptic receptors? Br J<br />
Pharmacol 2002;137:1-8.<br />
Chandra D, Jia F, Liang J, et al. GABAA receptor α4 subunits mediate<br />
extrasynaptic inhibition in thalamus and dentate gyrus and<br />
the action of GBX. Proc Nat Acad Sci U S A 2006;103:15230-5.<br />
Mathias S, Zihl J, Steiger A, Lancel M. Effect of repeated GBX<br />
administration on night sleep and next-day performance in healthy<br />
elderly subjects. Neuropsychopharmacology 2005;30:833-41.<br />
Walsh JK, Deacon S. Dijk DJ, Lundahl J. The selective extrasynaptic<br />
GABAA agonist, GBX, improves traditional hypnotic<br />
efficacy measures and enhances slow wave activity in a model of<br />
transient insomnia. <strong>Sleep</strong> 2007;30:593-602.<br />
Deacon S, Staner L, Staner C, Legters A, Loft H, Lundahl J. Effect<br />
of short-term treatment <strong>with</strong> GBX on sleep maintenance and initiation<br />
in patients <strong>with</strong> primary insomnia. <strong>Sleep</strong> 2007;30:281-7.<br />
Horne JA, Ostberg O. A self-assessment questionnaire to determine<br />
morningness-eveningness in human circadian rhythms. Int<br />
J Chronobiol 1976;4:97-110.<br />
Monk TH, Buysse DJ, Kennedy KS, Pods JM, DeGrazia JM,<br />
Miewald JM. Measuring sleep habits <strong>with</strong>out using a diary: the<br />
sleep timing questionnaire. <strong>Sleep</strong> 2003;26:208-12.<br />
Rechtschaffen A, Kales A, eds. A manual of standardized terminology,<br />
techniques, and scoring system for sleep stages of human<br />
subjects. UCLA Brain Information Service/Brain Research Institute,<br />
Los Angeles, 1968.<br />
Mitler MM, Carskadon MA, Hirshkowitz M. Evaluating sleepiness.<br />
In. Kryger MH, Roth T, Dement WC. Principles and practice<br />
of sleep medicine, fourth edition. Philadelphia: Elsevier<br />
Saunders; 2005:1417-23.<br />
Dinges DF, Powell JW. Microcomputer analyses of performance<br />
on a portable, simple visual RT task during sustained operations.<br />
Behav Res Methods Instrum Comput 1985;17:652-5.<br />
McNair DM, Lorr M, Droppleman L. Profile of mood states. Boston<br />
University School of Medicine, 1981.<br />
Akerstedt T, Gillberg M. Subjective and objective sleepiness in<br />
the active individual. Int J Neurosci 1990;52:29-37.<br />
Morrell MJ, Finn L, Kim H, Peppard PE, Badr S, Young T.<br />
<strong>Sleep</strong> fragmentation, awake blood pressure, and sleep-disordered<br />
breathing in a population-based study. Am J Respir Crit Care Med<br />
2000;162: 2091-6.<br />
Czeisler CA, Walsh JK, Roth T, et al. Modafinil for excessive<br />
sleepiness associated <strong>with</strong> shift-work sleep disorder. New Engl J<br />
Med 2005;353:476-86.<br />
<strong>Slow</strong> <strong>Wave</strong> <strong>Sleep</strong>, <strong>Sleep</strong>iness, Performance, <strong>Gaboxadol</strong>—Walsh et al
40.<br />
41.<br />
42.<br />
43.<br />
44.<br />
45.<br />
46.<br />
47.<br />
48.<br />
49.<br />
50.<br />
51.<br />
52.<br />
53.<br />
54.<br />
55.<br />
56.<br />
US Modafinil in Narcolepsy Multicenter Study Group. Randomized<br />
trial of modafinil as a treatment for the excessive daytime<br />
somnolence of narcolepsy. Neurology 2000;54:1166-75.<br />
Patel SR, White DP, Malhotra A, Stanchina ML, Ayas NT. Continuous<br />
positive airway pressure therapy for treating sleepiness<br />
in a diverse population <strong>with</strong> obstructive sleep apnea: results of a<br />
meta-analysis. Arch Intern Med 2003;163:565-71.<br />
Schweitzer PK, Randazzo AC, Stone K, Erman M, Walsh JK.<br />
Laboratory and field studies of naps and caffeine as practical<br />
countermeasures for sleep/wake problems associated <strong>with</strong> night<br />
work. <strong>Sleep</strong> 2006;29;39-50.<br />
Bliwise D. Normal Aging. In: Kryger MH, Roth T, Dement WC,<br />
eds. Principles and practice of sleep medicine. Philadelphia: Elsevier<br />
Saunders; 2005:24-38.<br />
Feinberg I, Maloney T, Campbell IG. Effects of hypnotics on the<br />
sleep EEG of healthy young adults: new data and pharmacological<br />
implications. J Psychiatr Res 2000;34:423-38.<br />
Saper CB, Scammell TE, Lu J. Hypothalamic regulation of sleep<br />
and circadian rhythms. Nature 2005;437:1257-63.<br />
Nelson LE, Guo TZ, Lu J, Saper CB, Franks NP, Maze M. The sedative<br />
component of anesthesia is mediated by GABA(A) receptors<br />
in an endogenous sleep pathway. Nat Neurosci 2002;5:979-84.<br />
Krueger JM, Rector DM, Churchill L. <strong>Sleep</strong> and cytokines. <strong>Sleep</strong><br />
Med Clin 2007;2:161-70.<br />
Mukhametov LM. <strong>Sleep</strong> in marine mammals. Exp Brain Res<br />
1984;8:227-38.<br />
Rattenborg NC, Amlaner CJ, Lima SL. Unilateral eye closure<br />
and interhemispheric EEG asymmetry during sleep in the pigeon<br />
(Columba livia). Brain Behav Evol 2001;58:323-32.<br />
Mahowald MW, Schenck CH. Insights from studying human<br />
sleep disorders. Nature 2005;437:1279-85.<br />
Huber R, Ghilardi MF, Massimini M. Tononi G. Local sleep and<br />
learning. Nature 2004;430:78-81.<br />
Miyamoto H, Katagiri H, Hensch T. Experience-dependent slowwave<br />
sleep development. Nat Neurosci 2003;6:553-4.<br />
Vyazovskiy V, Borbely AA, Tobler I. Unilateral vibrissae stimulation<br />
during waking induces interhemispheric EEG asymmetry<br />
during subsequent sleep in the rat. J <strong>Sleep</strong> Res 2000;9:367-71.<br />
Cottone LA., Adamo D, Squires NK. The effect of unilateral<br />
somatosensory stimulation on hemispheric asymmetries during<br />
slow wave sleep. <strong>Sleep</strong> 2004;27:63-8.<br />
Ferrara M, De Gennaro L, Curcio G, Cristiani R, Bertini M.<br />
Interhemispheric asymmetry of human sleep EEG in response<br />
to selective slow-wave sleep deprivation. Behav Neurosci<br />
2002;116:976-81.<br />
Yasuda T, Yasuda K, Brown RA, Krueger JM. State-dependent<br />
effects of light-dark cycle on somatosensory and visual cortex<br />
EEG in rats. Am J Physiol Regul Integr Comp Physiol<br />
2005;289:R1083-9.<br />
APPENDIX<br />
The cognitive testing battery consisted of the following tests<br />
(end points in parentheses): complex reaction time (decision<br />
and transport time), digit symbol substitution (number attempted,<br />
percent correct), goal neglect (compliance <strong>with</strong> instruction<br />
before, after change in goal set and overall), lexical decision<br />
(decision time for primed and unprimed words, and non-word<br />
stimuli), motor tracking (Euclidian error), paced visual serial<br />
addition (number correct), simple reaction time (decision and<br />
transport time), spatial 1-back memory (number correct), spatial<br />
2-back memory (number correct), sustained attention to response<br />
(number errors of omission and errors of commission,<br />
accuracy), serial reaction time (time to complete sequences and<br />
random trial blocks), verbal 1-back memory (number correct),<br />
verbal 2-back memory (number correct), verbal fluency (number<br />
correctly generated words, number incorrectly generated<br />
words).<br />
SLEEP, Vol. 31, No. 5, 2008 672<br />
<strong>Slow</strong> <strong>Wave</strong> <strong>Sleep</strong>, <strong>Sleep</strong>iness, Performance, <strong>Gaboxadol</strong>—Walsh et al