Model of the Dispersion of Fresh Water and Other Sewage Materials ...
Model of the Dispersion of Fresh Water and Other Sewage Materials ...
Model of the Dispersion of Fresh Water and Other Sewage Materials ...

Create successful ePaper yourself
Turn your PDF publications into a flip-book with our unique Google optimized e-Paper software.
'7<br />
J.K.A.U.<br />
Mar. Sri, Vol.l,pp. 27-38(1410A.H./I990A.D<br />
<strong>Model</strong> <strong>of</strong> <strong>the</strong> <strong>Dispersion</strong> <strong>of</strong> <strong>Fresh</strong> <strong>Water</strong> <strong>and</strong> O<strong>the</strong>r <strong>Sewage</strong><br />
<strong>Materials</strong> in <strong>the</strong> Coastal Red Sea <strong>Water</strong> in Front <strong>of</strong> Jeddah<br />
OSMAN A. EL-RAYIS*<br />
Faculty <strong>of</strong> Marine Sciences, King Abdulaziz University,<br />
Jeddah, Saudi Arabia.<br />
ABSTRACT. The distribution pattern <strong>of</strong> <strong>the</strong> fresh water percentage <strong>and</strong><br />
o<strong>the</strong>r sewage materials, viz. phosphate, suspended matter <strong>and</strong> manganese,<br />
in <strong>the</strong> surface water <strong>of</strong> <strong>the</strong> Red Sea coast in front <strong>of</strong> Jeddah was studied at<br />
different times <strong>of</strong> <strong>the</strong> year. It was found that <strong>the</strong> pollutants discharged into<br />
<strong>the</strong> Bankalah region were dispersed mainly to <strong>the</strong> sou<strong>the</strong>astern side <strong>of</strong> <strong>the</strong><br />
coastal area to an extent entirely controlled by <strong>the</strong> surface water movement<br />
induced by prevailing winds. An empirical dispersion model has been<br />
applied to one <strong>of</strong> <strong>the</strong> pollutants (phosphate) <strong>and</strong> this showed that <strong>the</strong>re<br />
were o<strong>the</strong>r two significant sources <strong>of</strong> phosphate to <strong>the</strong> area.<br />
Introduction<br />
The levels <strong>of</strong> some chemical pollutants in <strong>the</strong> coastal area <strong>of</strong>f Jeddah (Fig. 1) have<br />
been shown to originate from discharge <strong>of</strong> domestic sewage at its sou<strong>the</strong>astern side,<br />
in <strong>the</strong> Bankalah area (EI-Rayiset al. 1982, <strong>and</strong> Behairy <strong>and</strong> Saad 1984a,b). However,<br />
<strong>the</strong>se authors did not show whe<strong>the</strong>r <strong>the</strong>re was more than one source <strong>of</strong> sewage<br />
for <strong>the</strong> area, <strong>and</strong> what are <strong>the</strong> factors that control <strong>the</strong> pattern <strong>of</strong> <strong>the</strong> dispersion <strong>of</strong><br />
<strong>the</strong>se pollutants in <strong>the</strong> surface water. The present paper is an attempt to fill <strong>the</strong>se<br />
gaps in our knowledge <strong>and</strong> to give, in <strong>the</strong> same time, data for <strong>the</strong> level <strong>and</strong> distributions<br />
<strong>of</strong> suspended matter, water transparency <strong>and</strong> <strong>the</strong> percentage <strong>of</strong> fresh water, as<br />
well as <strong>the</strong> chemical pollutants, dissolved reactive phosphate <strong>and</strong> manganese in this<br />
water. The conservative, or non-conservative, behaviour <strong>of</strong> one <strong>of</strong> <strong>the</strong> chemical pollutants<br />
(phosphate) during <strong>the</strong> mixing process <strong>of</strong> <strong>the</strong> water effluent with <strong>the</strong> surface<br />
coastal Red Sea water was also investigated.<br />
'Permanent address: Department <strong>of</strong> Oceanography, Faculty <strong>of</strong> Science. Alex<strong>and</strong>ria University, Alex<strong>and</strong>ria, Egypt
28 O,nianA. EI-Rayi!<br />
0 2 km<br />
1<br />
N<br />
ATTAHLIA<br />
HAMRA<br />
HARBOUR<br />
~ BANKALAH<br />
FISH MARKET<br />
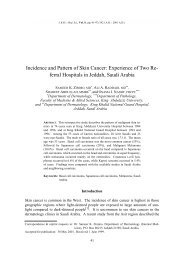
Jeddah coast (between Attahlia <strong>and</strong> <strong>the</strong> Islamic Harbour) bathymetry <strong>and</strong> locations <strong>of</strong> <strong>the</strong> sampl.<br />
ing stations.<br />
Material <strong>and</strong> Methods<br />
Surface water samples were collected at fourteen stations shown in Fig. 1, during<br />
six cruises in <strong>the</strong> period between October 1981 <strong>and</strong> May 1982. Subsurface water samples<br />
were collected once in January 1982 from stations 1, 3,12 <strong>and</strong> 14, that form a section<br />
extending at right angles seawards from <strong>the</strong> Bankalah coast.<br />
In situ measurements for Secchi Disc depths were taken. Determinations <strong>of</strong> salinity,<br />
dissolved oxygen or hydrogen sulphide, total suspended matter <strong>and</strong> dissolved<br />
phosphate <strong>and</strong> manganese were made, for <strong>the</strong> first four successive cruise. For <strong>the</strong> last<br />
two cruises only salinity <strong>and</strong> dissolved oxygen or hydrogen sulphide were measured.<br />
All <strong>the</strong> determinations were carried out according to <strong>the</strong> methods described previously<br />
by EI~Rayis et at. (1982 <strong>and</strong> 1985).
<strong>Model</strong> <strong>of</strong> <strong>the</strong> D;spers;on<strong>of</strong><strong>Fresh</strong> <strong>Water</strong>.<br />
29<br />
Results <strong>and</strong> Discussion<br />
The results <strong>of</strong> <strong>the</strong> studied elements in <strong>the</strong> surface water <strong>of</strong> Jeddah coast are pre.<br />
sented in <strong>the</strong> form <strong>of</strong> distributions shown in Fig. 2, 5-8.<br />
SALINITY (.,..)<br />
N-..<br />
39 ..., .> 39 .<br />
"<br />
SALINITYC",,)<br />
A--<br />
~\\" ~<br />
J) '. .<br />
..\ \;-1<br />
A--<br />
'""-<br />
." N<br />
" OV ..~) 1981<br />
APRIL 1982<br />
/\..-'"<br />
> 39<br />
h;, --:.<br />
"'~'~~-J<br />
.."/,<br />
.~DEC. 1981<br />
v<br />
/<br />
~~ MAY 1982<br />
vv<br />
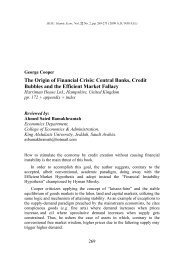
FIG. 2. Distribution <strong>of</strong> salinity in <strong>the</strong> surface water <strong>of</strong> <strong>the</strong> Red Sea coast in front <strong>of</strong> Jeddah.<br />
Figure 2 shows <strong>the</strong> surface distribution <strong>of</strong> salinity. Figure 3 shows <strong>the</strong> vertical distribution<br />
<strong>of</strong> salinity along <strong>the</strong> section extended fro~ Bankalah seaward. From <strong>the</strong>se<br />
figures, it is easy to define <strong>the</strong> place <strong>of</strong> <strong>the</strong> discharge <strong>of</strong> <strong>the</strong> fresh water (that accompanied<br />
<strong>the</strong> effluent <strong>of</strong> <strong>the</strong> domestic sewage), which is at Bankalaharea at <strong>the</strong> sou<strong>the</strong>astern<br />
side <strong>of</strong> <strong>the</strong> studied area, where salinity values less than 39.0, minimum 8.4,<br />
were found. The minimum salinity was always found at station 1 near to Bankalah.<br />
Whereas <strong>the</strong> rest <strong>of</strong> Jeddah coast were characterized by salinity values greater than<br />
39.0, maximum 39.6. From Fig. 2, it can be seen that <strong>the</strong> isohalines <strong>of</strong> values < 39.0<br />
were close to one ano<strong>the</strong>r near <strong>the</strong> entrance <strong>of</strong> Bankalah zone indicating that <strong>the</strong> rate<br />
<strong>of</strong> mixing during <strong>the</strong> inflowing <strong>of</strong> <strong>the</strong> discharged waste water with <strong>the</strong> Red Sea water<br />
was greater <strong>the</strong>re. But <strong>the</strong> isohalines were changing <strong>the</strong>ir positions back <strong>and</strong> forth (or<br />
in <strong>and</strong> out) <strong>of</strong> Bankalah zone from one cruise to ano<strong>the</strong>r. For example, <strong>the</strong>y were out<br />
during <strong>the</strong> November 1981 <strong>and</strong> January 1982 (<strong>and</strong> May 1982) cruises <strong>and</strong> were in,<br />
during <strong>the</strong> cruises <strong>of</strong> October <strong>and</strong> December 1981 (<strong>and</strong> April 1982).<br />
--- ~
30 OsmanA. EI-Rayis<br />
:I:<br />
1-3<br />
a.<br />
w4<br />
0 m<br />
1<br />
2<br />
0<br />
5<br />
6<br />
FIG. 3. Distribution <strong>of</strong> salinity along <strong>the</strong> vertical section extending across stations 1,3,12 <strong>and</strong> 14 in Jeddah<br />
coast.<br />
Figure 4, shows <strong>the</strong> change in salinity with time <strong>of</strong> sampling (between October<br />
1981 <strong>and</strong> May 1981) at station 1 near to Bankalah. The salinity was fluctuating between<br />
8.4 <strong>and</strong> 35.8, <strong>and</strong> noteworthy that <strong>the</strong> salinity was at its minimum values in <strong>the</strong><br />
cruises <strong>of</strong> November 1981 <strong>and</strong> January (<strong>and</strong> May) 1982. Th~ pattern <strong>of</strong> change <strong>of</strong> <strong>the</strong><br />
water temperature (unpublished da(a) at this station with time, shown in Fig. 4, was<br />
similar to that for salinity.<br />
Figure 4, also, shows <strong>the</strong> change in salinity <strong>and</strong> temperature with time but at a station<br />
lying outside <strong>the</strong> Bankalah zone (station 10), i.e., in <strong>the</strong> main coastal area. It<br />
shows <strong>the</strong>re is very little change in <strong>the</strong> salinity (39.3 :t: 0.3), unlike <strong>the</strong> water temperature,<br />
which was ata minimum in <strong>the</strong> winter (January 1982) <strong>and</strong> at a maximum in <strong>the</strong><br />
(summer <strong>and</strong>) autumn, October 1981. This is related to <strong>the</strong> scarcity <strong>of</strong> <strong>the</strong> precipitation,<br />
in this arid zone <strong>and</strong> agrees well with <strong>the</strong> climatic changes reported for <strong>the</strong> Red<br />
Sea region by Morcos (1970).<br />
The change in <strong>the</strong> minimum salinity observed near Bankalah (i.e., near to <strong>the</strong> discharge<br />
site <strong>of</strong> <strong>the</strong> sewage effluent) during <strong>the</strong>se cruises would be expected to depend<br />
mainly on <strong>the</strong> rate <strong>of</strong> <strong>the</strong> discharge <strong>of</strong> <strong>the</strong> fresh water accompanied <strong>the</strong> waste<br />
effluents <strong>and</strong> on <strong>the</strong> hydrographic conditions that prevails during <strong>the</strong>se times in <strong>the</strong><br />
coastal area. The first is expected not to be altered much at least during <strong>the</strong> months <strong>of</strong><br />
<strong>the</strong> cold season, November 1981 to January 1982. In addition, <strong>the</strong> <strong>Water</strong> <strong>and</strong> Wastewater<br />
Authorities in Jeddah (personal communication) confirmed <strong>the</strong> stability <strong>of</strong> <strong>the</strong><br />
rate (r'oJ 32,000 m3/day) <strong>of</strong> <strong>the</strong> discharge <strong>of</strong> <strong>the</strong> waste effluents at least during <strong>the</strong>se<br />
months. Therefore, <strong>the</strong> minimum salinity observed during November 1981 <strong>and</strong><br />
January 1982 cruises must be due to <strong>the</strong> o<strong>the</strong>r factor, <strong>the</strong> hydrographic conditions,<br />
e.g. water currents generated by <strong>the</strong> prevailing winds.
'c "<br />
Mode/<strong>of</strong> <strong>the</strong> <strong>Dispersion</strong> <strong>of</strong> <strong>Fresh</strong> <strong>Water</strong>. 31<br />
UJ 28<br />
a:<br />
=><br />
I-<br />
« 26<br />
a:<br />
UJ<br />
Q.<br />
~<br />
UJ<br />
I-<br />
,<br />
30<br />
STATION<br />
24<br />
,<br />
"<br />
/<br />
\ I<br />
22 /<br />
I<br />
/<br />
20<br />
18<br />
0'00<br />
40<br />
30<br />
>-<br />
I-<br />
20 Ẕ<br />
-J<br />
Ll<br />
OsmanA.<br />
EI-Rayis<br />
>4<br />
TRANSP~RENCY<br />
( m )<br />
>1.<br />
>,<br />
/'<br />
2<br />
1<br />
,..,..<br />
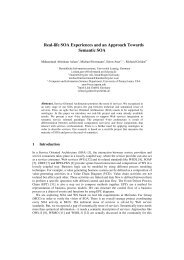
Transparency (Secchi Disc depth, in meter) for <strong>the</strong> coastal area <strong>of</strong> <strong>the</strong> Red Sea in front <strong>of</strong> leddah<br />
at four different cruises.<br />
FIG. 6. Distribution <strong>of</strong> total suspended matter (mg/l) in <strong>the</strong> surface water <strong>of</strong> <strong>the</strong> Red Seacoast <strong>of</strong>f Jeddal<br />
at four different times.
<strong>Model</strong> <strong>of</strong> <strong>the</strong> <strong>Dispersion</strong> <strong>of</strong> <strong>Fresh</strong> <strong>Water</strong>.<br />
33<br />
The distribution pattern <strong>of</strong> <strong>the</strong> o<strong>the</strong>r chemical elements, dissolved oxygen or hydrogen<br />
sulphide, phosphate <strong>and</strong> manganese during <strong>the</strong> period between October 1981<br />
<strong>and</strong> January 1982 were quite similar to that mentioned above <strong>and</strong> all show that <strong>the</strong><br />
flowing <strong>of</strong> <strong>the</strong> Bankalah water towards <strong>the</strong> sea was more pronounced during <strong>the</strong><br />
cruises <strong>of</strong> November 1981 <strong>and</strong> January 1982. The level <strong>of</strong> concentration <strong>and</strong> distribution<br />
for <strong>the</strong>se chemical elements in <strong>the</strong> surface water <strong>of</strong> Jeddah coast, represented by<br />
<strong>the</strong> January 1982 cruise, are shown in Fig. 7 <strong>and</strong> 8a.<br />
The wind direction observed during <strong>the</strong> present study was nor<strong>the</strong>rly to nor<strong>the</strong>rlywest<br />
during <strong>the</strong> October <strong>and</strong> December 1981 cruises, whereas during <strong>the</strong> cruises <strong>of</strong><br />
November 1981 <strong>and</strong> January 1982 <strong>the</strong> winds were ranging between calm <strong>and</strong> light<br />
breeze. During <strong>the</strong> nor<strong>the</strong>rly to NW winds, it seems likely that a water movement in<br />
<strong>the</strong> same wind direction, i.e. towards south-sou<strong>the</strong>ast in <strong>the</strong> study area towards Bankalah<br />
zone), has happened <strong>and</strong> caused two effects. The first was <strong>the</strong> restriction or accumulation<br />
<strong>of</strong> <strong>the</strong> mixed water <strong>the</strong>re, inside <strong>the</strong> Bankalah area. The second was <strong>the</strong><br />
increase <strong>of</strong> <strong>the</strong> proportion <strong>of</strong> <strong>the</strong> sea water volume relative to that <strong>of</strong> <strong>the</strong> discharged<br />
waste water, indicated from <strong>the</strong> rise in <strong>the</strong> salinity <strong>of</strong> <strong>the</strong> Bankalah water, especially<br />
near <strong>the</strong> discharge site, station 1, to reach values> 25.0.<br />
When <strong>the</strong> sea was calm, <strong>the</strong> chance became greater for <strong>the</strong> surplus water inside<br />
Bankalah zone to spread out towards <strong>the</strong> sea as a surface layer <strong>of</strong> low salinity lying<br />
over more saline waters, Fig. 3. The spread <strong>of</strong> <strong>the</strong> surplus water is expected to be<br />
much greater if <strong>the</strong> wind direction turned to south to sou<strong>the</strong>ast. According to Morcos<br />
(1970) <strong>the</strong> prevailing winds in this area o,f <strong>the</strong> Red Sea are from <strong>the</strong> north to northwest<br />
<strong>and</strong> <strong>the</strong> tidal range <strong>of</strong> <strong>the</strong> latitude <strong>of</strong> J eddah is at its minimum; less than 30 cm.<br />
<strong>Model</strong> <strong>of</strong> <strong>Dispersion</strong> <strong>of</strong> <strong>the</strong> Chemical Pollutants (Phosphate)<br />
According to Ketchum <strong>and</strong> Keen (1955), in estuaries or coastal areas, when fresh<br />
water flows into <strong>the</strong> sea, a mixture develops that represents a salinity ratio between<br />
<strong>the</strong> two extremes. The amount <strong>of</strong> fresh water in <strong>the</strong> mixture can be estimated by<br />
measuring <strong>the</strong> salinity <strong>of</strong> <strong>the</strong> mixture (S) <strong>and</strong> <strong>the</strong> salinity <strong>of</strong> <strong>the</strong> open sea water ( So)<br />
neighbouring <strong>the</strong> estuary or <strong>the</strong> coastal area. The percentage <strong>of</strong> fresh water (F) is<br />
equal to,<br />
F % = (So -S) / So (1)<br />
The concentration <strong>of</strong> any element discharged with <strong>the</strong> fresh water obviously will follow<br />
<strong>the</strong> fresh water-sea water distribution, if this element is a conservative one, i.e.<br />
its concentration would not be altered, e.g. by biological activity, en route down<br />
stream towards <strong>the</strong> sea. In this case, <strong>the</strong> observed concentration <strong>of</strong> this element at<br />
any location en route would be :<br />
Ci = F% .Co/ 100 (2)<br />
where Ci, <strong>the</strong> concentration at some point down stream from <strong>the</strong> fresh water source<br />
<strong>and</strong> Co <strong>the</strong> concentration <strong>of</strong> <strong>the</strong> conservative pollutant in <strong>the</strong> fresh water source. F %<br />
is obtained from equation (1).
34 OsmanA. EI-Rayis<br />
FIG. 7. Distribution <strong>of</strong> dissolved oxygen or hydrogen sulphide <strong>and</strong> manganese in <strong>the</strong> surface water <strong>of</strong> <strong>the</strong><br />
Red Sea coast in front <strong>of</strong> Jeddah.
Mode/<strong>of</strong> <strong>the</strong> D;spers;on<strong>of</strong><strong>Fresh</strong> W<br />
(<br />
35<br />
(<br />
~<br />
0<br />
a-<br />
u<br />
41<br />
~<br />
.c<br />
D-<br />
In<br />
0<br />
.c D-<br />
41 "-<br />
> Q.<br />
:;; ~<br />
u ~<br />
ra<br />
41<br />
...<br />
"0<br />
41<br />
...<br />
:J<br />
~<br />
.. 41<br />
~<br />
(<br />
'"<br />
v<br />
u -<br />
I ..<br />
o~ :z<br />
a. ~<br />
u<br />
"0 Q) .-C<br />
...Q)<br />
~ ...<br />
-~ ='.c<br />
,9,c.<br />
~ '"<br />
u 0<br />
,-..c u c.<br />
'-"""0<br />
.Q)<br />
Q) ...<br />
oo~<br />
~-<br />
...='<br />
C u<br />
u Q)-~<br />
...u<br />
Q)"O<br />
c.C<br />
Q)"O<br />
...~<br />
...Q)<br />
~ ...<br />
~ ='<br />
'"<br />
.c ~<br />
'" Q)<br />
~ E<br />
Q)<br />
,-..c..;<br />
.0"'-<br />
'-""c~<br />
.Q):E ~Q) ~<br />
,,~ Q)<br />
~...""<br />
:Q)""<br />
E.o 0<br />
0..Q) ...<br />
u<br />
C<br />
r~ C 0<br />
'-'Q).t=<br />
Q) ~ C<br />
~ ~.-<br />
.c.-'" c."O ~<br />
'" Q) 0<br />
O.cU<br />
.c ...~<br />
c.'-'Q)<br />
"O~C/)<br />
Q)"O"O<br />
> C Q)<br />
O~~<br />
~'-::'Q)<br />
:a c..>- oS<br />
"';;"Q)O '-""<br />
'-""~...<br />
cQ)<br />
Oc.~<br />
C ~ ~<br />
O.cQ)<br />
'p c. u<br />
=' ~<br />
.oQ)<br />
...> ...<br />
='<br />
'" U '"<br />
.-~ Q)<br />
O~oS<br />
tx5<br />
d<br />
Ii:<br />
\
36<br />
OsmanA.<br />
El-Rayis<br />
But if <strong>the</strong> element is not conservative <strong>the</strong>re would be a loss or gain in <strong>the</strong> concentration<br />
at any location en route. Therefore, <strong>the</strong> equation becomes,<br />
C;=F%.Co/100:tUs (3)<br />
where Us is <strong>the</strong> loss or gain in <strong>the</strong> concentration en route due to.. e.g. biological uptake<br />
or addition from o<strong>the</strong>r source(s) in <strong>the</strong> region, respectively.<br />
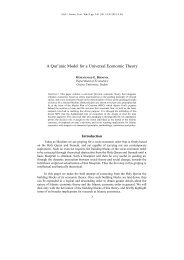
The January 1982 cruise was chosen for investigating <strong>the</strong> dispersion <strong>of</strong> phosphate<br />
in <strong>the</strong> surface water <strong>of</strong> Jeddah coast. It was assumed that vertical mixing in <strong>the</strong> Jeddah<br />
coastal area during this cruise was unimportant in deciding <strong>the</strong> concentrations <strong>of</strong><br />
pollutants in <strong>the</strong> surface water. The percentage <strong>of</strong> fresh water throughout <strong>the</strong> surface<br />
water <strong>of</strong> Jeddah coast has been calculated <strong>and</strong> is shown in Fig. 8b. The fresh water<br />
content ranged between 0.5 <strong>and</strong> 74.8%. The reference source <strong>of</strong> fresh water <strong>of</strong> salinity<br />
reach 1.8 <strong>and</strong> it contained 105.6 ~ mole phosphate-P/I (EI-Rayis, unpublished<br />
data).<br />
Figure 8c, would describe <strong>the</strong> distribution <strong>of</strong> phosphate if it were being diluted<br />
with a surface Red Sea source having no phosphate <strong>and</strong> from which biological effects<br />
were absent. .<br />
The trend in <strong>the</strong> phosphate concentration <strong>and</strong> its dispersion in <strong>the</strong> surface water <strong>of</strong><br />
Jeddah coast predicted by <strong>the</strong> model almost follows <strong>the</strong> trend in <strong>the</strong> observed concentration<br />
(Fig. 8a). This suggests that <strong>the</strong> differences between <strong>the</strong> observed concentrations<br />
are largely controlled by <strong>the</strong> mixing <strong>of</strong> sewage effluents <strong>and</strong> <strong>the</strong> Red Sea<br />
coastal water. Figure 8d, shows <strong>the</strong> difference between <strong>the</strong> measured values <strong>and</strong> <strong>the</strong><br />
calculated values <strong>of</strong> phosphate. This figure, clearly shows areas <strong>of</strong> negative <strong>and</strong> positive<br />
values, i.e. areas where phosphate is lost or exhausted en route <strong>and</strong> areas that are<br />
affected by contribution from o<strong>the</strong>r sources, respectively. The o<strong>the</strong>r sources, shown<br />
in Fig. 8d, are Lagoon Arbaeen <strong>and</strong> AI-Hamra District (Fig. 1). One particular<br />
source was significant here, <strong>the</strong> run<strong>of</strong>f from <strong>the</strong> coastal Lagoon Arbaeen, that receives<br />
domestic sewage effluents mainly from <strong>the</strong> Eastern Baghdadiah District north<br />
<strong>of</strong> Jeddah City Center, EI-Rayis et at. 1988. The contribution from <strong>the</strong> o<strong>the</strong>r source,<br />
AI-Hamra District, seems to be less pronounced than that from <strong>the</strong> lagoon.<br />
Conclusion<br />
The dispersion <strong>of</strong> <strong>the</strong> pollutants discharged in leddah coastal area is generally controlled<br />
by <strong>the</strong> surface water movement in <strong>the</strong> down wind; mainly nor<strong>the</strong>rn to northwesterly<br />
winds.. Therefore, <strong>the</strong> dispersion <strong>of</strong> <strong>the</strong> wastes discharged from <strong>the</strong> present<br />
two sources in Bankalah semi-enclosed embayment, its entrance is directed towards<br />
northwest, will be hindered during <strong>the</strong> periods <strong>of</strong> <strong>the</strong> prevailing N-NW winds. During<br />
<strong>the</strong> frequent periods <strong>of</strong> calm or light breeze, or during sou<strong>the</strong>rn to sou<strong>the</strong>astern<br />
winds, <strong>the</strong> chance <strong>the</strong>n will be greater for <strong>the</strong> spread <strong>of</strong> <strong>the</strong> surplus water from Bankalah<br />
zone to <strong>the</strong> sea as a surface low salinity layer loaded with <strong>the</strong> sewage materials.<br />
The fate <strong>and</strong> <strong>the</strong> accumulation site( s) <strong>of</strong> <strong>the</strong>se wastes in <strong>the</strong> coastal area need fur<strong>the</strong>r<br />
investigation.
<strong>Model</strong> <strong>of</strong>lhe <strong>Dispersion</strong> <strong>of</strong> <strong>Fresh</strong> Waler.<br />
37<br />
Acknowledgement<br />
The author wishes to thank Pr<strong>of</strong>. Dr. J.P. Riley, Head <strong>of</strong> <strong>the</strong> Oceanography Department,<br />
Liverpool University, for critical reading <strong>of</strong> <strong>the</strong> manuscript.<br />
References<br />
Behairy, K.A.A. <strong>and</strong> Saad, M.A.H. (1984a) Effect <strong>of</strong> pollution on <strong>the</strong> coastal waters <strong>of</strong> <strong>the</strong> Red Sea in<br />
front <strong>of</strong> Jeddah, Saudi Arabia. 1- Environmental conditions, Tethys, 11: 111-117.<br />
Behairy, K.A.A. <strong>and</strong> Saad, M.A.H. (1984b) Effect <strong>of</strong> pollution on <strong>the</strong> coastal waters <strong>of</strong> Jeddah, Saudi<br />
Arabia. 2- Nutrient salts, Tethys, 11: 119-125.<br />
EI-Rayis, O.A., Abbas, M.M. <strong>and</strong> Qurashi, A.A. (1982) Distribution <strong>of</strong> chemical pollutants in Jeddah<br />
coastal waters, Red Sea. 1- Phosphate <strong>and</strong> silicate, J. Fac. Mar. Sci., Jeddah 2: 73-81.<br />
EI-Rayis, O.A., EI-Nakkadi, A.M.N. <strong>and</strong> Moammar, M.O. (1988) Monitoring <strong>and</strong> assessment <strong>of</strong> <strong>the</strong><br />
water quality <strong>of</strong> <strong>the</strong> coastal lagoon "Arabaeen", Jeddah. A report submitted to <strong>the</strong> Resea1'ch Council<br />
<strong>of</strong> King Abdulaziz University, 40 p.<br />
EI-Rayis, O.A., EI-Sayed, M.M. <strong>and</strong> Turki, A.J. (1985) A preliminary investigation for level <strong>and</strong> distribution<br />
<strong>of</strong> some heavy metals in coastal water in Jeddah, Red Sea, during 1981-1982, Proc. Symp.<br />
Coral Reef Environ. Red Sea, Jeddah, Jan. 1984, pp. 147-169.<br />
Ketchum, B.H. <strong>and</strong> Keen, D. T. (1955) The accumulation <strong>of</strong> river water over <strong>the</strong> continental shelf between<br />
Cap Coda <strong>and</strong> Chesapeak Bay. Map. Mar. Bioi. <strong>and</strong> Oceanogr. Suppl. to V()l. 3, Deep-Sea Res.:<br />
346-357.<br />
Morcos, S.A. (1970) Physical <strong>and</strong> chemical oceanography <strong>of</strong> <strong>the</strong> Red Sea, Oceanogr. Mar. Bioi. Ann.<br />
Rev., 8: 73-202.
38 OsmanA. El-Rayis<br />
&<br />
J I..>?\I\ I..>.J~\ ~\.J"'J ~.1J\ o~\ .J~\ ~~""<br />
& &<br />
;J..:o:. rl.\ r \II' .NJ ~W\ o~\<br />
* ~)' ~, J..:$' "oJ~<br />
)!;~\ -¥ .!.ill I ~L:o:- -J~\ r..,1:- "A¥<br />
~~., II ~..,.JI ~\ -oJ-";.<br />
ol:LI J I.S?~I I.S)~I ~\y J ~j..JI ol:L1 ~ ~jy ~\)~ ( J:.J<br />
I.;. ( , rt.JI ..:r- ~<br />
.;...\j.,lil oj.,. ~<br />
..,<br />
~<br />
.;...li j J;&- o.l;,- rL.1 r'1l .J"'..!I ~.;.W ~I<br />
:.>i J ' ;uA.;,J1 ~ J L.L.i ~ .;...\j ~\ :.>i d' ~\<br />
:.>iJ'~J).Il1 ~I...JI ~ J~\ 1.1~\ ...,.;l:J;.1 J \)~I<br />
.o~l...J\ C Il)~ 0 ;l:l\ ~\<br />
ol:L1 -.s-.;::: L.L.i L.~<br />
jSi :.>'6'<br />
:.>'6' ~\<br />
.;,i ~1)<br />
( .,:.,I,A,AII ) ":"~.,Ill .l.>-i Js- J~~<br />
J)i c~.f ..;.,k; f<br />
.~ )J~I ~ ":"~'p1 .,;l.;.'i .:;:-1.. .:It?! .:ItJ.!...4.0 !.Jl:.A<br />
-4A -., .I..\,_1\ *<br />
J~-")")' ,,-""'- )",,-,",-"'"