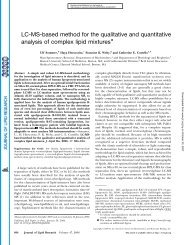
A Liquid Chromatography-Mass Spectrometry ... - Plant Physiology
A Liquid Chromatography-Mass Spectrometry ... - Plant Physiology
A Liquid Chromatography-Mass Spectrometry ... - Plant Physiology

Create successful ePaper yourself
Turn your PDF publications into a flip-book with our unique Google optimized e-Paper software.
Breakthrough Technologies<br />
A <strong>Liquid</strong> <strong>Chromatography</strong>-<strong>Mass</strong> <strong>Spectrometry</strong>-Based<br />
Metabolome Database for Tomato 1<br />
Sofia Moco*, Raoul J. Bino, Oscar Vorst, Harrie A. Verhoeven, Joost de Groot, Teris A. van Beek,<br />
Jacques Vervoort, and C.H. Ric de Vos<br />
Laboratory of Biochemistry, Wageningen University, 6703 HA Wageningen, The Netherlands (S.M., J.V.);<br />
<strong>Plant</strong> Research International, 6700 AA Wageningen, The Netherlands (S.M., R.J.B., O.V., H.A.V., J.d.G.,<br />
C.H.R.d.V.); Centre for BioSystems Genomics, 6700 AB Wageningen, The Netherlands (S.M., R.J.B., O.V.,<br />
H.A.V., C.H.R.d.V.); Laboratory of Organic Chemistry, Wageningen University, 6703 HB Wageningen,<br />
The Netherlands (T.A.v.B.); and Laboratory of <strong>Plant</strong> <strong>Physiology</strong>, Wageningen University,<br />
6703 BD Wageningen, The Netherlands (R.J.B.)<br />
For the description of the metabolome of an organism, the development of common metabolite databases is of utmost importance.<br />
Here we present the Metabolome Tomato Database (MoTo DB), a metabolite database dedicated to liquid chromatography-mass<br />
spectrometry (LC-MS)- based metabolomics of tomato fruit (Solanum lycopersicum). A reproducible analytical approach consisting<br />
of reversed-phase LC coupled to quadrupole time-of-flight MS and photodiode array detection (PDA) was developed for largescale<br />
detection and identification of mainly semipolar metabolites in plants and for the incorporation of the tomato fruit metabolite<br />
data into the MoTo DB. Chromatograms were processed using software tools for mass signal extraction and alignment, and<br />
intensity-dependent accurate mass calculation. The detected masses were assigned by matching their accurate mass signals with<br />
tomato compounds reported in literature and complemented, as much as possible, by PDA and MS/MS information, as well as by<br />
using reference compounds. Several novel compounds not previously reported for tomato fruit were identified in this manner and<br />
added to the database. The MoTo DB is available at http://appliedbioinformatics.wur.nl and contains all information so far<br />
assembled using this LC-PDA-quadrupole time-of-flight MS platform, including retention times, calculated accurate masses,<br />
PDA spectra, MS/MS fragments, and literature references. Unbiased metabolic profiling and comparison of peel and flesh tissues<br />
from tomato fruits validated the applicability of the MoTo DB, revealing that all flavonoids and a-tomatine were specifically<br />
present in the peel, while several other alkaloids and some particular phenylpropanoids were mainly present in the flesh tissue.<br />
For understanding the dynamic behavior of a complex<br />
biological system, it is essential to follow, as<br />
unbiased as possible, its response to a conditional<br />
perturbation at the transcriptome, proteome, and metabolome<br />
levels. To study the dynamics of the metabolome,<br />
to analyze fluxes in metabolic pathways, and to<br />
decipher the biological roles of metabolites, the identification<br />
of the participating metabolites should be as<br />
unambiguous as possible. Metabolomics is defined as<br />
the analysis of all metabolites in an organism and<br />
concerns the simultaneous (multiparallel) measurement<br />
of all metabolites in a given biological system<br />
(Dixon and Strack, 2003). However, this is a technically<br />
challenging task, as no single analytical method is<br />
capable of extracting and detecting all metabolites at<br />
1 This work was supported by the European Community-Access to<br />
Research Infrastructure action of the Improving Human Potential Program<br />
(grant no. HPRI–CT–1999–00085), the EU RTD project Capillary<br />
NMR (grant no. HPRI–CT–1999–50018), and the research programme of<br />
the Centre of BioSystems Genomics that is a part of The Netherlands<br />
Genomics Initiative/Netherlands Organization for Scientific Research.<br />
* Corresponding author; e-mail sofia.moco@wur.nl; fax 31–317–<br />
484801.<br />
The author responsible for distribution of materials integral to the<br />
findings presented in this article in accordance with the policy<br />
described in the Instructions for Authors (www.plantphysiol.org) is:<br />
Sofia Moco (sofia.moco@wur.nl).<br />
www.plantphysiol.org/cgi/doi/10.1104/pp.106.078428.<br />
once due to the enormous chemical variety of metabolites<br />
and the large range of concentrations at which<br />
metabolites can be present. Therefore, the characterization<br />
of a complete metabolome requires different<br />
complementary analytical technologies. Currently,<br />
mass spectrometry (MS) is the most sensitive method<br />
enabling the detection of hundreds of compounds<br />
within single extracts.<br />
Ideally, metabolome data should be incorporated<br />
into open access databases where information can be<br />
viewed, sorted, and matched. Different pathway resources<br />
are available that combine information from<br />
the omics technologies such as the Kyoto Encyclopedia<br />
of Genes and Genomes (http://www.genome.jp/kegg),<br />
MetaCyc (http://metacyc.org), or The Arabidopsis<br />
Information Resource (http://www.arabidopsis.org).<br />
Hitherto, research on plant metabolic profiling using<br />
chromatographic techniques coupled to MS technologies<br />
for database purposes has been accomplished by<br />
gas chromatography (GC)-MS analysis of extracts<br />
(Schauer et al., 2005; Tikunov et al., 2005). GC-MS<br />
entails high reproducibility in both chromatography<br />
and mass fragmentation patterns. This reproducibility<br />
enabled the development of common metabolite databases,<br />
e.g. GMD@CSB.DB (http://csbdb.mpimp-golm.<br />
mpg.de/csbdb/gmd/gmd.html) and the Fiehn-Library<br />
(http://fiehnlab.ucdavis.edu/compounds), that gather<br />
information mainly on primary metabolites.<br />
<strong>Plant</strong> <strong>Physiology</strong>, August 2006, Vol. 141, pp. 1205–1218, www.plantphysiol.org Ó 2006 American Society of <strong>Plant</strong> Biologists 1205
Moco et al.<br />
<strong>Liquid</strong> chromatography (LC)-MS is the preferred<br />
technique for the separation and detection of the large<br />
and often unique group of semipolar secondary metabolites<br />
in plants. Specifically, high resolution accurate<br />
mass MS enables the detection of large numbers of<br />
parent ions present in a single extract and can provide<br />
valuable information on the chemical composition and<br />
thus the putative identity of large numbers of metabolites.<br />
Recently, accurate mass LC-MS was performed to<br />
detect secondary metabolites present in roots and leaves<br />
of Arabidopsis (Arabidopsis thaliana; von Roepenack-<br />
Lahaye et al., 2004), to study metabolic alterations<br />
in a light-hypersensitive mutant of tomato (Solanum<br />
lycopersicum; Bino et al., 2005), and to compare tubers<br />
of potato (Solanum tuberosum) of different genetic origin<br />
and developmental stages (Vorst et al., 2005). The<br />
variety of LC-MS systems, and the generally poorer<br />
retention time reproducibility of LC compared to GC,<br />
limits the establishment of a single optimized analytical<br />
procedure and hampers the comparison of LC-MS<br />
chromatograms between laboratories. Moreover, software<br />
tools able to transform automatically MS data into<br />
a list of (putative) plant metabolites, in particular for<br />
LC-MS, are not yet available. This implies that analyses<br />
of mass signal datasets are left to manual searches in the<br />
available chemical databases such as SciFinder, Pub-<br />
Chem, or Dictionary of Natural Products. To extend the<br />
applicability of LC-MS in plant metabolomics, efforts<br />
should be made in (1) the establishment of a routine<br />
and reproducible LC-MS method, (2) the annotation of<br />
the large numbers of mass signals detected, (3) the<br />
unambiguous identification of compounds, and (4) the<br />
development of a common reference database and<br />
searching tools for secondary metabolites in plants.<br />
In this article we present an open access metabolite<br />
database for LC-MS, called Metabolome Tomato Database<br />
(MoTo DB), dedicated to tomato fruit. This database<br />
is based on literature information combined with<br />
experimental data derived from LC-MS-based metabolomics<br />
experiments. A reproducible and robust<br />
C 18<br />
-based reversed-phase LC-photodiode array detection<br />
(PDA)-electrospray ionization (ESI)-quadrupole<br />
time-of-flight (QTOF)-MS method was developed for<br />
the detection and putative identification of predominantly<br />
secondary metabolites of semipolar nature. The<br />
assignment of mass signals detected relies on the combination<br />
of the parameters: (1) accurate mass, (2) retention<br />
time, (3) UV/Vis spectral information, and (4) MS/<br />
MS fragmentation data. To demonstrate the applicability<br />
of the established LC-MS metabolomics platform<br />
including database searching, peel and flesh tissues<br />
from ripe tomato fruit were compared for differences in<br />
metabolic composition. Statistically significant differences<br />
in LC-QTOF MS profiles between the tissues were<br />
identified in an unbiased manner, and differential mass<br />
peaks were annotated by searching in the MoTo DB.<br />
Several compounds not previously reported in tomato<br />
were also identified and have been incorporated into<br />
the database. All available information in the MoTo DB<br />
can be searched at http://appliedbioinformatics.wur.nl.<br />
RESULTS<br />
Metabolites Present in Tomato Fruit According<br />
to Literature<br />
First, a database was constructed based on literature<br />
research to include metabolites reported to be present<br />
in tomato fruit from both wild and cultivated varieties<br />
as well as transgenic tomato plants. Though some<br />
tomato varieties are known to contain anthocyanins in<br />
their fruit (Jones et al., 2003), so far, to our knowledge,<br />
there are no reports on the identification of this class of<br />
compounds in fruit tissue. Therefore, in our literature<br />
search we included reports on anthocyanin identification<br />
in seedlings of tomato. Names (common and<br />
International Union of Pure and Applied Chemistry<br />
[IUPAC]), Chemical Abstracts Service (CAS) registry<br />
number, molecular formula, monoisotopic accurate<br />
mass, published references, and other properties of<br />
each metabolite are systematized in this database. The<br />
database includes polar, semipolar, and apolar compounds.<br />
Because the procedure used by us for extraction,<br />
separation, and detection (see below) is biased<br />
toward compounds of semipolar nature, we expected<br />
mostly secondary metabolites like (poly)phenols, alkaloids,<br />
and derivatives thereof to be detected. Table I<br />
summarizes all (poly)phenolic compounds (48) and<br />
alkaloids (15) so far reported to be present in tomato<br />
fruit extracts, including compounds that have been<br />
identified only in fruits of transgenic tomato plants.<br />
Many compounds were assigned before MS technologies<br />
became available. The number of compounds<br />
identified by NMR is very limited.<br />
Metabolite Extraction and LC-PDA-MS Analysis<br />
A representative tomato fruit sample was obtained<br />
by combining fruits of 96 different tomato cultivars<br />
producing ripe red, orange-colored beef, round, or<br />
cherry type of fruits at different stages of ripening<br />
(Tikunov et al., 2005). In addition, some purple-skinned<br />
fruits were selected for analyses of anthocyanins,<br />
which is a class of tomato fruit compounds only occurring<br />
in specific varieties (Jones et al., 2003) or in<br />
transgenic plants (Mathews et al., 2003). Peel material<br />
was chosen as the starting material, as this tissue<br />
contains the highest levels of flavonoids (Muir et al.,<br />
2001), which represent an important class of secondary<br />
metabolites. The 75% methanol/water extract enabled<br />
separation by C 18 -reversed-phase LC and detection by<br />
both PDA and MS of semipolar metabolites. Figure 1<br />
shows an example of a chromatogram obtained upon<br />
LC-PDA-QTOF-MS analysis of 75% methanol/water<br />
extracts from tomato peel. These extracts were stable<br />
for several months at 220°C, as determined by comparing<br />
LC-PDA chromatograms. Only naringenin<br />
chalcone was observed to decay slowly into naringenin<br />
while standing in the autosampler (20°C) during a<br />
series of analyses (about 1.4 mg g 21 fresh weight h 21 ).<br />
To test the reproducibility of the LC system, chromatograms<br />
of the tomato fruit material that have been<br />
1206 <strong>Plant</strong> Physiol. Vol. 141, 2006
Tomato Fruit Metabolite Database<br />
Table I. List of secondary metabolites identified in tomato fruit extracts according to literature<br />
Mol Form, Molecular formula; MM, monoisotopic molecular mass.<br />
Compound Mol Form MM Reference<br />
p-Hydroxybenzoic acid C 7 H 6 O 3 138.0317 Mattila and Kumpulainen (2002)<br />
Salicylic acid C 7 H 6 O 3 138.0317 Schmidtlein and Herrmann (1975), Petró-Turza (1987)<br />
Cinnamic acid C 9<br />
H 8<br />
O 2<br />
148.0524 Petró-Turza (1987)<br />
Protocatechuic acid C 7 H 6 O 4 154.0266 Mattila and Kumpulainen (2002) a<br />
m-Coumaric acid C 9 H 8 O 3 164.0474 Hunt and Baker (1980) a<br />
p-Coumaric acid C 9 H 8 O 3 164.0473 Schmidtlein and Herrmann (1975) a , Hunt and Baker (1980) a , Petró-Turza<br />
(1987), Martinez-Valverde et al. (2002), Mattila and Kumpulainen<br />
(2002), Raffo et al. (2002), Le Gall et al. (2003a) bc<br />
Vanillic acid C 8 H 8 O 4 168.0423 Schmidtlein and Herrmann (1975), Mattila and Kumpulainen (2002)<br />
Caffeic acid C 9<br />
H 8<br />
O 4<br />
180.0423 Schmidtlein and Herrmann (1975) a , Hunt and Baker (1980) a , Martinez-<br />
Valverde et al. (2002), Mattila and Kumpulainen (2002), Raffo et al.<br />
(2002), Sakakibara et al. (2003), Minoggio et al. (2003), Le Gall et al.<br />
(2003a) bc<br />
Ferulic acid C 10<br />
H 10<br />
O 4<br />
194.0579 Schmidtlein and Herrmann (1975) a , Hunt and Baker (1980) a , Martinez-<br />
Valverde et al. (2002), Mattila and Kumpulainen (2002), Raffo et al.<br />
(2002), Minoggio et al. (2003)<br />
Sinapic acid C 11 H 12 O 5 224.0685 Schmidtlein and Herrmann (1975) a<br />
Naringenin C 15 H 12 O 5 272.0685 (Hunt and Baker, 1980) a ; (Justesen et al., 1998) a , (Martinez-Valverde et al.,<br />
2002) a , (Raffo et al., 2002), (Minoggio et al., 2003)<br />
Naringenin chalcone C 15 H 12 O 5 272.0685 Hunt and Baker (1980) a , Krause and Galensa (1992), Muir et al. (2001), Le<br />
Gall et al. (2003b) b , Minoggio et al. (2003)<br />
Kaempferol C 15 H 10 O 6 286.0477 Stewart et al. (2000), Martinez-Valverde et al. (2002) a , Tokusoglu et al.<br />
(2003) a<br />
Quercetin C 15 H 10 O 7 302.0427 Hertog et al. (1992), Crozier et al. (1997) a , Justesen et al. (1998) a , Stewart<br />
et al. (2000), Martinez-Valverde et al. (2002) a , Raffo et al. (2002),<br />
Sakakibara et al. (2003), Tokusoglu et al. (2003) a<br />
Myricetin C 15 H 10 O 8 318.0376 Raffo et al. (2002), Sakakibara et al. (2003), Tokusoglu et al. (2003) a<br />
p-Coumaric acid-O-b-Dglucoside<br />
C 15 H 18 O 8 326.1002 Fleuriet and Macheix (1977), Reschke and Herrmann (1982) a , Winter and<br />
Herrmann (1986) c , Buta and Spaulding (1997)<br />
p-Coumaroylquinic acid C 16 H 18 O 8 338.1002 Fleuriet and Macheix (1977)<br />
Caffeic acid-4-O-b-D-glucoside C 15 H 18 O 9 342.0951 Fleuriet and Macheix (1977), Winter and Herrmann (1986)<br />
Chlorogenic acid (3-Ocaffeoylquinic<br />
acid)<br />
C 16<br />
H 18<br />
O 9<br />
354.0951 Fleuriet and Macheix (1977), Fleuriet and Macheix (1981), Winter and<br />
Herrmann (1986), Buta and Spaulding (1997), Martinez-Valverde et al.<br />
(2002), Mattila and Kumpulainen (2002), Raffo et al. (2002), Sakakibara<br />
et al. (2003), Minoggio et al. (2003), Le Gall et al. (2003a, 2003b) bc<br />
4-O-Caffeoylquinic acid C 16<br />
H 18<br />
O 9<br />
354.0951 Winter and Herrmann (1986), Mattila and Kumpulainen (2002)<br />
5-O-Caffeoylquinic acid C 16 H 18 O 9 354.0951 Winter and Herrmann (1986)<br />
Ferulic acid-O-b-D-glucoside C 16 H 20 O 9 356.1107 Fleuriet and Macheix (1977), Reschke and Herrmann (1982), Winter and<br />
Herrmann (1986)<br />
Feruloylquinic acid C 17<br />
H 20<br />
O 9<br />
368.1107 Fleuriet and Macheix (1977)<br />
Tomatidine C 27 H 45 NO 2 415.3450 Juvik et al. (1982) a , Friedman et al. (1998) a<br />
Tomatidenol C 27 H 43 NO 2 413.3294 Juvik et al. (1982) a , Friedman et al. (1994) a , Friedman et al. (1997) a ,<br />
Friedman (2002) a<br />
Naringenin-7-O-glucoside C 21 H 22 O 10 434.1213 Hunt and Baker (1980), Le Gall et al. (2003a, 2003b) bc<br />
Naringenin chalcone-glucoside C 21 H 22 O 10 434.1213 Bino et al. (2005)<br />
Astragalin C 21 H 20 O 11 448.1006 Le Gall et al. (2003a, 2003b) bc<br />
Dihydrokaempferol-7-O-hexoside<br />
C 21<br />
H 22<br />
O 11<br />
450.1162 Le Gall et al. (2003a, 2003b) bc<br />
and Dihydrokaempferol-<br />
?-O-hexoside<br />
Isoquercitrin C 21 H 20 O 12 464.0955 Muir et al. (2001) b , Le Gall et al. (2003a, 2003b) b<br />
Myricitrin C 21<br />
H 20<br />
O 12<br />
464.0955 Sakakibara et al. (2003)<br />
Naringin C 27 H 32 O 14 580.1792 Bovy et al. (2002) abd<br />
Kaempferol-3-O-rutinoside C 27 H 30 O 15 594.1585 Bovy et al. (2002) bd , Le Gall et al. (2003b) bc<br />
Kaempferol-3-7-di-O-glucoside C 27 H 30 O 16 610.1534 Le Gall et al. (2003a, 2003b) bc<br />
Rutin C 27<br />
H 30<br />
O 16<br />
610.1534 Fleuriet and Macheix (1977), Buta and Spaulding (1997), Stewart et al.<br />
(2000), Muir et al. (2001), Raffo et al. (2002); Le Gall et al. (2003a,<br />
2003b) bc , Minoggio et al. (2003)<br />
Quercetin-3-O-trisaccharide C 32<br />
H 38<br />
O 20<br />
742.1956 Muir et al. (2001), Minoggio et al. (2003)<br />
p-Coumaric acid-rutin<br />
conjugate<br />
C 36 H 36 O 18 756.1902 Buta and Spaulding (1997)<br />
(Table continues on following page.)<br />
<strong>Plant</strong> Physiol. Vol. 141, 2006 1207
Moco et al.<br />
Table I. (Continued from previous page)<br />
Compound Mol Form MM Reference<br />
Kaempferol-3-O-rutinoside- C 33 H 40 O 20 756.2113 Le Gall et al. (2003a, 2003b) bc<br />
7-O-glucoside<br />
Delphinidin-3-O-rutinoside-<br />
1<br />
C 33<br />
H 41<br />
O 21<br />
773.2135 Mathews et al. (2003) bd<br />
5-O-glucoside<br />
Petunidin-3-O-rutinoside-5-Oglucoside<br />
1<br />
C 34 H 43 O 21 787.2291 Mathews et al. (2003) bd<br />
Malvidin-3-O-rutinoside-5-Oglucoside<br />
1<br />
C 35<br />
H 45<br />
O 21<br />
801.2448 Mathews et al. (2003) bd<br />
Delphinidin-3-O-(p-coumaroyl)<br />
1<br />
C 42 H 47 O 23 919.2503 Mathews et al. (2003) bd<br />
rutinoside-5-O-glucoside<br />
Petunidin-3-O-(p-coumaroyl)-<br />
1<br />
C 43<br />
H 49<br />
O 23<br />
933.2659 Bovy et al. (2002) bd , Mathews et al. (2003) bd<br />
rutinoside-5-O-glucoside<br />
Delphinidin-3-O-(caffeoyl)-<br />
1<br />
C 42 H 47 O 24 935.2452 Mathews et al. (2003) bd<br />
rutinoside-5-O-glucoside<br />
Malvidin-3-O-(p-coumaroyl)-<br />
1<br />
C 44 H 51 O 23 947.2816 Bovy et al. (2002) bd , Mathews et al. (2003) bd<br />
rutinoside-5-O-glucoside<br />
Petunidin-3-(caffeoyl)-<br />
1<br />
C 43 H 49 O 24 949.2608 Bovy et al. (2002) bd , Mathews et al. (2003) bd<br />
rutinoside-5-O-glucoside<br />
Malvidin-3-(caffeoyl)-<br />
1<br />
C 44 H 51 O 24 963.2765 Mathews et al. (2003) bd<br />
rutinoside-5-O-glucoside<br />
d-Tomatine C 33 H 55 NO 7 577.3979 Friedman et al. (1998) a<br />
g-Tomatine C 39<br />
H 65<br />
NO 12<br />
739.4507 Friedman et al. (1998) a<br />
b-Tomatine C 45 H 75 NO 17 901.5035 Friedman et al. (1998) a<br />
Dehydrotomatine C 50 H 81 NO 21 1,031.5301 Friedman et al. (1994), Kozukue and Friedman (2003)<br />
a-Tomatine C 50<br />
H 83<br />
NO 21<br />
1,033.5458 Juvik et al. (1982), Willker and Leibfritz (1992) c , Friedman et al. (1994),<br />
Yahara et al. (1996), Friedman et al. (1997), Friedman et al. (1998),<br />
Friedman (2002), Bianco et al. (2002), Kozukue and Friedman (2003)<br />
Lycoperoside H C 50 H 83 NO 22 1,049.5407 Yahara et al. (1996) c , Yahara et al. (2004) c<br />
Lycoperoside A C 52<br />
H 85<br />
NO 23<br />
1,091.5512 Yahara et al. (1996, 2004) c<br />
Lycoperoside B C 52 H 85 NO 23 1,091.5512 Yahara et al. (1996, 2004) c<br />
Lycoperoside C C 52 H 85 NO 23 1,091.5512 Yahara et al. (1996, 2004) c<br />
Esculeoside B C 56 H 93 NO 28 1,227.5884 Fujiwara et al. (2004) c , Yahara et al. (2004) c<br />
Esculeoside A C 58<br />
H 95<br />
NO 29<br />
1,269.5990 Fujiwara et al. (2003, 2004) c , Yahara et al. (2004) c , Yoshizaki et al. (2005) c<br />
Lycoperoside F C 58 H 95 NO 29 1,269.5990 Yahara et al. (2004) c<br />
Lycoperoside G C 58 H 95 NO 29 1,269.5990 Yahara et al. (2004) c<br />
a Identified after hydrolysis.<br />
b Identified in transgenic tomato plants.<br />
c Identified using NMR data.<br />
d Identified in seedlings.<br />
analyzed over a period of 2 years (.100 samples) were<br />
manually compared for retention time shifts using<br />
some typical tomato compounds (Table II). Within a<br />
single series of analyses, the standard variation was<br />
very small (about 2 s) for all compounds tested.<br />
Between series of analyses over this time period, the<br />
maximum variation was 30 s, with a maximum retention<br />
time window of 1.1 min for naringenin chalcone.<br />
During this prolonged period, LC columns of different<br />
batches were used.<br />
Comparison of Ionization Modes<br />
Since compounds may preferentially ionize in either<br />
positive or negative mode in our LC system, which is<br />
based on a gradient of acetonitrile acidified with formic<br />
acid, we analyzed tomato extracts sequentially in both<br />
modes and compared the absolute mass signal intensities,<br />
expressed in peak heights, of the monoisotopic<br />
parent ions of some identified compounds. Phenolic<br />
acids and their carboxylic acid derivatives ionized better<br />
in negative ionization mode, while flavonoids generated<br />
higher signal intensities in positive ionization<br />
mode (Fig. 2). Nitrogen-containing compounds such as<br />
Phe and some alkaloids ionized better in positive mode,<br />
and were mainly detected as formic acid adducts in<br />
negative mode. These adducts were formed in the<br />
ionization source and were readily recognized in MS/<br />
MS mode from the loss of 46 D (formic acid). A loss of 18<br />
D corresponding to a loss of water was also regularly<br />
observed in negative ionization mode.<br />
Automatic <strong>Mass</strong> Alignment and Exact <strong>Mass</strong> Calculation<br />
First, reproducibility of sample preparation and<br />
subsequent automated extraction and comparison of<br />
mass signal intensities, expressed as peak height using<br />
metAlign software (Bino et al., 2005; Vorst et al., 2005),<br />
was performed on a dataset obtained from LC-MS<br />
analysis of eight replicate extractions of tomato peel.<br />
The retention time correction used by the software to<br />
align all mass signals was, on average, 2.5 s, which is in<br />
accordance to the retention shift observed on manual<br />
inspection of the chromatograms (Table II). The overall<br />
1208 <strong>Plant</strong> Physiol. Vol. 141, 2006
Tomato Fruit Metabolite Database<br />
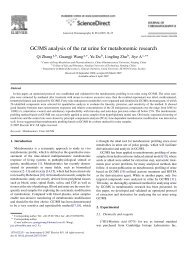
Figure 1. Typical chromatograms<br />
obtained from reversed-phase<br />
LC-PDA-ESI-QTOF-MS analysis of<br />
tomato peel extract. A, Total ion signal<br />
(QTOF MS). B, Absorbance signal<br />
(PDA). Retention times (in minutes)<br />
are indicated for the most intense<br />
peaks (difference between the two<br />
detectors is 0.15 min). Inserts in A<br />
show accurate mass (I) and MS/MS<br />
spectrum (II), and in B absorbance<br />
spectrum (III) obtained for the compound<br />
rutin eluting at 23.3 min.<br />
variation in mass signal intensities between these<br />
replicate samples was ,15%.<br />
Automation of the calculation of the accurate mass<br />
of detected LC-MS signals was tested using a dataset<br />
of 44 tomato extracts obtained from both peel and flesh<br />
tissues analyzed in negative ionization mode. Upon<br />
metAlign-assisted data processing, 4,958 mass signals<br />
with signal-to-noise ratios .3 were extracted. It is<br />
known that exact mass measurements on QTOF instruments<br />
using lock mass correction provide the<br />
highest accuracy at analyte signal intensities that are<br />
similar to the lock mass signal (Colombo et al., 2004).<br />
To establish the dynamic range in signal intensity for<br />
producing high mass accuracy in our TOF MS, the<br />
deviation of manually measured mass (i.e. the mean of<br />
the three top scans of the extracted mass peak) from<br />
the theoretical mass was plotted against the parent<br />
mass signal intensity (ion counts at top scan) for some<br />
known tomato metabolites (Fig. 3). Typically, accurate<br />
mass measurements derived from peak intensities<br />
lower than the lock mass intensity resulted in a positive<br />
deviation from the real mass, while mass measurements<br />
from peak intensities higher than lock mass<br />
intensity resulted in a negative deviation. High mass<br />
accuracies (i.e. mass deviation less than 5 ppm) were<br />
observed within an analyte signal intensity window of<br />
0.25 to 2.0 times the lock mass. Thus, to automatically<br />
calculate correct accurate masses for signals extracted<br />
and aligned by metAlign, a script called metAccure (O.<br />
Vorst, H.A. Verhoeven, C.H.R. de Vos, C.A. Maliepaard,<br />
and R.C.H.J. van Ham, unpublished data) was programmed<br />
to use only those scans with mass signal<br />
intensities within this intensity window. In this way,<br />
appropriate accurate masses were automatically obtained<br />
for 479 (about 10%) of the total mass signals<br />
detected in ESI-negative mode, in which isotopes,<br />
adducts, and fragments are included. This number<br />
indicates that for the majority of extracted mass signals,<br />
though having a chromatographically relevant<br />
signal-to-noise ratio of at least 3, the intensities in the<br />
Table II. Retention time shifts observed during LC-QTOF-MS analysis of tomato fruit<br />
Ret (min), Retention time, in minutes; Av, average; StDev, standard deviation; Wd, retention time window.<br />
Chlorogenic Acid Rutin Naringenin Chalcone<br />
Ret Metabolite<br />
Av StDev Wd Av StDev Wd Av StDev Wd<br />
min<br />
Within series (n 5 13) 14.42 0.03 0.09 23.40 0.04 0.13 41.81 0.03 0.11<br />
In-between series (n 5 6) 14.92 0.33 0.79 23.85 0.50 0.99 42.26 0.50 1.12<br />
<strong>Plant</strong> Physiol. Vol. 141, 2006 1209
Moco et al.<br />
after acid hydrolysis of the extract. All experimental<br />
LC-MS information gathered for these metabolites,<br />
including retention time window, accurate mass, PDA<br />
spectral information, and MS/MS data generated<br />
at different collision energies were added to the<br />
MoTo DB.<br />
Database Building<br />
Figure 2. Peak intensity ratios, in logarithmic scale, of mass signals<br />
(peak height) obtained in positive and negative ionization modes for<br />
some metabolites found in tomato peel extracts.<br />
samples analyzed were too low to estimate properly<br />
their accurate mass, either by automated calculation<br />
through metAccure or by manual calculation.<br />
Identification of Tomato Metabolites<br />
The identification of compounds reported to be<br />
present in tomato fruit was done using two approaches.<br />
First, 19 available standard compounds (see ‘‘Materials<br />
and Methods’’) were injected and compared for<br />
retention time, accurate mass, and UV/Vis spectra<br />
with LC peaks detected in the extracts from the pooled<br />
peel material of the 96 tomato cultivars. In this way,<br />
chlorogenic acid (i.e. 3-caffeoylquinic acid), rutin,<br />
kaempferol-rutinoside, naringenin, naringenin chalcone,<br />
and a-tomatine were identified. Second, the<br />
chromatograms from the 44 LC-MS data sets were<br />
checked for the presence of accurate masses, as calculated<br />
by metAccure, corresponding to metabolites that<br />
were expected to be detected with our system (Table I).<br />
The accurate mass hits were subsequently combined<br />
with PDA and MS/MS fragmentation data for further<br />
identification and confirmation of metabolites. As an<br />
example, data of known tomato metabolites observed<br />
in extracts of the pooled peel material of the 96 tomato<br />
cultivars, derived by LC-PDA-MS and MS/MS analyses<br />
in negative mode, are listed in Table III. In an<br />
analogous way, the presence of anthocyanins was<br />
confirmed by LC-PDA-QTOF-MS/MS analysis (positive<br />
mode) in peel extracts from purple-skin tomato<br />
fruits (data not shown). Using this primarily accurate<br />
mass-directed targeted approach, about 41% (25 compounds)<br />
of the metabolites cited in Table I were<br />
identified in both tomato peel samples. In addition,<br />
caffeic acid, ferulic acid, p-coumaric acid, quercetin,<br />
and kaempferol aglycones could be detected but only<br />
The data from Table I were used as a foundation<br />
upon which to initiate the tomato fruit LC-MS database.<br />
From the molecular formula, the accurate mass<br />
of each component was calculated using the ‘‘Isotopic<br />
compositions of the elements 1997’’ list (Rosman and<br />
Taylor, 1998) for accurate mass assignments. The observed<br />
mass, together with a mass accuracy setting, is<br />
the main search entry for this database (Fig. 4). A<br />
choice on the entry form is provided to enable ionization-specific<br />
correction of mass spectrometer data, to<br />
submit the proper mass value of the uncharged molecule<br />
to the database. <strong>Mass</strong> accuracy can be set from<br />
1 to 1,000 ppm, thus enabling the matching of data<br />
from detectors generating masses with either low or<br />
high accuracy. All other properties of the compounds<br />
are stored in a table, which can be accessed from the<br />
hit list after mass searching. Each hit suggests either a<br />
metabolite previously found in literature and validated<br />
by experimental data (Table III) or a novel<br />
Figure 3. Difference between observed and theoretical monoisotopic<br />
masses, calculated as Dppm (y axis), as a function of the parent ion<br />
signal intensity, expressed as ion counts/scan at center of peak (x axis,<br />
log 10 -transformed data) for some identified compounds in tomato peel<br />
extracts. Threshold levels for mass accuracies between 15 and<br />
25 ppm, and for analyte mass signal intensities between 0.25 and<br />
2.0 times the lock mass signal intensity are indicated with dotted lines.<br />
1210 <strong>Plant</strong> Physiol. Vol. 141, 2006
Tomato Fruit Metabolite Database<br />
Table III. Metabolites that have previously been reported in literature, identified by LC-PDA-ESI-QTOF-MS/MS (negative ionization mode)<br />
in tomato peel extracts<br />
Ret (min), Retention time, in minutes; Av, average; StDev, standard deviation; Av m/z, average found mass signal; UV/Vis, absorbance maximums in<br />
the UV/Vis range; Mol Form, molecular formula of the metabolite; Theo. <strong>Mass</strong>, theoretical monoisotopic mass calculated for the ion (M-H) 2 ; Mean D<br />
(ppm), deviation between the averages of found accurate mass and real accurate mass, in ppm; Putative ID, putative identification of metabolite; () FA,<br />
formic acid adduct; 2, data not found; (S), identification confirmed by the standard compound; I, II, III, IV, V, and VI, different isomers (only one<br />
reported in literature).<br />
Ret<br />
Av m/z UV/Vis MS/MS Fragments Mol Form Theo. <strong>Mass</strong> Mean D Putative ID<br />
Av StDev<br />
min<br />
ppm<br />
9.45 0.09 341.0883 – 179, 135 C 15 H 18 O 9 341.0878 1.52 Caffeic acid-hexose I<br />
9.75 0.08 325.0930 294sh, 313 163 C 15 H 18 O 8 325.0929 0.25 Coumaric acid-hexose I<br />
10.32 0.08 341.0883 310 179, 161, 135 C 15 H 18 O 9 341.0878 1.58 Caffeic acid-hexose II<br />
11.35 0.08 341.0883 302sh, 318 281, 251, 233, 221, C 15<br />
H 18<br />
O 9<br />
341.0878 1.53 Caffeic acid-hexose III<br />
179, 161, 135<br />
12.08 0.06 355.1036 290sh, 313 193, 177, 145 C 16 H 20 O 9 355.1035 0.31 Ferulic acid-hexose I<br />
12.58 0.07 341.0883 – 181, 179, 137, 135 C 15 H 18 O 9 341.0878 1.49 Caffeic acid-hexose IV<br />
13.32 0.05 341.0883 – 281, 221, 181, 179, C 15<br />
H 18<br />
O 9<br />
341.0878 1.39 Caffeic acid-hexose V<br />
161, 137, 135<br />
13.43 0.07 353.0878 300sh, 327 191, 173, 127 C 16 H 18 O 9 353.0878 0.01 3-Caffeoylquinic acid<br />
13.71 0.07 325.0929 285 163, 119 C 15<br />
H 18<br />
O 8<br />
325.0929 0.05 Coumaric acid-hexose II<br />
14.41 0.10 353.0878 295sh, 327 179, 173 C 16 H 18 O 9 353.0878 20.08 5-Caffeoylquinic acid (S)<br />
15.90 0.05 355.1036 – 193, 175, 160 C 16 H 20 O 9 355.1035 0.42 Ferulic acid-hexose II<br />
15.98 0.06 341.0886 – 179 C 15 H 18 O 9 341.0878 2.26 Caffeic acid-hexose VI<br />
16.76 0.07 353.0880 323 191, 173, 161, 127 C 16<br />
H 18<br />
O 9<br />
353.0878 0.49 4-Caffeoylquinic acid<br />
19.53 0.25 1,272.5901 – 1,227, 1,095, 1,065, C 57 H 95 NO 30 1,272.5866 2.75 (Esculeoside B) FA<br />
933, 866, 770<br />
21.42 0.04 741.1870 256, 299sh, 351 301, 271, 255 C 32 H 38 O 20 741.1884 21.82 Quercetin-hexosedeoxyhexose-pentose<br />
22.83 0.06 1,314.6001 – 1,269, 1,137, 1,107,<br />
974, 770, 752<br />
C 59 H 97 NO 31 1,314.5972 2.21 (Lycoperoside G) FA<br />
or (Lycoperoside F)<br />
FA or (Esculeoside A) FA I<br />
23.43 0.04 609.1451 256, 299sh, 355 301, 271, 255 C 27 H 30 O 16 609.1461 21.59 Quercetin-Glc-rhamnose (S)<br />
25.48 0.16 1,314.6005 – 1,269, 1,137, 1,107, 975,<br />
908, 866, 812, 770,<br />
752, 275, 179, 161,<br />
149, 143, 125, 113<br />
26.37 0.21 1,314.6021 – 1,270, 1,138, 1,108, 976,<br />
909, 813, 753, 179,<br />
161, 143, 125, 113<br />
C 59 H 97 NO 31 1,314.5972 2.54 (Lycoperoside G) FA or<br />
(Lycoperoside F) FA<br />
or (Esculeoside A) FA II<br />
C 59 H 97 NO 31 1,314.5972 3.74 (Lycoperoside G) FA or<br />
(Lycoperoside F) FA<br />
or (Esculeoside A) FA III<br />
26.41 0.03 593.1505 368 285 C 27 H 30 O 15 593.1512 21.09 Kaempferol-Glc-rhamnose (S)<br />
26.44 0.39 1,094.5382 – 1,049 C 51 H 85 NO 24 1,094.5389 20.59 (Lycoperoside H) FA<br />
32.46 0.37 1,078.5463 – 1,033, 871, 738, C 51 H 85 NO 23 1,078.5440 2.14 (a-Tomatine) FA (S)<br />
576, 161, 143<br />
32.59 0.22 1,136.5539 – 1,091, 958, 928, 796,<br />
635, 149, 143, 113<br />
C 53 H 87 NO 25 1,136.5494 3.91 (Lycoperoside C) FA<br />
or (Lycoperoside B) FA<br />
or (Lycoperoside A) FA 3<br />
32.65 0.02 433.1135 315sh, 368 271, 151 C 21 H 22 O 10 433.1140 21.21 Naringenin chalcone-hexose I<br />
41.43 0.05 271.0617 288, 303sh 151,119,107 C 15 H 12 O 5 271.0612 1.84 Naringenin (S)<br />
41.86 0.05 271.0615 365 151, 119, 107 C 15 H 12 O 5 271.0612 1.15 Naringenin chalcone (S)<br />
compound (Table IV). Links with the PubChem and<br />
MedLine databases are available for extended, external<br />
searches on particular or related components. The<br />
information for each compound includes molecular<br />
formula, molecular mass, CAS number, IUPAC name,<br />
and analytical properties such as retention time, MS/<br />
MS fragments, and UV/Vis absorbance maxima, when<br />
available. Literature references related to the occurrence<br />
in tomato fruit are also listed. Since our aim is to<br />
provide a compound database with data from literature<br />
and/or experimental MS/MS data, we did not<br />
include unknown or novel compounds that have not<br />
been validated.<br />
Comparison of Metabolic Profiles of Peel<br />
and Flesh Tissues<br />
The applicability of the LC-MS platform and metabolite<br />
database to automatically extract and annotate<br />
(differentially accumulating) mass signals was tested<br />
with red, ripe fruits of tomato cultivar Money Maker.<br />
Since we are interested in the differential distribution<br />
<strong>Plant</strong> Physiol. Vol. 141, 2006 1211
Moco et al.<br />
Figure 4. A, Strategy applied for data analysis and identification of metabolites in tomato fruit, using LC-PDA-QTOF MS.<br />
Key entry into the database is the (intensity-corrected) accurate mass. B, Screenshot from the MoTo database query frame.<br />
Detected masses can be filled in (in this example m/z 609 in negative-ionization mode) and searched against the database at<br />
user-defined mass accuracy (first frame). If at least one mass hit is found in the database, the elemental compositions, deviations<br />
from accurate masses, and IUPAC names of the corresponding metabolites are indicated, as well as links to PubChem, if<br />
applicable, and our own experimental data (second frame). The last frame shows the experimental and literature information<br />
available for the selected compound.<br />
of metabolites and their biochemical pathways between<br />
tomato fruit tissues, peel and flesh material was<br />
separated from whole ripe fruits and analyzed by<br />
LC-PDA-ESI-QTOF-MS in both positive and negative<br />
ion modes.<br />
After automatic peak extraction and alignment of<br />
samples per ionization mode using metAlign, 2,944<br />
mass signals (signal-to-noise ratio .3) were obtained<br />
in negative mode and 4,059 in positive mode. Since<br />
both tissues had similar water content (i.e. flesh: 94%,<br />
peel: 93%; n 5 8; determined by freeze drying), the<br />
intensities of their mass signals were directly comparable.<br />
For each aligned mass peak, the extracts from<br />
both tissues were compared for significant differences<br />
in signal intensity (based on eight extraction repetitions)<br />
using the Student’s t test tool within metAlign.<br />
As expected, the mass profiles of these fruit tissues<br />
were markedly different. About 38% of the total of<br />
mass signals detected were significantly $1.5-fold<br />
higher in the peel extracts than in the flesh extracts<br />
(1,095 signals for negative mode and 1,566 for positive<br />
mode), and about 25% were higher in flesh than in peel<br />
1212 <strong>Plant</strong> Physiol. Vol. 141, 2006
Tomato Fruit Metabolite Database<br />
Table IV. Novel metabolites identified or putatively assigned by LC-PDA-ESI-QTOF-MS/MS in tomato fruit extracts (abbreviations as in Table III)<br />
Ret<br />
Av m/z UV/Vis MS/MS Fragments Mol Form Theo. <strong>Mass</strong> Mean D Putative ID<br />
Av StDev<br />
min<br />
ppm<br />
4.74 0.05 299.0771 251 137 C 13 H 16 O 8 299.0772 20.48 Hydroxybenzoic<br />
acid-hexose<br />
7.42 0.07 380.1558 – 146 C 15 H 27 NO 10 380.1562 21.11 Pantothenic acid-hexose<br />
12.99 0.05 431.1557 – 269, 161, 143, 125, C 19 H 28 O 11 431.1559 20.43 Benzyl alcohol-dihexose<br />
119, 113, 101<br />
14.76 0.05 771.1989 263sh, 351 609, 463, 301 C 33<br />
H 40<br />
O 21<br />
771.1989 20.01 Quercetin-dihexosedeoxyhexose<br />
15.47 0.06 595.1665 – 475, 385, 355 C 27 H 32 O 15 595.1668 20.51 Naringenin chalconedihexose<br />
or Naringenindihexose<br />
15.82 0.04 401.1452 – 293, 269, 233, 191,<br />
161, 149, 131,<br />
C 18 H 26 O 10 401.1453 20.37 Benzyl alcohol-hexosepentose<br />
125, 101<br />
24.77 0.15 1,312.5872 – 1,266, 1,135, 1,105 C 59 H 95 NO 31 1,312.5815 4.33 (Dehydrolycoperoside G)<br />
FA or (Dehydrolycoperoside<br />
F) FA or (Dehydroesculeoside<br />
A) FA<br />
27.05 0.12 515.1193 301sh, 323 353, 335, 191,<br />
C 25 H 24 O 12 515.1195 20.45 Dicaffeoylquinic acid I<br />
179, 173<br />
27.60 0.07 515.1191 301sh, 323 353, 191, 179 C 25 H 24 O 12 515.1195 20.72 Dicaffeoylquinic acid II<br />
29.71 0.07 515.1188 301sh, 327 353, 299, 203, 191,<br />
179, 173, 135<br />
C 25<br />
H 24<br />
O 12<br />
515.1195 21.40 Dicaffeoylquinic acid III<br />
30.11 0.04 887.2246 256, 301sh, 323 741, 723, 301, 271,<br />
255, 179<br />
C 41 H 44 O 22 887.2251 20.57 Quercetin-hexosedeoxyhexose-pentosep-coumaric<br />
acid<br />
32.16 0.03 433.1137 307sh, 360 271, 151 C 21 H 22 O 10 433.1140 20.84 Naringenin chalconehexose<br />
II<br />
38.40 0.08 677.1503 301sh, 327 515 C 34<br />
H 30<br />
O 15<br />
677.1512 21.29 Tricaffeoylquinic acid I<br />
39.78 0.11 677.1493 292sh, 325 515, 353, 335, 179, 173 C 34 H 30 O 15 677.1512 22.82 Tricaffeoylquinic acid II<br />
(794 for negative mode and 880 for positive mode).<br />
Chromatographic mass peaks detected in negative<br />
ionization mode that were significantly different between<br />
the extracts from both tissues are visualized in<br />
Figure 5. Subsequent metAccure-assisted accurate<br />
mass calculation of the differential mass peaks and<br />
searching for analogous masses in the MoTo DB indicated<br />
that flavonoids and derivatives thereof and<br />
a-tomatine were mainly occurring in the peel extracts.<br />
On the other hand, some phenylpropanoids (h, 52-<br />
fold; i, 2-fold) as well as glycosylated steroids such as<br />
glycosylated spirosolanols (j, 130-fold) were significantly<br />
higher in the flesh extracts. An intense mass<br />
signal, k, was solely detected in the extracts from flesh<br />
tissue and could be identified as the parent ion of a<br />
hydroxyfurostanol tetrahexose (e.g. tomatoside A) from<br />
the accurate mass observed ([M-H] 2 5 1,081.5442,<br />
C 51<br />
H 85<br />
O 24 2 , 1.0 ppm difference from theoretical mass)<br />
and its MS/MS fragmentation pattern.<br />
DISCUSSION<br />
Metabolomics is developing as an important functional<br />
genomics tool. Technical improvements in the<br />
large-scale determination of metabolites in complex<br />
plant tissues and dissemination of metabolomics research<br />
data are essential (Sumner et al., 2003; Bino et al.,<br />
2004). A major challenge is to construct consolidated<br />
metabolite libraries and to develop metabolite-specific<br />
data management systems. Here we set out to establish<br />
a reproducible LC-PDA-MS-based metabolomics<br />
platform including a LC-MS metabolite database and<br />
mass-directed searching tools for a commonly used<br />
plant material, i.e. tomato fruit.<br />
An in-depth literature study was performed to<br />
obtain as much information as possible on metabolites<br />
previously detected in tomato fruits. Because tomato is<br />
an important crop, numerous analytical studies aimed<br />
at identifying its constituents have been performed.<br />
However, a number of problems arise when building<br />
such a database from the literature. First, finding the<br />
exact identity of a specific natural compound can be<br />
troublesome since common names or non-IUPAC nomenclatures<br />
are often used. Second, studies performed<br />
without MS or NMR technologies might lead to questioning<br />
the validity of at least some of the assigned<br />
compounds. Third, it is known that using harsh conditions<br />
during sample preparation may produce artifacts,<br />
which can result in the correct identification, but<br />
of a compound not occurring in the original biological<br />
sample. For instance, it has long been thought that the<br />
flavanone naringenin instead of naringenin chalcone<br />
was the main tomato flavonoid (Krause and Galensa,<br />
1992). This is probably due to unforeseen cyclization of<br />
<strong>Plant</strong> Physiol. Vol. 141, 2006 1213
Moco et al.<br />
Figure 5. Unbiased LC-QTOF MS-based comparative<br />
profiling of aqueous-methanol extracts from peel<br />
and flesh tissues from ripe tomato fruit (var. Moneymaker).<br />
<strong>Mass</strong> chromatograms (m/z 100–1,500) were<br />
acquired in ESI-negative mode. Retention times (in<br />
minutes) and nominal masses of the most intense<br />
signals are indicated in the chromatograms (plotted<br />
as base peak intensities [BPI], from 4–50 min). A,<br />
Representative original chromatogram of peel tissue.<br />
B, Representative original chromatogram of flesh<br />
tissue. C, Differential chromatogram for metabolites<br />
that are significantly (P , 0.05; n 5 8 extracts) at least<br />
1.5-fold higher in extracts from peel compared to<br />
flesh tissue (peaks pointing upwards) or higher in<br />
extracts from flesh compared to peel tissue (peaks<br />
pointing downwards). a, Coumaric acid-hexose II; b,<br />
quercetin-hexose-deoxyhexose-pentose; c, rutin; d,<br />
kaempferol-hexose-deoxyhexose-pentose or quercetin-dideoxyhexose-pentose;<br />
e, a-tomatine; f, naringenin;<br />
g, naringenin chalcone; h, caffeic acid-hexose<br />
II; i, 3-caffeoylquinic acid; j, spirosolanol-trihexose;<br />
and k, hydroxyfurastanol tetrahexoside.<br />
the chalcone to the corresponding flavanone during<br />
sample preparation and compound isolation. Likewise,<br />
some of the metabolites reported in literature<br />
have been identified after an enzymatic or chemical<br />
hydrolysis step. In the nonhydrolyzed tomato peel<br />
extract we exclusively found a range of glycosylated<br />
forms of caffeic acid, coumaric acids, and the flavonols<br />
quercetin and kaempferol, while the corresponding<br />
aglycones were only detectable after acid hydrolysis of<br />
the same sample.<br />
The amount of information obtained by a single<br />
LC-QTOF MS analysis can be extensive and the use of<br />
dedicated software for data processing and comparison<br />
is crucial. The extraction of relevant mass signals<br />
and the subsequent alignment of chromatograms were<br />
performed using metAlign (Vorst et al., 2005). An<br />
average of 2 s variation within series of analyses and<br />
30 s between analyses over a 2-year time period is an<br />
indication of high chromatographic reproducibility.<br />
These retention time shifts are sufficiently low to align<br />
correctly and thus compare samples when analyzed<br />
under the same chromatographic conditions. Variation<br />
in metabolite retention is a known and common obstacle<br />
in LC and thus important to take into account<br />
when searching LC-MS-based databases for comparable<br />
masses. Representative retention times and<br />
retention indexes of unknown mass peaks relative to<br />
tomato key compounds, such as rutin, chlorogenic<br />
acid, and naringenin, can be of use when comparing<br />
data generated by different LC systems or with a<br />
different type of C 18<br />
-reversed-phase column.<br />
MetAccure (O. Vorst, H.A. Verhoeven, C.H.R. de Vos,<br />
C.A. Maliepaard, and R.C.H.J. van Ham, unpublished<br />
data) is an important tool for automated accurate mass<br />
1214 <strong>Plant</strong> Physiol. Vol. 141, 2006
Tomato Fruit Metabolite Database<br />
calculation of all aligned mass signals from the<br />
metAlign output. Within a specific range of mass signal<br />
intensities (depending on the specificities of the<br />
TOF MS and lock mass intensity used), the metAccureassisted<br />
accurate mass calculations enabled the assignment<br />
of compounds. By calculating the average of<br />
all detected accurate masses of a certain aligned mass<br />
peak over all samples analyzed (taking into account<br />
only those scans with the correct range of ion intensities),<br />
high mass accuracies were obtained, i.e., frequently<br />
within 1 ppm and, in all cases, within 4 ppm<br />
deviation from the predicted mass (Table III). Apparently,<br />
this high mass accuracy was consistent over<br />
the entire mass range analyzed (mass-to-charge ratio<br />
[m/z] 100–1,500; accuracies better than 3 ppm were<br />
obtained for metabolites at both low [e.g. 271.0615<br />
for naringenin chalcone] and high m/z values [e.g.<br />
1,314.6005 for the formic acid adducts of the possible<br />
isomers lycoperoside G or F or esculeoside A]. With<br />
the QTOF instrument used, the metAccure script was<br />
able to generate appropriate accurate masses for about<br />
10% of the total mass peaks detected in ESI-negative<br />
mode. Evidently, this percentage is highly dependent<br />
on the dynamic range of accurate mass measurements<br />
of the mass spectrometer used, as well as on the<br />
concentrations of each metabolite in the samples analyzed.<br />
By changing the lock mass-to-analyte ratio in<br />
successive analyses of the same sample it should be<br />
possible, in principle, to obtain accurate mass data for<br />
a wider range of amplitudes, leading to an expansion<br />
of the dynamic range.<br />
The identification of compounds, in particular secondary<br />
metabolites, through a metabolomic profiling<br />
approach encounters some major difficulties. First, the<br />
number of commercially available standards of secondary<br />
metabolites reported to be present in a specific<br />
plant species or tissue is low. Second, in an automated<br />
online separation, PDA detection, MS measurement,<br />
and/or MS/MS fragmentation of mass signals, it is<br />
difficult to meet optimized levels for all eluting compounds.<br />
Due to overlapping compounds, low intensity<br />
mass signals, or difficulties in the isolation of the<br />
mass signal for MS/MS fragmentation, the extraction<br />
of usable information for identification purposes can<br />
be complicated. Third, the lack of dedicated software<br />
and databases that integrate spectroscopic and MS<br />
data limits the identification procedure to a manual<br />
level. Nevertheless, by these means 43 metabolites<br />
could be readily assigned in the tomato fruit extract<br />
(Tables III and IV), leaving more to be identified. The<br />
total number of compounds detectable by our LC-MS<br />
system is difficult to calculate due to the presence of<br />
mass signals from isotopes, adducts, and unintended<br />
in-source fragmentation. Using the strategy demonstrated<br />
in this study, the assignment of compounds lies<br />
on the integration of different sources of information<br />
(accurate mass, retention time, fragmentation pattern,<br />
and UV/Vis spectra). In addition to experimental data,<br />
previous findings and biochemical evidence can complement<br />
certain putative assignments.<br />
In the MoTo DB we established searching tools to<br />
link an observed mass in LC-MS chromatograms to the<br />
putative tomato metabolite, through calculating the<br />
exact monoisotopic mass of each metabolite for both<br />
positive and negative ionization modes. Identifications<br />
can be validated using the retention time intervals,<br />
PDA spectra, and MS/MS data so far available.<br />
The link with external databases allows searching for<br />
similar molecules from other sources.<br />
Some compounds reported in literature appear to<br />
occur more than once in our chromatograms, e.g.<br />
p-coumaroylhexoside, caffeoylhexoside, and naringenin<br />
chalcone-hexoside (Table III). Apparently, these<br />
metabolites can exist as different constitutional isomers<br />
in tomato fruit. The position and/or nature of the<br />
sugar substitution can influence the polarity and therefore<br />
the retention time of the compound. From the<br />
literature it is often unclear which particular isomer is<br />
mentioned. Three chromatographic peaks corresponding<br />
to caffeoylquinic acids were found. According to<br />
previous studies with comparable analytical systems<br />
(Clifford et al., 2003), the order of elution is likely<br />
5-caffeoylquinic acid, followed by 3-caffeoylquinic<br />
acid, and then 4-caffeoylquinic acid (Table III).<br />
Applying the same data analysis strategy, novel<br />
derivatives of phenolic acids and flavonoids were putatively<br />
assigned and information on the level of their<br />
identification are presented (Table IV). Dicaffeoylquinic<br />
acid (three isomers) and tricaffeoylquinic acid (two<br />
isomers) were identified in tomato, and novel glycosides<br />
of naringenin, naringenin chalcone, and quercetin<br />
were detected. The chromatographic separation of several<br />
isomers of coumaroyl- and caffeoylhexosides, of<br />
which only one has previously been described, also<br />
indicates the high resolution power of our LC-MS set<br />
up. MS/MS fragmentation can sometimes distinguish<br />
between constitutional isomers, however in most cases<br />
other approaches such as NMR will have to be<br />
performed to unravel the complete and exact structure<br />
of novel compounds. These NMR studies are part of<br />
our future activities in tomato metabolomics. Ideally,<br />
the combination of LC/MS/NMR should be performed<br />
for the unambiguous structure elucidation of<br />
metabolites (Exarchou et al., 2003; Sumner et al., 2003;<br />
Wolfender et al., 2003). Organizing all such analytical<br />
data into a single database will facilitate the identification<br />
of compounds and will further improve the<br />
quality and quantity of compound annotation through<br />
database searching.<br />
By making use of the MoTo DB and the LC-PDA-MS<br />
platforms established, extracts from two tissues in<br />
tomato fruit, peel and flesh, were compared for relative<br />
differences in LC-MS signals in an untargeted<br />
manner (Fig. 5). As was expected from previous experiments<br />
(e.g. Muir et al., 2001; Bovy et al., 2002) most<br />
of the flavonoid species and their glycosides were<br />
detected in the extracts of peel tissue, while in the flesh<br />
extracts these compounds were hardly or not detectable<br />
at all. The specific accumulation of flavonoids<br />
in peel is in accordance with the idea that these<br />
<strong>Plant</strong> Physiol. Vol. 141, 2006 1215
Moco et al.<br />
compounds play a role in the protection against stress,<br />
for example by UV light (Winkel-Shirley, 2002). On the<br />
other hand, by using this untargeted approach it became<br />
clear that tomato flesh contains markedly higher<br />
amounts of, among many still unknown metabolites,<br />
specific phenolic compounds such as caffeoylhexose II<br />
and 3-caffeoylquinic acid, as well as glycosylated alkaloids<br />
of the spirosolanol type. A compound uniquely<br />
present in the extracts from flesh tissue was identified<br />
as a hydroxyfurostanol tetrahexose, which might correspond<br />
to tomatoside A (Schelochkova et al., 1980).<br />
This molecule has a brassinosteroid-like structure and<br />
is structurally related to spirosolanes. Recently, highly<br />
active biosynthesis of brassinosteroids has been found<br />
in developing tomato fruits (Montoya et al., 2005). As<br />
yet, neither the biological functions nor the mechanisms<br />
underlying the specific accumulation of these<br />
phenolic acids and glycosylated spirosolanols in the<br />
flesh of the fruit are known. Clearly, further research<br />
into the differential distribution of (secondary) metabolites<br />
between peel and flesh tissues of tomato fruit, by<br />
analyzing these tissues from fruits from several cultivars,<br />
may provide novel information on tissue-specific<br />
regulation of biochemical pathways.<br />
CONCLUSION<br />
The maturation of metabolomics as the next cornerstone<br />
of functional genomics ultimately depends on the<br />
establishment of databases (Sumner et al., 2003; Bino<br />
et al., 2004). However, at the moment there are no<br />
effective database tools to query and/or comprehensively<br />
mine LC-MS-based plant metabolomics data<br />
through automated database search engines. The generation<br />
of such tools depends on the availability of<br />
metabolite databases that can be trusted and for which<br />
the source of data and its history are maintained and<br />
made publicly accessible. Here we present the first step<br />
to implement such an open access metabolite database,<br />
the MoTo DB dedicated to tomato, which intends to<br />
systematize metabolite LC-MS, MS/MS, and absorbance<br />
spectra information for common knowledge. The<br />
next step is to utilize the validated metabolomic information<br />
to study the dynamics of the metabolome, to<br />
elucidate mutants and gene functions based on differential<br />
metabolic profiles, and to decipher the biological<br />
relevance of each metabolite. The combination of information<br />
from other omics technologies can lead to a<br />
wider view on the systems biology of the plant studied.<br />
As a result, the integration of databases from these<br />
different disciplines will be inevitable.<br />
MATERIALS AND METHODS<br />
<strong>Plant</strong> Material<br />
A large pool of tomato (Lycopersicum esculentum, now Solanum lycopersicum)<br />
fruit material was prepared by combining fruits from turning, pink, and red<br />
ripe stages of development of 96 different tomato cultivars representing the<br />
three major types of tomato fruits (i.e. cherry, Dutch beef, and normal round<br />
tomatoes). These plants were grown in an environmentally controlled greenhouse<br />
located in Wageningen, The Netherlands, during the summer and<br />
autumn of 2003. <strong>Plant</strong>s were grown in rock wool plugs connected to an<br />
automatic irrigation system comparable to standard commercial cultivation<br />
conditions. For analysis of anthocyanins, purple-colored fruits from offspring<br />
of a crossing of two natural mutants, Af 3 hp-2 j (van Tuinen et al., 2005), were<br />
harvested at the ripe stage of development. Peel (about 2 mm thickness) was<br />
removed from fruits, ground into a fine powder in liquid nitrogen, and stored<br />
at 280°C until further analysis. For metabolite profile comparison of peel and<br />
flesh, red ripe fruits of cultivar Money Maker were used of which peel (2 mm<br />
thickness) and flesh (rest of fruit) were separated and used as described.<br />
Extraction<br />
Of the frozen tomato powder, 0.5 g fresh weight was weighed and<br />
extracted with 1.5 mL pure methanol (final methanol concentration in the<br />
extract approximately 75%). Hydrolyzed extracts were prepared by sequentially<br />
adding 1 mL of 0.1% tert-butylhydroquinone in methanol solution and<br />
0.4 mL of HCl 6 M to 0.6 g fresh weight tomato material, shaking in a water<br />
bath at 90°C to95°C for 1 h, and adding 2 mL of methanol (Bovy et al., 2002).<br />
All samples were sonicated for 15 min, filtered through a 0.2 mm inorganic<br />
membrane filter (Anotop 10, Whatman), and analyzed.<br />
Chemicals<br />
Standard compounds p-coumaric acid, protocatechuic acid, salicylic acid,<br />
caffeic acid, ferulic acid, cinnamic acid, myricetin, and naringenin were<br />
purchased from ICN; p-hydroxybenzoic acid, chlorogenic acid quercetin,<br />
Phe, sinapic acid, and a-tomatine from Sigma; vanillic acid and rutin (quercetin-3-O-rutinoside)<br />
from Acros; naringenin chalcone from Apin Chemicals,<br />
kaempferol and kaempferol-3-O-rutinoside from Extrasynthese; and tertbutylhydroquinone<br />
from Aldrich. Acetonitrile HPLC supragradient and methanol<br />
absolute HPLC supragradient were obtained from Biosolve. Formic acid<br />
for synthesis 98% to 100% was from Merck-Schuchardt, HCl 37% for analysis<br />
from Acros, and ultrapure water was obtained from an Elga Maxima purification<br />
unit (Bucks). Leucine enkaphaline was purchased from Sigma.<br />
Chromatographic Conditions<br />
HPLC was carried out using a Waters Alliance 2795 HT system with a<br />
column oven. For chromatographic separation, a Luna C18(2) precolumn<br />
(2.0 3 4 mm) and analytical column (2.0 3 150 mm, 100 Å, particle size 3 mm)<br />
from Phenomenex were used. Five microliters of sample was injected into the<br />
system for LC-PDA-MS analysis. Degassed solutions of formic acid:ultrapure<br />
water (1:10 3 , v/v; eluent A) and formic acid:acetonitrile (1:10 3 , v/v; eluent B)<br />
were pumped at 0.19 mL min 21 into the HPLC system. The gradient applied<br />
started at 5% B and increased linearly to 35% B in 45 min. Then, for 15 min the<br />
column was washed and equilibrated before the next injection. The column<br />
temperature was kept at 40°C and the samples at 20°C. The room temperature<br />
was maintained at 20°C.<br />
Detection of Metabolites by PDA and MS<br />
The HPLC system was connected online to a Waters 2996 PDA detector, set<br />
to acquire data every second from 240 to 600 nm with a resolution of 4.8 nm,<br />
and subsequently to a QTOF Ultima V4.00.00 mass spectrometer (Waters-<br />
Corporation, MS technologies). An ESI source working either in positive or<br />
negative ion mode was used for all MS analyses. Before each series of<br />
analyses, the mass spectrometer was calibrated using phosphoric acid:acetonitrile:water<br />
(1:10 3 :10 3 , v/v) solution. Capillary voltage, collision energy, and<br />
desolvation temperature were optimized to obtain a series of phosphoric acid<br />
clusters suitable for calibration between m/z 80 and 1,500. During sample<br />
analyses, the capillary voltage was set to 2.75 kV and the cone at 35 V. Source<br />
and desolvation temperatures were set to 120°C and 250°C, respectively. Cone<br />
gas and desolvation gas flows were 50 and 500 Lh 21 , respectively. In the<br />
positive ion mode, the collision energy was 5 eV while in the negative ion<br />
mode it was 10 eV. Resolution was set at 10,000 and during calibration the MS<br />
parameters were adjusted to achieve such a resolution.<br />
TOF-MS data were acquired in centroid mode. During LC-MS analyses<br />
scan durations of 0.9 s and an interscan time of 0.1 s were used. For LC-MS/<br />
MS measurements, 10 mL of sample was injected into the system and MS/MS<br />
measurements were made with 0.40 s of scan duration and 0.10 s of interscan<br />
1216 <strong>Plant</strong> Physiol. Vol. 141, 2006
Tomato Fruit Metabolite Database<br />
delay with increasing collision energies according to the following program:<br />
5 (ESI positive) or 10 (ESI negative), 15, 30, and 50 eV.<br />
A lockspray source was equipped with the mass spectrometer allowing<br />
online mass correction to obtain high mass accuracy of analytes. Leucine<br />
enkephalin, [M1H] 1 5 556.2766 and [M-H] 2 5 554.2620, was used as a lock<br />
mass, being continuously sprayed into a second ESI source using an LKB<br />
Bromma 2150 HPLC pump, and sampled every 10 s, producing an average<br />
intensity of 500 counts/scan in centroid mode (approximately 100 count/scan<br />
in continuum mode).<br />
Data Analysis and Alignment<br />
Acquisition of LC-PDA-MS data was performed under <strong>Mass</strong>Lynx 4.0<br />
(Waters). <strong>Mass</strong>Lynx was used for visualization and manual processing of<br />
LC-PDA-MS/MS data. <strong>Mass</strong> data were automatically processed by metAlign<br />
version 1.0 (www.metalign.nl). MetAlign transforms accurate masses into<br />
nominal masses to shorten the calculation time and minimize the number of<br />
mass bins. Baseline and noise calculations were performed from scan number<br />
225 to 2,475, corresponding to retention times 4.0 min to 49.3 min. The<br />
maximum amplitude was set to 15,000 and peaks below three times the local<br />
noise were discarded. The .csv file output containing nominal mass peak<br />
intensity data (peak heights, i.e. ion counts/scan at the center of the peak) at<br />
aligned retention times (scans) over all samples processed was used for further<br />
data processing. A script called metAccure was used for the calculation of<br />
accurate masses from the metAlign-extracted peaks. MetAccure calculates the<br />
accurate mass, using only those scans in which signal intensities are within a<br />
user-defined window relative to the lock mass intensity of each mass signal<br />
using the .csv files containing retention time alignments, originating from<br />
metAlign analysis, in combination with the original data in NetCDF format,<br />
created from <strong>Mass</strong>Lynx.raw files by Dbridge (O. Vorst, H.A. Verhoeven, C.H.R.<br />
de Vos, C.A. Maliepaard, and R.C.H.J. van Ham, unpublished data). Comparison<br />
of extracts from peel and flesh tissues for significant differences in intensity<br />
of each aligned mass signal was made using the t-student statistical tool within<br />
metAlign (level of significance set at 0.05). The settings for baseline corrections<br />
and signal alignment were analogous to those described above.<br />
Annotation of Metabolites<br />
Datasets obtained after metAlign and metAccure treatment were analyzed<br />
as (retention time 3 accurate mass 3 peak intensity) matrixes for metabolite<br />
identification. [M1H] 1 and [M-H] 2 values were calculated for metabolites<br />
present in Table I and used for sorting with the matrixes. Data collected during<br />
the first 4.0 min of chromatography were discarded. Novel metabolites were<br />
identified by calculating the elemental composition from accurate mass measurements<br />
using the <strong>Mass</strong>Lynx software. The tolerance was set at 5 ppm, taking<br />
into account the correct analyte-lock mass signal ratio. For an observed accurate<br />
mass, a list of possible molecular formulas was obtained, selected for the<br />
presence of C, H, O, and N. In addition, raw datasets were checked manually in<br />
<strong>Mass</strong>Lynx for retention time, UV/Vis spectra, and QTOF-MS/MS fragmentation<br />
patterns for chromatographically separated peaks, complementing the<br />
accurate mass-based elemental formulas. The combination of accurate mass<br />
data, retention time (as an indication of polarity), UV/Vis spectra, and MS/MS<br />
data allowed a putative identification of metabolites. Best matches were<br />
searched in the Dictionary of Natural Products and SciFinder databases for<br />
possible structures. The putative identifications were confirmed by published<br />
data and with standard compounds, if commercially available.<br />
MoTo DB Buildup<br />
Based on available literature information about compounds identified in tomato,<br />
information acquired from LC-PDA-MS analysis of tomato fruit was used to validate<br />
each metabolite: (1) a retention time; (2) accurate mass in the form of<br />
monoisotopic mass (neutral) and in the ion forms (M1H) 1 and (M-H) 2 ; (3) elemental<br />
compositions; (4) MS/MS fragments; and (5) maximum absorbance peaks in<br />
UV/Vis. Given a found mass and a Dppm (or DmD) that is set by the user, the<br />
database can find possible matches. Formic acid, if detected, was also included in the<br />
database. The database is implemented in MySQL and running on a Linux cluster.<br />
ACKNOWLEDGMENTS<br />
We kindly thank Arjen Lommen for providing the software for LC-MS<br />
data analysis, Sjef Boeren for assistance in some of the MS/MS measurements,<br />
Ageeth van Tuinen for providing the anthocyanin-rich tomatoes, and<br />
Robert Hall and Sacco de Vries for carefully reading the manuscript. We<br />
thank Roeland van Ham and Velitchka Mihaleva for their useful comments<br />
during the construction of the database. We are also grateful to Syngenta<br />
Seeds, Seminis, Enza Zaden, Rijk Zwaan, Nickerson-Zwaan, and De Ruiter<br />
Seeds for providing the seeds of the 96 tomato cultivars.<br />
Received February 1, 2006; revised May 8, 2006; accepted May 9, 2006;<br />
published August 8, 2006.<br />
LITERATURE CITED<br />
Bianco G, Schmitt-Kopplin P, De Benedetto G, Kettrup A, Cataldi TR<br />
(2002) Determination of glycoalkaloids and relative aglycones by nonaqueous<br />
capillary electrophoresis coupled with electrospray ionizationion<br />
trap mass spectrometry. Electrophoresis 23: 2904–2912<br />
Bino RJ, de Vos CHR, Lieberman M, Hall RD, Bovy A, Jonker HH,<br />
Tikunov Y, Lommen A, Moco S, Levin I (2005) The light-hyperresponsive<br />
high pigment-2 dg mutation of tomato: alterations in the fruit<br />
metabolome. New Phytol 166: 427–438<br />
Bino RJ, Hall RD, Fiehn O, Kopka J, Saito K, Draper J, Nikolau BJ,<br />
Mendes P, Roessner-Tunali U, Beale MH, et al (2004) Potential of<br />
metabolomics as a functional genomics tool. Trends <strong>Plant</strong> Sci 9: 418–425<br />
Bovy A, de Vos CHR, Kemper M, Schijlen E, Almenar Pertejo M, Muir S,<br />
Collins G, Robinson S, Verhoeyen M, Hughes S, et al (2002) Highflavonol<br />
tomatoes resulting from the heterologous expression of the<br />
maize transcription factor genes LC and C1. <strong>Plant</strong> Cell 14: 2509–2526<br />
Buta JG, Spaulding DW (1997) Endogenous levels of phenolics in tomato<br />
fruit during growth and maturation. J <strong>Plant</strong> Growth Regul 16: 43–46<br />
Clifford MN, Johnston KL, Knight S, Kuhnert N (2003) Hierarchical<br />
scheme for LC-MS n identification of chlorogenic acids. J Agric Food<br />
Chem 51: 2900–2911<br />
Colombo M, Sirtori FR, Rizzo V (2004) A fully automated method for<br />
accurate mass determination using high-performance liquid chromatography<br />
with a quadrupole/orthogonal acceleration time-of-flight<br />
mass spectrometer. Rapid Commun <strong>Mass</strong> Spectrom 18: 511–517<br />
Crozier A, Lean MEJ, McDonald MS, Black C (1997) Quantitative analysis<br />
of the flavonoid content of commercial tomatoes, onions, lettuce, and<br />
celery. J Agric Food Chem 45: 590–595<br />
Dixon RA, Strack D (2003) Phytochemistry meets genome analysis, and<br />
beyond. Phytochemistry 62: 815–816<br />
Exarchou V, Godejohann M, van Beek TA, Gerothanassis IP, Vervoort J<br />
(2003) LC-UV-solid-phase extraction-NMR-MS combined with a cryogenic<br />
flow probe and its application to the identification of compounds<br />
present in Greek oregano. Anal Chem 75: 6288–6294<br />
Fleuriet A, Macheix JJ (1977) Effect des blessures sur les composés<br />
phénoliques des fruits de tomates cerise (Lycopersicum esculentum<br />
var. cerasiforme). Physiol Veg 15: 239–250<br />
Fleuriet A, Macheix J-J (1981) Quinyl esters and glucose derivatives of<br />
hydroxycinnamic acids during growth and ripening of tomato fruit.<br />
Phytochemistry 20: 667–671<br />
Friedman M (2002) Tomato glycoalkaloids: role in the plant and in the diet.<br />
J Agric Food Chem 50: 5751–5780<br />
Friedman M, Kozukue N, Harden LA (1997) Structure of the tomato<br />
glycoalkaloid tomatidenol-3-beta-lycotetraose (dehydrotomatine). J Agric<br />
Food Chem 45: 1541–1547<br />
Friedman M, Kozukue N, Harden LA (1998) Preparation and characterization<br />
of acid hydrolysis products of the tomato glycoalkaloid alphatomatine.<br />
J Agric Food Chem 46: 2096–2101<br />
Friedman M, Levin CE, Mcdonald GM (1994) a-Tomatine determination in<br />
tomatoes by HPLC using pulsed amperometric detection. J Agric Food<br />
Chem 42: 1959–1964<br />
Fujiwara Y, Takaki A, Uehara Y, Ikeda T, Okawa M, Yamauchi K, Ono M,<br />
Yoshimitsu H, Nohara T (2004) Tomato steroidal alkaloid glycosides,<br />
esculeosides A and B, from ripe fruits. Tetrahedron 60: 4915–4920<br />
Fujiwara Y, Yahara S, Ikeda T, Ono M, Nohara T (2003) Cytotoxic major<br />
saponin from tomato fruits. Chem Pharm Bull (Tokyo) 51: 234–235<br />
Hertog MGL, Hollman PCH, Katan MB (1992) Content of potentially<br />
anticarcinogenic flavonoids of 28 vegetables and 9 fruits commonly<br />
consumed in the Netherlands. J Agric Food Chem 40: 2379–2383<br />
Hunt GM, Baker EA (1980) Phenolic constituents of tomato fruit cuticles.<br />
Phytochemistry 19: 1415–1419<br />
<strong>Plant</strong> Physiol. Vol. 141, 2006 1217
Moco et al.<br />
Jones CM, Mes P, Myers JR (2003) Characterization and inheritance of the<br />
Anthocyanin fruit (Aft) tomato. J Hered 94: 449–456<br />
Justesen U, Knuthsen P, Leth T (1998) Quantitative analysis of flavonols,<br />
flavones, and flavanones in fruits, vegetables and beverages by highperformance<br />
liquid chromatography with photo-diode array and mass<br />
spectrometric detection. J Chromatogr A 799: 101–110<br />
Juvik JA, Stevens MA, Rick CM (1982) Survey of the genus Lycopersicon<br />
for variability in alpha-tomatine content. HortScience 17: 764–766<br />
Kozukue N, Friedman M (2003) Tomatine, chlorophyll, beta-carotene and<br />
lycopene content in tomatoes during growth and maturation. J Sci Food<br />
Agric 83: 195–200<br />
Krause M, Galensa R (1992) Determination of naringenin and naringeninchalcone<br />
in tomato skins by reversed phase HPLC after solid-phase<br />
extraction. Z Lebensm Unters Forsch 194: 29–32<br />
Le Gall G, Colquhoun IJ, Davis AL, Collins GJ, Verhoeyen ME (2003a)<br />
Metabolite profiling of tomato (Lycopersicon esculentum) using 1 HNMR<br />
spectroscopy as a tool to detect potential unintended effects following a<br />
genetic modification. J Agric Food Chem 51: 2447–2456<br />
Le Gall G, DuPont MS, Mellon FA, Davis AL, Collins GJ, Verhoeyen ME,<br />
Colquhoun IJ (2003b) Characterization and content of flavonoid glycosides<br />
in genetically modified tomato (Lycopersicon esculentum) fruits.<br />
JAgricFoodChem51: 2438–2446<br />
Martinez-Valverde I, Periago MJ, Provan G, Chesson A (2002) Phenolic<br />
compounds, lycopene and antioxidant activity in commercial varieties<br />
of tomato (Lycopersicum esculentum). J Sci Food Agric 82: 323–330<br />
Mathews H, Clendennen SK, Caldwell CG, Liu XL, Connors K, Matheis N,<br />
Schuster DK, Menasco DJ, Wagoner W, Lightner J, et al (2003) Activation<br />
tagging in tomato identifies a transcriptional regulator of anthocyanin<br />
biosynthesis, modification, and transport. <strong>Plant</strong> Cell 15: 1689–1703<br />
Mattila P, Kumpulainen J (2002) Determination of free and total phenolic<br />
acids in plant-derived foods by HPLC with diode-array detection.<br />
JAgricFoodChem50: 3660–3667<br />
Minoggio M, Bramati L, Simonetti P, Gardana C, Iemoli L, Santangelo E,<br />
Mauri PL, Spigno P, Soressi GP, Pietta PG (2003) Polyphenol pattern<br />
and antioxidant activity of different tomato lines and cultivars. Ann<br />
Nutr Metab 47: 64–69<br />
MontoyaT,NomuraT,YokotaT,FarrarK,HarrisonK,JonesJG,KanetaT,<br />
Kamiya Y, Szekeres M, Bishop GJ (2005) Patterns of Dwarf expression<br />
and brassinosteroid accumulation in tomato reveal the importance of<br />
brassinosteroid synthesis during fruit development. <strong>Plant</strong> J 42: 262–269<br />
MuirSR,CollinsGJ,RobinsonS,HughesS,BovyA,DeVosCHR,van<br />
Tunen AJ, Verhoeyen ME (2001) Overexpression of petunia chalcone<br />
isomerase in tomato results in fruit containing increased levels of<br />
flavonols. Nat Biotechnol 19: 470–474<br />
Petró-Turza M (1987) Flavor of tomato and tomato products. Food Rev Int<br />
2: 309–351<br />
Raffo A, Leonardi C, Fogliano V, Ambrosino P, Salucci M, Gennaro L,<br />
Bugianesi R, Giuffrida F, Quaglia G (2002) Nutritional value of cherry<br />
tomatoes (Lycopersicon esculentum cv. Naomi F1) harvested at different<br />
ripening stages. J Agric Food Chem 50: 6550–6556<br />
Reschke A, Herrmann K (1982) Vorkommen von 1-O-hydroxycinnamylb-D-glucosen<br />
im gemüse. 1. Phenolcarbonsäure-verbindungen des<br />
gemüses. Z Lebensm-Unters-Forsch 174: 5–8<br />
Rosman KJR, Taylor PDP (1998) Isotopic compositions of the elements<br />
1997. Pure Appl Chem 70: 217–235<br />
Sakakibara H, Honda Y, Nakagawa S, Ashida H, Kanazawa K (2003)<br />
Simultaneous determination of all polyphenols in vegetables, fruits, and<br />
teas. J Agric Food Chem 51: 571–581<br />
Schauer N, Steinhauser D, Strelkov S, Schomburg D, Allison G, Moritz T,<br />
Lundgren K, Roessner-Tunali U, Forbes MG, Willmitzer L, et al (2005)<br />
GC-MS libraries for the rapid identification of metabolites in complex<br />
biological samples. FEBS Lett 579: 1332–1337<br />
Schmidtlein H, Herrmann K (1975) Über die phenolsäuren des gemüses.<br />
II. Hydroxyzimtsäuren und hydroxybenzoesäuren der frucht- und<br />
samengemüsearten. Z Lebensm Unters Forsch 159: 213–218<br />
Schelochkova AP, Vollerner JS, Koshoev KK (1980) Tomatoside A from<br />
Licopersicum esculentum seeds. Khim Prir Soedin 4: 533–540<br />
Stewart AJ, Bozonnet S, Mullen W, Jenkins GI, Lean MEJ, Crozier A<br />
(2000) Occurrence of flavonols in tomatoes and tomato-based products.<br />
JAgricFoodChem48: 2663–2669<br />
Sumner LW, Mendes P, Dixon RA (2003) <strong>Plant</strong> metabolomics: largescale<br />
phytochemistry in the functional genomics era. Phytochemistry<br />
62: 817–836<br />
Tikunov Y, Lommen A, de Vos CHR, Verhoeven HA, Bino RJ, Hall RD,<br />
Bovy AG (2005) A novel approach for nontargeted data analysis for<br />
metabolomics: large-scale profiling of tomato fruit volatiles. <strong>Plant</strong><br />
Physiol 139: 1125–1137<br />
Tokusoglu O, Unal MK, Yildirim Z (2003) HPLC-UV and GC-MS characterization<br />
of the flavonol aglycons quercetin, kaempferol, and myricetin<br />
in tomato pastes and other tomato-based products. Acta Chromatogr<br />
13: 196–207<br />
van Tuinen A, de Vos CHR, Hall RD, van der Plas LHW, Bowler C,<br />
Bino RJ (2005) Use of metabolomics for development of tomato<br />
mutants with enhanced nutritional value by exploiting natural non-<br />
GMO light-hyperresponsive mutants. In P Jaiwal, ed, <strong>Plant</strong> Genetic<br />
Engineering: Improvement of the Nutritional and the Therapeutic<br />
Qualities of <strong>Plant</strong>s. Agritech Publications/Agricell Report, Shrub<br />
Oak, NY<br />
von Roepenack-Lahaye E, Degenkolb T, Zerjeski M, Franz M, Roth U,<br />
Wessjohann L, Schmidt J, Scheel D, Clemens S (2004) Profiling of<br />
Arabidopsis secondary metabolites by capillary liquid chromatography<br />
coupled to electrospray ionization quadrupole time-of-flight mass<br />
spectrometry. <strong>Plant</strong> Physiol 134: 548–559<br />
Vorst O, de Vos CHR, Lommen A, Staps RV, Visser RGF, Bino RJ, Hall RD<br />
(2005) A non-directed approach to the differential analysis of multiple<br />
LC-MS derived metabolic profiles. Metabolomics 1: 169–180<br />
Willker W, Leibfritz D (1992) Complete assignment and conformational<br />
studies of tomatine and tomatidine. Magn Reson Chem 30:<br />
645–650<br />
Winkel-Shirley B (2002) Biosynthesis of flavonoids and effects of stress.<br />
Curr Opin <strong>Plant</strong> Biol 5: 218–223<br />
Winter M, Herrmann K (1986) Esters and glucosides of hydroxycinnamic<br />
acids in vegetables. J Agric Food Chem 34: 616–620<br />
Wolfender JL, Ndjoko K, Hostettmann K (2003) <strong>Liquid</strong> chromatography<br />
with ultraviolet absorbance-mass spectrometric detection and with<br />
nuclear magnetic resonance spectroscopy: a powerful combination for<br />
the on-line structural investigation of plant metabolites. J Chromatogr A<br />
1000: 437–455<br />
Yahara S, Uda N, Nohara T (1996) Lycoperosides A-C, three stereoisomeric<br />
23-acetoxyspirosolan-3 beta-ol beta-lycotetraosides from Lycopersicon<br />
esculentum. Phytochemistry 42: 169–172<br />
Yahara S, Uda N, Yoshio E, Yae E (2004) Steroidal alkaloid glycosides from<br />
tomato (Lycopersicon esculentum). J Nat Prod 67: 500–502<br />
Yoshizaki M, Matsushita S, Fujiwara Y, Ikeda T, Ono M, Nohara T (2005)<br />
Tomato new sapogenols, isoesculeogenin A and esculeogenin B. Chem<br />
Pharm Bull (Tokyo) 53: 839–840<br />
1218 <strong>Plant</strong> Physiol. Vol. 141, 2006