What Goes Up Must Come Down: - Eco-Logica
What Goes Up Must Come Down: - Eco-Logica
What Goes Up Must Come Down: - Eco-Logica

You also want an ePaper? Increase the reach of your titles
YUMPU automatically turns print PDFs into web optimized ePapers that Google loves.
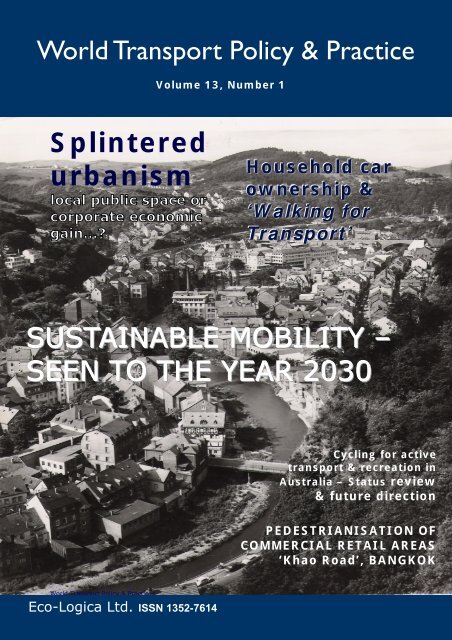
World Transport Policy & Practice<br />
Volume 13, Number 1<br />
Splintered<br />
urbanism<br />
local public space or<br />
corporate economic<br />
gain…?<br />
Household car<br />
ownership &<br />
‘Walking for<br />
Transport’<br />
SUSTAINABLE MOBILITY –<br />
SEEN TO THE YEAR 2030<br />
Cycling for active<br />
transport & recreation in<br />
Australia – Status review<br />
& future direction<br />
PEDESTRIANISATION OF<br />
COMMERCIAL RETAIL AREAS<br />
‘Khao Road’, BANGKOK<br />
World Transport Policy & Practice_______________________________________________________<br />
Volume 13. Number 1. September 2006<br />
<strong>Eco</strong>-<strong>Logica</strong> Ltd. ISSN 1352-7614<br />
1
World Transport Policy & Practice<br />
Volume 13, Number 1<br />
© 2006 <strong>Eco</strong>-<strong>Logica</strong> Ltd.<br />
Editor<br />
Professor John Whitelegg<br />
Stockholm Environment Institute at York, Department of<br />
Biology, University of York, P.O. Box 373, York, YO10 5YW,<br />
U.K<br />
Editorial Board<br />
Eric Britton<br />
Managing Director, <strong>Eco</strong>Plan International, The Centre for<br />
Technology & Systems Studies, 8/10 rue Joseph Bara, F-<br />
75006 Paris, FRANCE<br />
Professor John Howe<br />
Independent Transport Consultant, Oxford, U.K<br />
Mikel Murga<br />
Leber Planificacion e Ingenieria, S.A., Apartado 79, 48930-<br />
Las Arenas, Bizkaia, SPAIN<br />
Paul Tranter<br />
School of Physical Environmental & Mathematical Sciences,<br />
University of New South Wales, Australian Defence Force<br />
Academy, Canberra ACT 2600, AUSTRALIA<br />
Publisher<br />
<strong>Eco</strong>-<strong>Logica</strong> Ltd., 53 Derwent Road, Lancaster, LA1 3ES, U.K<br />
Telephone: +44 (0)1524 63175<br />
E-mail: j.whitelegg@btinternet.com<br />
http://www.eco-logica.co.uk/WTPPhome.html<br />
____________________________________________________________________________________________________________<br />
Contents<br />
Editorial 3<br />
John Whitelegg<br />
Abstracts & Keywords 5<br />
<strong>What</strong> goes up must come down: Household car ownership and ‘Walking for transport’ 7<br />
Hazel Baslington<br />
Trends, innovative course settings and levers for mobility & transport: 18<br />
Seen to the year 2030<br />
Hartmut H. Topp<br />
Splintering the public realm: using local public space for corporate economic gain? 31<br />
Fiona Raje<br />
Effects of pedestrianisation on the commercial and retail areas: study in Kha San Road, Bangkok 38<br />
Santhosh Kumar K., William Ross<br />
Cycling for active transport and recreation in Australia: status review and future directions 51<br />
Rissel C, Garrard J<br />
Travel in Inner City versus Urban Fringe of Adelaide: the Role of Neighbourhood Design 64<br />
Soltani A, Allan A, Sommenhalli S, Primerano F<br />
World Transport Policy & Practice_______________________________________________________<br />
Volume 13. Number 1. September 2006<br />
2
Editorial<br />
At an international conference on walking in<br />
Melbourne, Australia on October 24 th 2006, a<br />
large and eager audience sat patiently waiting<br />
for the Minister of Transport of the State of<br />
Victoria to give his opening address. He did not<br />
turn up, and his absence sends a very strong<br />
message indeed to all those who work very hard<br />
to make the glaringly obvious point that walking<br />
is transport, walking is important and walking is<br />
central to everything from tackling obesity and<br />
climate change to creating high quality liveable<br />
cities. Ministers of transport tend to turn up at<br />
conferences devoted to private finance initiatives<br />
and highway construction. They will always turn<br />
up to share the limelight about transport plans<br />
related to Commonwealth and Olympic games,<br />
but walking is off the radar screen and is easily<br />
replaced by something more important even if it<br />
has been in the minister’s diary for several<br />
months.<br />
Australia is at the serious end of most transport,<br />
land use, energy and health and resource use<br />
problems. Its high levels of car use, even for<br />
short distance trips, makes it especially<br />
vulnerable to the peak oil problem and the<br />
refusal of its politicians to take sustainable<br />
transport seriously is a major obstacle to<br />
progress. Highway projects loom very large in<br />
the in-tray of ministers of transport.<br />
The city of Brisbane in Australia has decided to<br />
build a central area tunnel at a cost of over $3<br />
billion (Australian). The tunnel will end up<br />
costing far more than this and will be followed<br />
by many other high cost highway infrastructure<br />
projects. Brisbane’s approach to transport policy<br />
is not especially unusual but does bring into<br />
sharp relief the contradictions that lie at the<br />
heart of urban transport throughout the world.<br />
Brisbane is also the location of the selfproclaimed<br />
“largest travel smart project in the<br />
world”, and this project will work diligently to<br />
persuade people not to use the car. The<br />
combined highway projects and Travel Smart<br />
projects amount to a $10 billion plan to<br />
encourage car use and a $30 million plan to<br />
discourage car use. This is silly and looks<br />
especially silly when put in the context of the<br />
world-class physical environment of Brisbane<br />
and its enormously attractive walking and<br />
cycling possibilities. Brisbane has 1% of all trips<br />
currently accomplished by bike and about 80-<br />
85% by car. It is a car dependent city that is<br />
rushing headlong into higher levels of car<br />
dependency at a time when peak oil and oil<br />
dependency concerns are ringing alarm bells<br />
around the world. Car dependent and fossil fuel<br />
dependent cities like Brisbane are heading for a<br />
social and economic crisis because they cannot<br />
see the wisdom and precautionarity of moving to<br />
lower levels of oil dependency. Brisbane could<br />
easily have 10% of all trips by bike, 10-20% on<br />
foot and 15-20% on public transport but there is<br />
very little sign of the vision and clarity of<br />
thought that could produce this outcome.<br />
Sweden on the other hand has declared its<br />
intention to become fossil fuel free by 2020<br />
(‘Making Sweden an OIL FREE Society’,<br />
Commission on Oil Independence, 21 st June<br />
2006) This policy links well with its “Vision Zero”<br />
road safety policy which was introduced in 1997<br />
and commits the country to achieving zero<br />
deaths and zero serious injuries in the road<br />
traffic environment. This remarkable double-hit<br />
will ensure that Sweden maintains a high quality<br />
World Transport Policy & Practice_______________________________________________________<br />
Volume 13. Number 1. September 2006<br />
3
of life and an exceptional degree of insulation<br />
from global oil supply problems and price<br />
increases. Australian citizens will find<br />
themselves living in a polar opposite world<br />
characterised by oil supply crises and prices of<br />
more than $100 per barrel. This is unnecessary<br />
and Australia has the experience and the people<br />
to deliver a revolution in mobility. It simply lacks<br />
politicians with the vision and clarity of thought<br />
to recognise that reducing car dependency is a<br />
win-win situation with hard monetary and<br />
security benefits that range across obesity,<br />
diabetes, mental health, reduced fiscal demands<br />
for roads, bridges and tunnels and reduced<br />
greenhouse gases.<br />
rise to the challenge of system-wide reengineering<br />
to restore civilisation, calm, peace<br />
and community richness to our cities.<br />
This challenge will involve setting maximum<br />
speed limits of 30kph in all cities and banning<br />
through-traffic from residential streets. It will<br />
mean reversing almost 100 years of car<br />
domination and returning streets and cities to<br />
people. It will mean that we pursue<br />
interventions of whatever kind that protect<br />
children, the elderly and the mobility<br />
disadvantaged, and we no longer tolerate noisy,<br />
intrusive traffic near our homes and in our<br />
communities. It can be done and it will be done.<br />
At the international walking conference almost<br />
400 people gathered to discuss best practice<br />
and to assess the multiple advantages of<br />
increasing walking and all modes of sustainable<br />
transport. The majority of the participants were<br />
Australian and there can be no doubt that if<br />
these people could be given a few months to<br />
sort out walking, cycling, health and urban<br />
design and planning in Australia then all these<br />
problems would be resolved.<br />
It is increasingly clear that politicians are out of<br />
step with the needs and requirements of the age<br />
in which we live and that a major paradigm shift<br />
is needed to deliver urgent action on climate<br />
change, transport-related health problems, cities<br />
drowning in car pollution, children damaged by<br />
noise and deeply traumatised communities. A<br />
radical shift towards walking, cycling, and public<br />
transport and traffic reduction will deliver a huge<br />
part of the solution to all these problems and<br />
will create happier citizens.<br />
John Whitelegg<br />
Editor<br />
Melbourne, Australia<br />
24 th October 2006<br />
Making Sweden an OIL FREE Society<br />
Commission on Oil Independence 21 st June 2006<br />
http://www.sweden.gov.se/content/1/c6/06/70/<br />
96/7f04f437.pdf<br />
Walk21 - Walking Forward in the 21 st Century<br />
http://www.walk21.com<br />
This is the major challenge of the 21 st century<br />
and we will succeed. The 19 th century saw major<br />
world cities installing pure drinking water<br />
systems on a huge scale. The 20 th century saw<br />
the elimination of the dreaded and dreadful<br />
sulphurous yellow smog that plagued London<br />
and all major UK cites and we must once again<br />
World Transport Policy & Practice_______________________________________________________<br />
Volume 13. Number 1. September 2006<br />
4
Abstracts & Keywords<br />
<strong>What</strong> <strong>Goes</strong> <strong>Up</strong> <strong>Must</strong> <strong>Come</strong> <strong>Down</strong>:<br />
Household Car Ownership and 'Walking for Transport'<br />
Hazel Baslington<br />
This paper reports research investigating the<br />
cultural determinants of childrens' travel. The<br />
'diary sets' kept by 301 children linked travel<br />
with time spent on physical activity over one<br />
week. Parents completed a travel and<br />
exercise questionnaire (n=136) and some<br />
were interviewed (n=22). Car use for regular<br />
journeys and time spent walking is<br />
associated with the number of cars in<br />
households. Availability of a car can reduce<br />
walking for transport but may facilitate other<br />
exercise. Possession of two/more cars<br />
extends socio-economic and geographical<br />
boundaries. A bold policy measure advocated<br />
is a 'one car' policy for households.<br />
Keywords:<br />
Childrens' travel, mixed method design,<br />
walking for transport, multi-car ownership,<br />
'one car' policy<br />
Trends, innovative course settings, and levers for mobility and transport<br />
Seen from the Year 2030<br />
Hartmut H. Topp<br />
We need innovative policies to shape the<br />
future of mobility and transport. Sustainable<br />
mobility in terms of ecology, economy and<br />
social justice is the goal, even though<br />
sustainability is poorly defined in the field of<br />
mobility and transport, and, at the same<br />
time, inflationarily used. Technical<br />
innovations in transport are often discussed,<br />
but we also need economic innovations,<br />
political innovations, social innovations, as<br />
well as, behavioural changes, because<br />
sustainable mobility can only be achieved by<br />
a broad range of measurements. We need<br />
new policies and innovative course settings,<br />
because laissez-faire cause undesirable<br />
developments, such as wasting fossil energy,<br />
climate changes and natural disasters<br />
through global warming, dead-end street of<br />
automobile dependency, urban sprawl<br />
resulting in high costs, unaffordable public<br />
transport in rural areas, macro-economic<br />
losses through congestion, environmental<br />
and health damage ... The list could be<br />
continued.<br />
Keywords: Technical/economic, social<br />
innovation, behavioural change, sustainable<br />
mobility<br />
Splintering the public realm: using local public space for corporate economic gain?<br />
Fiona Raje<br />
This paper provides an example of how<br />
conflicts between transport and planning<br />
policy and practice can manifest themselves<br />
in local communities. It discusses the<br />
building of a gated community on a deprived<br />
urban peripheral estate in Oxford and the<br />
dichotomy between policy statements about<br />
promoting social inclusion and the granting<br />
of permission to construct a socially-isolating<br />
housing development within one of the city’s<br />
most deprived neighbourhoods.<br />
Key words<br />
Gated communities, splintered urbanism,<br />
transport policy<br />
World Transport Policy & Practice_______________________________________________________<br />
Volume 13.1 September 2006
Effects of pedestrianisation on the commercial and retail areas:<br />
Study in Khao San Road, Bangkok<br />
Santhosh Kumar. K, William Ross<br />
Pedestrianisation of retail areas is a strategy<br />
commonly implemented in city centres. It<br />
has various impacts on the traffic speed and<br />
increases the quality of life for the people<br />
living, working and visiting the area of<br />
implementation. In addition, it also has an<br />
impact on the commercial and retail<br />
businesses in the area of implementation.<br />
The current study focussed on determining<br />
the effect of pedestrianisation on the retail<br />
and commercial businesses of Khao San<br />
Road, Bangkok. The results of this study<br />
were in line with earlier studies undertaken<br />
in various other cities. Qualitative research<br />
methods were used in this study and the<br />
results showed that business owners<br />
reported an increase of sales volume since<br />
pedestrianisation and all respondents<br />
reported a noticeable increase in the<br />
liveability of the area. The study<br />
recommends that the implementing<br />
authorities undertake similar projects in<br />
retail and commercial areas throughout<br />
Bangkok to boost the sales volume and<br />
increase the liveability of the area.<br />
Keywords<br />
Pedestrianisation, Retailing, Liveability,<br />
Commercial areas, Khao San Road, Bangkok<br />
Cycling for active transport and recreation in Australia: status review and future<br />
directions<br />
Rissel C, Garrard J<br />
Riding a bicycle is a potentially important but<br />
neglected form of sustainable transport that<br />
can also contribute to achieving adequate<br />
levels of physical activity. Despite the clear<br />
health and environmental benefits of cycling,<br />
there has been no systematic review of<br />
strategies to increase or promote cycling in<br />
Australia, nor any consideration of a health<br />
promotion research agenda for cycling.<br />
This paper reviews the available Australian<br />
published and grey literature reporting<br />
evaluation of strategies to increase or<br />
promote cycling (n=17). It identifies the<br />
prevalence of cycling in Australia from a<br />
range of sources, synthesises the main<br />
influences on cycling, reviews the little<br />
available evidence of effectiveness of<br />
strategies to increase or promote cycling,<br />
and identifies research priorities.<br />
This review has highlighted the relatively low<br />
level of regular cycling for transport in<br />
Australia, and the marked gender disparity of<br />
riders. However, cycling is a very popular<br />
recreational activity (fourth most popular<br />
nationally), suggesting that under favourable<br />
conditions some of these riders could<br />
substitute short car trips for bicycle trips.<br />
Almost all of the identified cycling promotion<br />
program evaluations have shown some<br />
degree of increase in cycling, suggesting that<br />
if they were to be implemented on a wider<br />
scale and with adequate resources they<br />
would lead to increases in population levels<br />
of regular cycling. A number of suggestions<br />
are made for cycling related research in<br />
Australia.<br />
Keywords:<br />
Cycling promotion programmes, strategy<br />
evaluation, cycling research<br />
World Transport Policy & Practice_______________________________________________________<br />
Volume 13.1 September 2006
Travel in Inner City versus Urban Fringe of Adelaide:<br />
The Role of Neighbourhood Design<br />
Soltani A, Allan A, Somenahalli S, Primerano F<br />
Previous literature has found that suburban<br />
development is associated with the<br />
unbalanced choice of travel mode. The<br />
micro-scale aspects of the built environment<br />
that influence modal choice, however, have<br />
not been well-established. Furthermore, the<br />
majority of the literature is from North<br />
American or European cities, thereby less<br />
Australian context. Using a sample from<br />
Adelaide, this research looked at the<br />
connection between neighbourhood design<br />
and modal choice, classifying the sample into<br />
two low-density, growing outer-ring suburbs<br />
versus two suburbs selected for their higher<br />
density, stability, and inner-ring location.<br />
Statistical analyses showed that<br />
neighbourhood design has a strong<br />
association with modal choice. Specifically,<br />
traditional neighbourhood designs are<br />
correlated with the choice of non-motorised<br />
modes, while suburban designs are<br />
associated with the choices of car<br />
driver/passenger. The multinomial logit<br />
models suggest that micro-scale urban form<br />
factors play an important role, and that<br />
travel time and commute distance also<br />
impact modal choice along with a number of<br />
social factors such as income level,<br />
employment and family structure. This study,<br />
therefore, supports the assertion that land<br />
use policies have at least some potential to<br />
reduce the choice of private vehicles, thereby<br />
reducing car dependency. This study also<br />
may serve to assist other practitioners in<br />
Adelaide in their efforts to address the issue<br />
of induce travel, and to present better<br />
solutions for sustainability concerns.<br />
Keywords: Travel; land use; multinomial logit model; Adelaide<br />
World Transport Policy & Practice_______________________________________________________<br />
Volume 13.1 September 2006
<strong>Must</strong> <strong>Come</strong> <strong>Down</strong>:<br />
<strong>What</strong> goes up must come down:<br />
Household Car Ownership and 'Walking for Transport'<br />
Hazel Baslington<br />
This paper reports findings from a PhD<br />
project investigating the cultural<br />
determinants of childrens' travel (Baslington,<br />
2006). The research was in part replicatory<br />
and in part exploratory. Previous research<br />
revealed that childrens' school travel<br />
behaviour varied according to level of car<br />
ownership in household, for instance,<br />
(Roberts, Carlin, et al 1997, Davis, 1998,<br />
Mackett, 2002). Additional analysis on this<br />
variable investigated nonschool trips, short<br />
car journeys and time spent walking. The<br />
'diary sets' kept by 301 children linked travel<br />
with time spent on physical activity over one<br />
week. Parents completed a travel and<br />
exercise questionnaire (n=136) and some<br />
were interviewed (n=22).<br />
Sample Composition, Children<br />
The children were aged 9 to 11 (Years 5/6)<br />
and attended eight primary schools in West<br />
Yorkshire, in 2003. Six schools are in urban<br />
areas, one a rural and another, a semi-rural<br />
district. Ninety percent of pupils lived<br />
approximately 1.13 kilometres (three<br />
quarters of a mile) from school. An indication<br />
of socio-economic status is provided by the<br />
Indices of Deprivation (ID 2000 was the<br />
index used in the fieldwork), identified from<br />
school postcodes. This ranks English districts<br />
between '1' and '8,414' on an ascending<br />
scale. Rank 1 is bottom and ten percent of<br />
districts are considered 'very deprived' (rated<br />
ID 841 or lower). Ward level data from six<br />
indices are used: income, employment,<br />
health deprivation, housing, education,<br />
training and access to services. The ID<br />
ratings are: Schools 1, 6, 7 (ID 4,518,<br />
4,547); School 3 (5,672); Schools 4, 5<br />
(3,378, 3,775); Schools 2, 8 (247, 298).<br />
Schools 2 and 8 are in 'very deprived'<br />
districts, included to obtain a cross-section of<br />
respondents.<br />
Diary sets were completed by 301 children<br />
(53% response rate) by equal proportions of<br />
both sexes. They contained three colour<br />
coded sections: a One Week Travel Diary<br />
(TD) an Out of School, Sports & Exercise<br />
Diary (SED), a questionnaire. The TDs<br />
comprised a one page matrix with ample<br />
space to show trips: 'To/From' school, 'To<br />
See and Go Out with Friends' and 'Other'<br />
journeys. Children inserted daily travel<br />
mode/s, destination/s and journey times<br />
(minutes). The SED was identical to TDs<br />
except children showed time spent daily on<br />
physical activity with divisions for 'Sport and<br />
Exercise', 'Active Play/Street Games', 'Other<br />
walking' (Walking or cycling not shown as<br />
transport on the TD). 'Other cycling', 'Other<br />
Ways to be Active', such as<br />
housework/gardening. Examples were<br />
provided as well as open questions, 'Another<br />
Sport/Exercise…'? Demographic details<br />
collected were: age, sex, household car<br />
ownership and postcode. Diary sets included<br />
a yellow instruction sheet and were tied and<br />
protected with plastic covers. To increase<br />
motivation children were awarded a<br />
laminated 'Certificate of Appreciation' and a<br />
decorative sticker.<br />
Sample Composition, Parents<br />
Children took home a request letter to<br />
parents requesting participation. To obtain a<br />
sizeable sample a further seven schools (five<br />
state and two privately run) in a cross-<br />
World Transport Policy & Practice_______________________________________________________<br />
Volume 13.1 September 2006<br />
8
section of districts in another West Yorkshire<br />
town were contacted in Winter 2003/4. The<br />
parents completed a short Parents' Travel &<br />
Exercise Questionnaire (PTEQ n=136, 11%<br />
response rate). A sample of children whose<br />
parents completed the PTEQ (all schools,<br />
n=121) were used to check the accuracy of<br />
childrens' responses to the question, "Does<br />
your family have a car? Count all types of<br />
car or van". A Cronbach Alpha coefficient, ά<br />
= .97, revealed a high level of concurrence.<br />
Twenty two parents were interviewed (20<br />
female, 2 male). Nineteen had interviews at<br />
home and three in private offices. The<br />
duration ranged from 30/35 minutes (n=6),<br />
40/45 (n=13), 50/60 (n=3) Although selfselected,<br />
the sample represented a crosssection<br />
by age, family size (including six<br />
single parents), socio-economic status, travel<br />
mode behaviour. Of the 22: four were from<br />
'0 car' households; seven '1 car'; ten '2 car'<br />
and one had '6 cars'. A breakdown by ID is:<br />
one parent (ID 6,163); three (5,017); five<br />
(4547, 4,518); four (3,378); one (2,069);<br />
two (1,841, 1,070); five (ID
households (Kruskal Wallis Test, chi-square<br />
.564 p
Table 3: Children from <strong>Eco</strong>nomically Deprived Districts:<br />
Walk to School, 4/5 Days by Cars in Household<br />
Walk to School<br />
4/5 Days<br />
No Car One Car Two Car Three<br />
/More<br />
Total<br />
No 4<br />
(27%)<br />
17<br />
(47%)<br />
14<br />
(61%)<br />
Yes 11<br />
19<br />
9<br />
(73%) (53%) (39%)<br />
Total 15 36 (100%) 23<br />
(100%)<br />
(100%)<br />
Percentages rounded to nearest 1%<br />
23<br />
(89%)<br />
3<br />
(11%)<br />
26<br />
(100%)<br />
58<br />
(58%)<br />
42<br />
(42%)<br />
100<br />
(100%)<br />
Similar proportions of children in these<br />
districts walk to see 'Friends' but there<br />
are highly significant differences for<br />
journeys to 'other' places (χ 2 22.001<br />
p
The distribution for time spent walking for<br />
the sample of children who reside in 'no car'<br />
households was normal (Kolmogorov-<br />
Smirnov test .461 p
significant differences in the proportions of<br />
car travellers according to number of cars in<br />
household (χ 2 30.718, p
(Interview No.21: One car, single parent<br />
household)<br />
Several interviewees remarked on their<br />
decreased usage of public transport since<br />
becoming a two car household:<br />
Q. "Do your children normally<br />
travel with you when you go on the bus?<br />
A. Yeah. It would be a bit of an<br />
adventure now, going on a bus, wouldn't it?<br />
(looks at child). Because we used to go<br />
everywhere on buses"<br />
(Interview No.3: 'two car' household for<br />
three years)<br />
The 22 parents were asked if they liked<br />
walking and about acceptable distances. For<br />
some this depended on the context,<br />
separating walking for transport (to local<br />
shops or school) with recreational walking,<br />
for pleasure or exercise. The desire to walk<br />
or the distance did not depend on car<br />
ownership levels. Two of the four 'no car'<br />
interviewees walked only when necessary:<br />
Q. "Do you like Walking?<br />
A. I don't like it – I do it, but I<br />
wouldn't say I like it"<br />
(Interview No.12: 'no car' household,<br />
interviewee's emphasis)<br />
Discussion: Number of Cars in Household,<br />
Travel Mode and Habit Forming Behaviour<br />
A pervasive finding is the strong link<br />
between the amount of car usage and the<br />
'number of cars in households' (it is also<br />
associated with attitudes towards cars,<br />
public buses and childrens’ future<br />
aspirations learning to drive own car<br />
(Baslington 2006)). It is the independent<br />
variable on regular journeys as well as<br />
childrens' short car journeys. Although the<br />
PTEQ sample was self-selected, the findings<br />
mirrored a national sample of school<br />
escorters as well as a sample of employees<br />
from the general population. The<br />
pervasiveness of car usage by mothers in<br />
households with two/more cars suggests a<br />
habit forming relationship signified by the<br />
gradient which cuts across car ownership<br />
categories in cross tabulations. Those of<br />
more recent second car ownership were<br />
conscious of behavioural change in relation<br />
to amount of walking and diminished use of<br />
public transport. Goodwin (1995) concludes<br />
that car dependence is a process not a<br />
state. Justifications for escorting children by<br />
car are based on social, psychological and<br />
economic variables: safety: 'stranger<br />
danger' or busy roads, time pressure, peer<br />
pressure, convenience, the weather, cost,<br />
all of which are tangible reasons. These<br />
explain peoples' needs, but not the greater<br />
usage of cars in multi-car households. Do<br />
these parents feel more threatened by<br />
'stranger danger’? Do they have less time<br />
than others? Fear of strangers or busy<br />
roads is reason for parental accompaniment<br />
of children but does not explain car use for<br />
this purpose, except if the parent<br />
themselves feels threatened. Time pressure<br />
because of employment is an important<br />
factor, but nationally, the numbers involved<br />
are surprising. A picture of 'trip chaining'<br />
and school escort is provided by the DfT:<br />
57% of women and 53% of men return<br />
straight home in the morning (DfT, 2005).<br />
Of the 43% who 'trip chain' only 18% of<br />
female escorters, (17% of male) continue<br />
on to employment. Shift work or part-time<br />
employment may be explanatory, but<br />
interestingly, the unemployed in two/more<br />
car households use the same mode as the<br />
employed. Housewives have time<br />
pressures; they may be full-time carers<br />
with toddlers or elderly relatives. However,<br />
this also applies to housewives from 'no car'<br />
or 'one car' households' but unemployment<br />
appears to provide the incentive for these<br />
to walk. Distance travelled did not have a<br />
bearing, 90% lived approximately 1.13<br />
World Transport Policy & Practice________________________________________________________<br />
Volume 13.1 September 2006<br />
14
kilometres (three quarters of a mile) from<br />
school – close enough to walk.<br />
An issue of cause and effect arises: does<br />
the availability of an extra car/s increase<br />
car dependency or do those who lack<br />
fervour for walking, ensure ample supply of<br />
cars to avoid it? The findings from<br />
interviews suggest car availability increases<br />
dependency, but some cases of the latter<br />
are likely to exist. The interview sample<br />
contained two parents from 'no car'<br />
households who did not like it and they<br />
probably have counterparts in the car<br />
owning community. A difference is the<br />
latter can afford a car to avoid walking!<br />
This does not mean that those from 'no car'<br />
households are fitter. A high proportion of<br />
car owners used them for transport to<br />
sports centres and elsewhere for exercise.<br />
This is the likeliest explanation for the<br />
similarities in childrens' and parents' total<br />
physical activity levels across all categories<br />
of car ownership. Availability of a car can<br />
reduce walking for transport but may<br />
facilitate other exercise.<br />
Interestingly, some households in<br />
economically deprived districts have access<br />
to several cars. One explanation is quality<br />
of car, owning older or smaller vehicles. Of<br />
those in the lowest income group, 46%<br />
have cars over ten years old (DfT, 2003).<br />
The cost of new and secondhand cars has<br />
decreased and although petrol prices have<br />
risen, the running costs of vehicles have<br />
risen less than the cost of living since 1980<br />
(Hibbs, 2000). Access to a 'company car' is<br />
possible for skilled, semi and unskilled<br />
manual workers such as builders and taxi<br />
drivers. An older sibling/s may run a car<br />
increasing the availability. An economic<br />
factor may have a bearing on car usage.<br />
Two/more car families have a greater<br />
financial commitment. If they are running<br />
two cars – why not get full use from them?<br />
The nature of the PTEQ sample prevents<br />
some generalisations, parents in London<br />
use public transport more. As parents, the<br />
interviewees differ from the population of<br />
single adults. Further investigation on<br />
parental and non-parental populations using<br />
random samples of both sexes and couples<br />
without children is planned.<br />
Transport and Recreational Walking<br />
Children from 'no car' households spent<br />
more time walking because of limited<br />
access to cars. It is not known if the<br />
distributions for 'time spent walking' by<br />
children in car owning sub samples are<br />
representative. However, other researchers<br />
of childrens' travel have found dichotomous<br />
differences between 'car owning' and 'noncar<br />
owning' households. These are most<br />
noticeable in the statistics when the number<br />
of cars is '0-1', compared with '2-4' car<br />
households. Davis (1998) concluded that<br />
people in 'non-car' owning households walk<br />
50% more on average, quoting NTS data.<br />
Recent findings from the NTS show the gap<br />
has widened: "Those people living in a<br />
household with a car walk less than two<br />
thirds as far as those in a household<br />
without a car” (DfT, 2005, Table 2.12). The<br />
NTS travel diary excludes walking off the<br />
public highway therefore recreational<br />
walking is unlikely to be shown. However,<br />
Table 2.12 DfT (2005) is compiled from<br />
responses to an interview question which<br />
asks about any walks of 20 minutes or<br />
more, on or off the public highway<br />
therefore comparisons are useful. Weinstein<br />
and Schimek (2005) stress the need for<br />
improved data collection of pedestrian<br />
travel. The American equivalent of the NTS<br />
fails to capture all walk trips. Their analysis<br />
by number of cars highlighted that<br />
transport walking is related to car<br />
ownership level whereas recreational<br />
World Transport Policy & Practice________________________________________________________<br />
Volume 13.1 September 2006<br />
15
walking is not. A finding of Ross (2000) was<br />
that residents of economically deprived<br />
neighbourhoods are more likely to walk<br />
than those in less disadvantaged places.<br />
Van Lenthe, Brug and Mackenbach (2005)<br />
also found that those who resided in the<br />
most economically deprived areas of a city<br />
in the Netherlands were more likely to walk<br />
for transport reasons but less likely to walk<br />
or participate in sport in their leisure time.<br />
Possession of a car appeared to be<br />
associated with an increased risk of almost<br />
never walking or cycling to shops or work.<br />
Bostock (2001) found that 'no access to a<br />
car' is an indicator of low socio-economic<br />
status and also of having to walk to places<br />
because of necessity, not pleasure.<br />
Defining 'Car Dependency' Conceptual<br />
Differences<br />
There are conceptual differences in the<br />
usage of the expression, 'car dependency'<br />
by academics. It is applied to describe<br />
differences between individuals regarding<br />
reliance on car transportation. A proposition<br />
of Goodwin (1997) is that "People<br />
differ"(p.454) and he notes the wide<br />
variation of 'car dependence' in adults.<br />
People as individuals increase their use of<br />
cars, relying on them more and more.<br />
Goodwin also discusses the term in relation<br />
to social changes such as land use and<br />
provision of services which make people<br />
dependent on cars as a society. Brindle<br />
(2003) discusses 'car dependency' with<br />
reference to the social situation. He argues<br />
that the car is a means to an end. If there<br />
is an addiction, (implied by the word<br />
'dependency'), it is not to cars, but to<br />
mobility. It is "the mobility demands of our<br />
lifestyle and consumption patterns within<br />
the context of the physical, social and<br />
economic environment that we live in"<br />
(p.65). The author identified differences in<br />
travel mode behaviour and attitude<br />
between groups of parents (mainly female)<br />
and children by number of cars in<br />
household. It is known that for one type of<br />
journey, school escort, the travel distances<br />
were very similar for most, therefore the<br />
fact of car ownership had independent<br />
effects to the social situation. Other findings<br />
for non-school journeys and short car trips<br />
strongly suggest that the number of cars in<br />
a household is a determinant on an<br />
individual's degree of car dependency.<br />
Deterring Multi-Car Ownership<br />
The definition of a problem has implications<br />
for tackling it. A contention of the author is<br />
that transport and social policies need to<br />
address both the individual and the social<br />
determinants of car dependency to be<br />
effective. Measures such as 'travel<br />
awareness' campaigns do not address the<br />
effects of a 'social' dependency on cars -<br />
they deal with individuals who are car<br />
dependent and could make some changes<br />
in behaviour. This is only part of the<br />
problem. A social dependency on cars<br />
impacts on all households including ‘no car’<br />
households. The effects of 'social exclusion'<br />
on the latter are discussed by Solomon<br />
(2003).<br />
Tolley (2003) discusses the contradiction in<br />
government policy: car ownership should<br />
increase and usage decrease. He stresses<br />
that owning a car is not the problem, but<br />
'car dependence' is. Walking is unlikely to<br />
rise even if the facilities and support<br />
promised by government for a National<br />
Walking Strategy materialise. With greater<br />
economic prosperity, car ownership levels<br />
are likely to increase and the rise is an<br />
"underlying force for reduced walking"<br />
(p.190). A worrying trend is indicated by<br />
the statistics for 'second car' ownership in<br />
Britain. This has almost doubled since<br />
1980: from 15% to 29% of all households.<br />
World Transport Policy & Practice________________________________________________________<br />
Volume 13.1 September 2006<br />
16
The percentage of 'one car' households<br />
remains the same, 45%. Those with 'no car'<br />
have dropped from 41% to 26% (DfT,<br />
2005). Another concern is that children<br />
transported by car experience a high<br />
proportion of short car trips, for instance,<br />
the 'school run' and may associate car use<br />
with this. Some of the author's statistical<br />
findings for 'one car' households are<br />
inconsistent and a likely explanation is<br />
'single parent' families. In these there is a<br />
ratio of one car to each adult. In two<br />
parent, one car households, car usage is<br />
higher than in 'no car' households but lower<br />
than multi-car households.<br />
Baird (1998) quotes Michael Palin, "perhaps<br />
we will end up with a policy like Chinese<br />
birth control, one car per household"<br />
(p.168). A system of inducements and<br />
disincentives for families to remain or<br />
become 'one car', or 'no car' households<br />
should be introduced. Road tax on a second<br />
car could be set at a higher rate and that<br />
on a third, higher still. The income<br />
generated should be hypothecated to pay<br />
for these. But the efficacy of a 'one car'<br />
policy is extremely doubtful if not<br />
incorporated with an integrated package of<br />
measures. Dobbs (2005) highlights that<br />
sustainable transport systems may have<br />
serious gender implications. Hence, a 'one<br />
car' policy should be marketed as 'car<br />
share' within families so that women are<br />
not the losers. Dealing with transport to<br />
work issues (which is one reason<br />
households obtain a second car) is of vital<br />
importance. Kingham, Dickinson et al<br />
(2001) point out that while some employers<br />
provide a car and allowances for petrol,<br />
people will not be persuaded to leave cars<br />
at home. Cullinane (1992) describes<br />
company cars as "an unnecessary addition<br />
to the park of cars" advocating that owners<br />
are fully charged without subsidy from<br />
government or employers (p.300). While<br />
advocating for a complete package of<br />
innovative campaigns, Meaton and Kingham<br />
(1998) stress how there needs to be<br />
acceptance that radical action is required.<br />
Conclusions<br />
The variable 'car availability' is normally<br />
used as an economic indicator, synonymous<br />
with higher income and residency in<br />
particular neighbourhoods. Possession of<br />
two or more cars extends socio-economic<br />
and geographical boundaries therefore the<br />
effects of multi-car ownership are not<br />
restricted to the affluent. Bold policy<br />
measures are necessary to prevent the<br />
trend towards second and third car<br />
ownership.<br />
Acknowledgements<br />
I am grateful to my PhD supervisors, Dr.<br />
M.R.Tight and Dr. P. Firmin, Institute for<br />
Transport Studies, University of Leeds,<br />
England, for their guidance and support.<br />
Without the help of staff and pupils in the<br />
participating schools in West Yorkshire, the<br />
research could not have gone ahead.<br />
Address for correspondence:<br />
Institute for Transport Studies, 36-40,<br />
University Road, University of Leeds, Leeds.<br />
England. LS2 9JT<br />
Email: baslington@sagainternet.co.uk<br />
24, Rogerson Square, Brighouse, West<br />
Yorkshire, England<br />
HD6 1TJ<br />
World Transport Policy & Practice________________________________________________________<br />
Volume 13.1 September 2006<br />
17
Trends, innovative course settings, and<br />
levers for mobility and transport<br />
Seen from the Year 2030<br />
Hartmut H. Topp<br />
We need innovative policies to shape the<br />
future of mobility and transport.<br />
Sustainable mobility in terms of ecology,<br />
economy and social justice is the goal, even<br />
though sustainability is poorly defined in<br />
the field of mobility and transport, and, at<br />
the same time, inflationarily used. Technical<br />
innovations in transport are often<br />
discussed, but we also need economic<br />
innovations, political innovations, social<br />
innovations, as well as behavioural<br />
changes, because sustainable mobility can<br />
only be achieved by a broad range of<br />
measures. We need new policies and<br />
innovative course settings, because laissezfaire<br />
cause undesirable developments, such<br />
as wasting fossil energy, climate change<br />
and natural disasters through global<br />
warming, dead-end street of automobile<br />
dependency, urban sprawl resulting in high<br />
costs, unaffordable public transport in rural<br />
areas, macro-economic losses through<br />
congestion, environmental and health<br />
damage ... The list could be continued.<br />
Undesirable developments, like these, are<br />
avoidable; that is what I would like to show<br />
with a scenario for mobility and transport in<br />
the year 2030. Scenarios are images of<br />
possible futures following a comprehensive<br />
path - in the favourable, optimistic case<br />
with the right innovations and right political<br />
course settings at the right time. Such an<br />
optimistic scenario requires future-oriented<br />
and societally accepted innovations not only<br />
in the field of transport, for mobility and<br />
transport are tightly interconnected with<br />
space and time, settlement,<br />
communication, environment, energy,<br />
economy, life styles etc. Due to these<br />
complex interdependencies there are no<br />
simple recipes or easy successes on how to<br />
reach sustainable mobility. I choose a<br />
retrospective view from 2030 to present my<br />
scenario because I think it is more inspiring<br />
than a prospective scenario, plus it<br />
underlines the visionary character of a longterm<br />
scenario. I do not claim total<br />
completeness for my scenario, it rather<br />
contains important influences of mobility<br />
and transport in cities and regions like<br />
stones in a mosaic. And, of course, I also<br />
could draw different scenarios. For my<br />
scenario I have chosen ten topics; they<br />
reach from energy and prices for mobility<br />
over city development and life styles to<br />
different transport issues.<br />
1. A frame for energy 2030<br />
I invite you to leap forward with me into the<br />
year 2030. The Kyoto Protocol is now<br />
accepted world-wide; the Rio Declaration<br />
from 1992, as well as, the Agenda 21 are<br />
considered as the beginning of a new epoch<br />
of global co-operation. The CO2-problem<br />
and high prices for crude oil, since the<br />
beginning of this century, lead to a massive<br />
promotion of renewable energies. Now, in<br />
2030, renewable forms of energy are<br />
dominating.<br />
World Transport Policy & Practice________________________________________________________<br />
Volume 13.1 September 2006<br />
18
However, it should not be forgotten how<br />
long it took for the transition from fossil to<br />
renewable energy, and which economic and<br />
technological efforts were needed. Iceland,<br />
with its huge resources of geothermic<br />
energy, played a special role in this<br />
process. With high spare capacity of<br />
abundant electricity from geothermic power<br />
plants it established the first hydrogenbased<br />
economy of the world in 2012,<br />
including power-cell driven cars and trucks.<br />
Today (in 2030) motor vehicles are clean.<br />
In most countries half of the fleet is still<br />
based on traditional combustion engines,<br />
while new vehicles use hydrogen produced<br />
with renewable energy. The prices for<br />
energy increased drastically, which lead to<br />
better efficiency in industry and transport<br />
by more than a factor of 4.<br />
The national economic balances were<br />
changed (starting at the turn of the<br />
century) from the gross national product to<br />
the ecological national product. This total<br />
accounting of the national economy, which<br />
considers consumption of nature and<br />
environmental burdens as cost factors, has<br />
created a new economic framework for<br />
transport and energy.<br />
2. Physical mobility is expensive<br />
Mobility, especially auto-mobility in 2030, is<br />
expensive. The demand for crude oil had<br />
increased dramatically during the first<br />
decade of the century and, since 2015,<br />
deliveries recurrently could not cover it.<br />
Some years later, the transition of the<br />
transport sector from carbon to hydrogen<br />
gained ground, but even in 2030 it is not<br />
yet completed; in most countries we still<br />
have an expensive double network of filling<br />
stations. Parts of the former uncovered<br />
external costs of transport caused by<br />
environmental damage, health risks and<br />
macro-economic losses through congestion<br />
are now paid by the road users through an<br />
ecological tax. Since 2012, the transport<br />
sector as a whole is involved in CO2-<br />
emission trading. Since 2006 , former tax<br />
benefits for commuters have been<br />
abolished step by step. At the turn of the<br />
century, the public bodies could no longer<br />
afford to maintain and adjust the 'free of<br />
cost' usable roads. In Germany, already in<br />
the 1990s maintenance dropped to 54 % of<br />
the actual requirement on national roads,<br />
and to 63 % on motorways.<br />
'Make the road user pay instead of the tax<br />
payer' was the solution: In Germany, it<br />
started in 2005 with road pricing on<br />
motorways for heavy trucks; and road<br />
pricing for all vehicles on all roads outside<br />
the cities was introduced in 2012. The GPSbased<br />
on-board technology was finally<br />
successful, and proved to be extendable to<br />
all vehicles and all roads. It could also be<br />
exported to several countries. This system<br />
is self-sufficient, requiring no roadside<br />
construction and uses telematic services,<br />
which have been standard equipment in<br />
vehicles since 2010. Spatially and timely<br />
staggered road pricing was able to flatten<br />
peak volumes and to balance demand and<br />
supply. The former notorious traffic jams<br />
are now exceptions. Road pricing in cities<br />
(such as that in place in some Norwegian<br />
cities, Singapore, London or Stockholm)<br />
was not introduced in Germany cities,<br />
because planners and politicians were<br />
concerned that road pricing would make the<br />
city more expensive and thus less attractive<br />
compared to the periphery. They also<br />
argued that parking fees could have a<br />
similar effect as road pricing.<br />
The increases of mobility prices were often<br />
protested against, but with their long-term<br />
impact and calculability they also lead to a<br />
new balance between mobility requirements<br />
World Transport Policy & Practice________________________________________________________<br />
Volume 13.1 September 2006<br />
19
and traffic behaviour. Social hardship was<br />
compensated by a transport allowance<br />
similar to the former residence allowance<br />
for people living on public welfare.<br />
3. Inner city development<br />
For a long time Green land development<br />
was very common, rarely questioned and<br />
promoted thorugh tax benefits for<br />
commuters. Auto-mobility and<br />
telecommunication (together with the<br />
demand for bigger residences, cheap<br />
building plots and a family home in green<br />
areas) had dissolved spatial structures<br />
towards what we call 'Zwischenstadt';<br />
suburbia and urban sprawl with low density,<br />
car-orientation and, finally, cardependency.<br />
Concentrated, radial traffic<br />
flows, directed towards the city centre were<br />
becoming increasingly superimposed by<br />
peripheral flows and criss-cross flows over<br />
longer distances throughout the region<br />
(figure 1). The density of the city decreased<br />
- a process, which was additionally<br />
accelerated by demographic changes.<br />
Figure 1:<br />
Spatial structure of travel patterns (own figure)<br />
Parallel to green land development at the<br />
beginning of the century, new, dense and<br />
mixed-use city quarters were established on<br />
empty land abandoned by military, industry<br />
or railways. These inner city developments<br />
were very successful and they initiated a<br />
new trend 'back into the city' (Brühl et al,<br />
2005) and the renaissance of the inner city.<br />
Attractive cities, which kept an eye on the<br />
quality of their public spaces, advertised<br />
urban culture and urbanity with success.<br />
They especially attracted the group of the<br />
'new' old people wanting to live in an urban<br />
cultural ambience. Suburbia is not<br />
attractive for the older generation because<br />
shops, services, leisure time facilities and<br />
medical care are not easily accessible, and<br />
the car is needed for almost every journey.<br />
The traditional European inner city with its<br />
density and mixed-use areas survived<br />
parallel to suburbia and the 'Zwischenstadt'.<br />
Inner city development (instead of green<br />
land development) with 'more mobility and<br />
less traffic' (Topp, 2003) became the most<br />
important strategy of spatial development.<br />
In inner city areas, a household can easily<br />
live with one car and (if so desired) even<br />
without a car. Here, public transport plus<br />
car-sharing is a realistic alternative. Cardependency<br />
in suburbia on the other side<br />
absorbs more from a household's budget<br />
than is usually noticed. That can<br />
compensate for higher building costs in the<br />
inner city over a long period. In suburbia<br />
people loose not only flexibility and mobility<br />
but also economic liberties. This gained<br />
more and more importance during the<br />
years because of more expensive transport<br />
World Transport Policy & Practice________________________________________________________<br />
Volume 13.1 September 2006<br />
20
and (at the same time) of smaller, freely<br />
disposable parts of household incomes due<br />
to more financial provision for sickness and<br />
old age. Robust and stable urban<br />
structures, at least in transport aspects with<br />
less car-dependency, became more<br />
attractive whilst car-dependent living in<br />
suburbia became less so. The planning of<br />
the 'compact city' and of 'decentralised<br />
concentration' in the region became<br />
effective, whereas today (in the year 2030)<br />
we have problem areas of urban renewal in<br />
suburbia and the 'Zwischenstadt'.<br />
An indispensable aspect of inner city<br />
development is the quality of public spaces.<br />
Urban design, architecture, green areas and<br />
water in the city; quality of life for jobs,<br />
leisure activities and residents; and urban<br />
culture became the deciding factors within<br />
the growing competition between cities. A<br />
lack of these qualities, very often, was<br />
caused by brutal transport infrastructure. A<br />
good example is our project in<br />
Saarbrücken, the capital of the German<br />
Federal State of Saarland with 180,000<br />
inhabitants. Here, the transport-oriented<br />
functionalism of the 1960s had perfected<br />
the motorway and, at the same time,<br />
deprived the city from its specific character<br />
and it’s most important potential. There<br />
were a lot of similar examples all over the<br />
world. In the early century, a transport<br />
infrastructure cutting wounds like this into<br />
the city was no longer tolerated. In<br />
Saarbrücken, €160 million was invested in a<br />
tunnel and, in 2012 the city centre was<br />
back on the river banks. It was not only a<br />
revamp of the city centre, but also provided<br />
the turn around of a declining city, which<br />
today is better off and able to compete with<br />
prosperous neighbours such as Trier, Metz<br />
and Luxemburg. An early example similar<br />
to Saarbrücken is Düsseldorf on the Rhine<br />
River, where a similar project was<br />
completed in the early 1990s.<br />
Figure 2a:<br />
Saarbrücken 2006: motorway along the river<br />
World Transport Policy & Practice________________________________________________________<br />
Volume 13.1 September 2006<br />
21
Figure 2b:<br />
Saarbrücken 2012: city centre on the river banks<br />
4. Individual life styles<br />
activities, which, at the turn of the century<br />
Living in the city, living in the already made up for about half of the<br />
'Zwischenstadt' (edge-city), and living in<br />
suburbia all represent different life styles.<br />
We experienced a multitude of diverse life<br />
kilometres covered by passenger transport.<br />
Public means of transportation, as collective<br />
means with large vehicles, do not fit too<br />
styles, which are coined through well into such a development. They have<br />
individuality, flexibility and spontaneity. The<br />
integration of people in time and space<br />
systems has dissolved; working hours are<br />
held their importance in inner cities; but in<br />
other parts of the cities and in the regions<br />
they have become more individual and<br />
more flexible, operating and working hours more flexible. The individual forms of<br />
are de-coupled through widely fail-safe locomotion (foot, by bicycle and by car)<br />
automation. Service hours are significantly<br />
expanded; in many cases to around the<br />
clock (car-sharing is an example). Teleworking<br />
is widespread in 2030: around<br />
have gained further meaning. The bicycle,<br />
in a stylish high-tech form now is a symbol<br />
for independence, individuality, and healthy<br />
living.<br />
30 % of the employed work at home,<br />
mostly three days per week, plus 20 % 5. Demographic change and mobility<br />
work in dispersed tele-offices or call World-wide the population is still growing.<br />
centres. Commuter traffic has been In Europe, however, the population has<br />
noticeably reduced; the traffic peaks have been shrinking since about 2015 and<br />
become less accentuated. Traffic problems<br />
(in 2030) are mainly caused by leisure<br />
societies are rapidly ageing. In Germany,<br />
for instance, the birth rate had sunk to 1.3<br />
World Transport Policy & Practice________________________________________________________<br />
Volume 13.1 September 2006<br />
22
children per woman at the beginning of the<br />
century; later it stabilised to about 1.4<br />
(Statistisches Bundesamt, 2003), whereas<br />
2.1 would be needed to maintain the<br />
population constant. A table comparing<br />
median age and birth rate in the European<br />
Union in 2003 shows Germany with the<br />
oldest population and one of lowest birth<br />
rates, while Ireland had the youngest and<br />
most reproductive one. Iceland would stay<br />
in this chart almost exactly where Ireland<br />
is. In Germany, even though immigration<br />
was made easier, it could not make up for<br />
the low birth rate.<br />
The other component of the demographic<br />
change was the continuous ageing of<br />
societies and that happened all over Europe<br />
due to higher life spans. In this respect,<br />
Iceland is no exception. In Germany, the<br />
number of older people over 60 grew by<br />
41 % since 2003, while the figures for the<br />
population under 20 dropped by 19 %.<br />
Figure 3: Median age and birth rate in the<br />
European Union 2003<br />
Definition ‘median age‘:<br />
50 % of a population are<br />
younger and 50 % are older<br />
than median age<br />
Regional differences are more interesting<br />
than the generalised figures for a whole<br />
countr. Due to regional migration within a<br />
country and different chances of regions to<br />
attract migrants from outside, the<br />
differences between prosperous and<br />
shrinking regions grew. The spatial planning<br />
objective of equal living conditions was no<br />
longer achievable. In 2030, we have<br />
prosperous, stagnating and shrinking<br />
regions side by side with the biggest<br />
problems in peripheral rural areas.<br />
6. Public transport<br />
Public transport was affected through<br />
demographic changes in several aspects.<br />
First, with fewer students, the biggest<br />
group of public transport users collapsed; in<br />
rural areas the backbone of public transport<br />
was affected. Second, less people working<br />
resulted in less commuter rides - which<br />
were, at the beginning of the century, a<br />
strong column of public transport. Thirdly,<br />
the older generation of 2030 (having grown<br />
up with the car) drive longer and more than<br />
the generation before. Decreasing body<br />
strength speaks more for<br />
the car. Decreasing speed<br />
of reactions is<br />
compensated by defensive<br />
driving and automatic<br />
driver's assistances.<br />
Walking disabilities are<br />
less restricting in a car<br />
than in public transport;<br />
the desire to live selfdetermined<br />
as long as<br />
possible, has postponed a<br />
move away from the car.<br />
According to the saying,<br />
'You are only getting old,<br />
when you can't drive your<br />
car anymore.'<br />
The car industry has<br />
quickly focused on the fast<br />
World Transport Policy & Practice________________________________________________________<br />
Volume 13.1 September 2006<br />
23
growing group of older customers with 'ageadjusted'<br />
cars (comfortable getting in and<br />
out) and with all possible drivers’<br />
assistances. Barrier-free public transport in<br />
the sense of 'universal design' without any<br />
impediments concerning access and usage<br />
has been taken for granted for a long time.<br />
Age-adjusted and barrier-free public<br />
transport means (beyond the elimination of<br />
physical barriers) comfort, direct<br />
connections and simple handling before<br />
short travel times and transfers. 'Captive<br />
riders' (young people under 17 or 18, or<br />
older people without a car) have become<br />
fewer; occasional customers, those who are<br />
free to opt for modal choice, regular choice<br />
riders and older customers have higher<br />
demands for transport supply, information,<br />
liability, service, security, and cleanliness.<br />
In 2030, the public transport customer is<br />
the 'king'. Passenger rights include a<br />
'mobility guarantee' in case of late arrivals<br />
and missed connections; customer-oriented<br />
service and information leads to better<br />
understanding of any inconvenience.<br />
Understanding improves the transport<br />
climate as well as customers' satisfaction<br />
and loyalty. High functional and aesthetic<br />
design of stops, helpful staff members,<br />
electronic tickets or mobile phone tickets<br />
instead of ticket machines, enough seats,<br />
good vehicle climate and design are 2030<br />
customers' basic claims.<br />
How was public transport able to manage<br />
the split between a difficult market and the<br />
needed quality jump? At the start of this<br />
century, public transport in several<br />
countries of the European Union was on the<br />
border line: in addition to the demographic<br />
changes it had to face liberalisation and<br />
competition, cuts into financial budgets<br />
according to European harmonisation and<br />
freedom of competition, tight finances of<br />
public bodies, the retreat of the state from<br />
public provision and more disperse traffic<br />
patterns in time and space. These<br />
influences, as adversaries of public<br />
transport, could hardly be controlled by<br />
planning or political measures. They<br />
resulted in a far-reaching restructuring of<br />
transport authorities towards higher<br />
efficiency. In about 2012, when car driving<br />
became significantly more expensive new<br />
financial opportunities for public transport<br />
were opened. According to the principle<br />
'transport finances transport' public<br />
transport received transfer payments from<br />
the general road pricing of all vehicles on all<br />
roads outside the cities. This was the<br />
precondition for a new, quality public<br />
transport.<br />
7. Mobility association with car-sharing<br />
Since the beginning of this century public<br />
transport and car-sharing co-operate under<br />
the common roof of the so-called mobility<br />
association. This means the total<br />
integration of walking, biking, public<br />
transport, car-sharing, dial-a-bus and taxi<br />
(physically and spatially), as well as in<br />
terms of information and organisation.<br />
Public transport authorities evolved into<br />
comprehensive mobility providers offering<br />
integrated mobility or 'seamless travelling'.<br />
The mobility association created a<br />
competitive alternative to the private car.<br />
Car-sharing became the 'public car' and the<br />
forth column in the mobility association<br />
additional to walking, biking and public<br />
transport.<br />
Car-sharing started at the end of the last<br />
century as an ecological niche product.<br />
Soon, it became strongly professionalised<br />
developing into a country-wide, high-tech<br />
service with chip-cards, satellite-based<br />
GPS-navigation, travel data compiled by<br />
on-board computers, automatic phone and<br />
internet-based booking systems etc. Instant<br />
access without reservation, open end and<br />
World Transport Policy & Practice________________________________________________________<br />
Volume 13.1 September 2006<br />
24
one way use are taken for granted since<br />
2015.<br />
A pioneer in the co-operation between<br />
public transport and car-sharing was the<br />
Transport Authority of Zürich, where in<br />
1995 the brand 'züri mobil' was coined. The<br />
next milestone of integrated mobility was<br />
set by the 'mobility packages' in the cities<br />
of Freiburg and Hannover. This was a<br />
comprehensive service providing<br />
information directed at satisfying<br />
customer's mobility demands in a fast,<br />
convenient, reliable, and cheap manner<br />
with the most appropriate mode of<br />
transport. By 2007, car-sharing spaces in<br />
Germany were legally established within the<br />
public realm and similar to taxi stands. The<br />
public transport stations thus evolved into<br />
mobility stations, which are now common<br />
all over the cities.<br />
In Switzerland (as early as in 2005), carsharing<br />
had 60,000 customers and almost<br />
2,000 cars. In Germany, similar numbers<br />
were only reached by 2010 within the<br />
mobility association (That means 650,000<br />
considering the different populations) (see<br />
Figure 4). More and more people considered<br />
car ownership to be expensive and<br />
inefficient. Indeed, so it is. At the beginning<br />
of this century, a private car on average<br />
was only driven one hour per day. It was<br />
parked uselessly somewhere at the<br />
roadside or in a garage for at least 23<br />
hours. On the other hand, integrated<br />
mobility offers the appropriate transport<br />
mode for different purposes: for every<br />
occasion, at any time, the right car at the<br />
right location. This is a both a convenient<br />
and fun system which saves a lot of money<br />
due to the fact that buying, maintenance<br />
and servicing of the car is taken care of by<br />
others.<br />
Mobility chains are getting more flexible<br />
and more individual if I can return 'my' carsharing<br />
car without searching for a parking<br />
space and not having to pick it up on my<br />
way back.<br />
When auto-mobility (around 2012) became<br />
significantly more expensive, car-sharing<br />
reached the steep slope of the common s-<br />
shaped logistic curve of market penetration<br />
and, finally, today's position in the mobility<br />
market with 2 million car-sharing customers<br />
and 65,000 cars in Germany (Topp, 2005).<br />
Figure 4: Market penetration of car-sharing<br />
in Germany (own figure)<br />
8. Intermodal transport system<br />
At the beginning of the 21 st century, the<br />
most important challenge in transport<br />
planning was the physical connection of the<br />
different transport modes, as well as their<br />
informational and organisational<br />
networking. Information technologies<br />
merged with transport technologies pushing<br />
forward transport innovations. Physical and<br />
virtual mobility grew together. In 2030, the<br />
system limits of the former separated<br />
transport modes are abandoned: cars and<br />
bikes have become more public through<br />
car-sharing and bike-sharing schemes;<br />
collective public transport is part of<br />
individual mobility chains which are<br />
established through individual information.<br />
The former spatially and modally separated<br />
World Transport Policy & Practice________________________________________________________<br />
Volume 13.1 September 2006<br />
25
transport control and management centres<br />
have merged.<br />
Since 2012, cars and mobile phones as<br />
mobile detectors were collecting intermodal<br />
traffic data as floating car and<br />
floating phone data. Taxis and buses with<br />
special sensors are working as floating car<br />
observers delivering dynamic data (while on<br />
their routes) of traffic volumes and speeds,<br />
lengths of jams, hold-ups and roadside<br />
parking occupancy.<br />
This floating data is coupled with data from<br />
stationary detection by video or ultrasound<br />
for traffic light control, public transport<br />
management, parking guidance and road<br />
pricing. In this way, actual information is<br />
gained about traffic flow, disturbances,<br />
mode and route choice, and origin and<br />
destination of journeys. Short term<br />
prognoses, based on this, manage on-line<br />
signal settings, public transport operations,<br />
and individual guidance systems for route<br />
recommendations and passenger<br />
information.<br />
The PTA - the Personal Travel Agent - not<br />
any longer car-bound, but now integrated in<br />
the mobile phone - facilitates individual<br />
mobility chains. It informs, books services<br />
and bills the user for them. Inter-modal<br />
mobility providers have excellent business.<br />
The car industry has developed into a<br />
mobility industry, which still produces<br />
'hardware' like cars, buses, trains and<br />
stations as interfaces, but now sells these<br />
as a 'mobility package' including the<br />
accompanying 'software' and service. At the<br />
start of the century the electronical mobility<br />
card was established. Chips integrated in<br />
mobile phones, watches or mobility cards in<br />
the form of a 'Be in/Be out' system detect<br />
the presence of a customer without any cooperation<br />
from him or her needed. The<br />
system covers road fees, booking of a<br />
parking space, parking fees, taxi, public<br />
transport, car-sharing, bike-sharing, mobile<br />
phone and internet. The mobility invoice<br />
comes monthly on the basis of 'best price',<br />
which takes into account all benefits or<br />
additions during peak times.<br />
9. Virtual mobility<br />
Virtual mobility was the big hope at the<br />
beginning of the century. The question was:<br />
will information and communication reduce<br />
physical transport? Derived from the<br />
'never-ending' story of information and<br />
transport (Cerwenka, 1989) the answer<br />
could only be 'no'. On the contrary, it had<br />
always been the case that new technologies<br />
build up information and transport as well.<br />
Of course, tele-working, tele-banking, e-<br />
commerce, tele-learning and teleconferences<br />
replace physical transport, but<br />
at the same time, the range of actions and<br />
the frequency of contacts of companies and<br />
persons are increasing, finally resulting in<br />
new transport over longer distances. The<br />
telephone also had not been able to curb<br />
transport: 'Over the phone more<br />
appointments are made than cancelled'. E-<br />
commerce finally lead to a strong increase<br />
in deliveries. Despite sophisticated logistics,<br />
the multiplying instant deliveries could<br />
hardly be combined.<br />
Nevertheless, in 2030 we have experienced<br />
that this amplifying process of parallel<br />
growth of transport and information did not<br />
continue because transport became more<br />
and more expensive and communication<br />
cheaper and better. Nowadays, the virtual<br />
visit to a museum provides more<br />
background information than did the<br />
traditional visit. Virtual city tourism brings<br />
us not only into present cities, but also into<br />
past and future cities. <strong>What</strong> is still lacking<br />
with cyber excursions is the sensual<br />
experiencing of other regions and other<br />
people - a reality close tele-presence is still<br />
World Transport Policy & Practice________________________________________________________<br />
Volume 13.1 September 2006<br />
26
in the pipeline. For many purpose oriented<br />
activities, easily accessible, cheap and top<br />
quality communication is a substitute for<br />
time-consuming and significantly more<br />
expensive transport.<br />
The 'virtual' globalisation has gained<br />
momentum. The 'real' globalisation<br />
however (represented by global flows of<br />
passengers and freight) slowed down.<br />
Regional economy cycles and continental<br />
tourism were backed up. The exotic fun (as<br />
far as it survives in the globalised world) is<br />
expensive. Through 'virtual' mobility finally,<br />
around 2010, the already in the 1990's<br />
discussed de-coupling of economic growth<br />
and transport development could be<br />
achieved.<br />
5) was introduced (Menzel, 2004). It<br />
functions very simple: the electronic town<br />
and road maps of the 'travel pilot' were<br />
complemented by the respective speed<br />
limits. The information about a speed limit<br />
is mechanically transformed by the<br />
accelerator or by the throttle in a way that<br />
accelerating beyond the speed limit is either<br />
not even possible or only by a kick-down<br />
procedure as we know from the speed<br />
controller. In 1998 I already drove such a<br />
car in Lund, Sweden. You get accustomed<br />
to it very quickly and I found it very<br />
convenient.<br />
Figure 5: Intelligent speed adaptation -<br />
ISA<br />
10. 'Vision Zero' for traffic safety<br />
In 1997 the Swedish Parliament proclaimed<br />
their 'Vision Zero'; a vision that nobody<br />
should be killed or severely injured in road<br />
traffic. The effect of a vision lies on the way<br />
to the goal. Whether a vision is one-to-one<br />
achievable or not is less important. In<br />
Germany, the country of fast cars and fast<br />
driving, and where speeding as the major<br />
cause of heavy accidents was a taboo,<br />
'Vision Zero' for a long time had no chance.<br />
It took society until 2010 to no longer<br />
accept more than 5,000 people killed and<br />
80,000 severely injured in road traffic<br />
accidents. New speed limits were<br />
introduced: 130 km/h on motorways, 80 on<br />
highways and 30 within the cities.<br />
A further developed jurisdiction ensured<br />
that the operators of the privatised roads<br />
have to guarantee a defined standard of<br />
compliance with the rules by enforcement,<br />
otherwise they share responsibility in case<br />
of an accident. Traffic safety was<br />
significantly improved. The speed problem<br />
was further resolved when, in 2015, the<br />
'Intelligent Speed Adaptation (ISA)' (figure<br />
The car of 2030 has, beside the 'Intelligent<br />
Speed Adaptation', a lot of 'intelligent'<br />
driver assistants like headway control, lane<br />
changing warning or parking assistance ...<br />
The car has increasingly become a rolling<br />
computer. Nevertheless, automatic driving<br />
(demonstrated in the 1990's) has not yet<br />
been introduced. The car industry, as well<br />
as the road operators, is still afraid of the<br />
product liability.<br />
11. Résumé<br />
My scenario 2030 for mobility and transport<br />
in regions and cities contains elements<br />
which are controllable by planning and<br />
politics to very different extents. There are<br />
trends (figure 6) like the world-wide<br />
World Transport Policy & Practice________________________________________________________<br />
Volume 13.1 September 2006<br />
27
increasing demand for energy, more<br />
expensive mobility, flexibilisation of time<br />
and space structures, demographic changes<br />
with the ageing of societies, merging of<br />
information technologies into transport etc.<br />
As mega-trends these developments are<br />
hardly steerable by planning and politics,<br />
but we have to face them in order to be<br />
prepared and to adjust to them.<br />
Figure 6:<br />
Trends, course settings, and levers for mobility and transport<br />
(Mega)trends Course settings Concrete measures as levers<br />
increasing demand<br />
support of<br />
ecological tax<br />
flexible public<br />
for fossil energy<br />
renewable<br />
emission<br />
transport<br />
mobility is getting<br />
forms of energy<br />
trading<br />
in rural areas<br />
more expensive<br />
true costs in<br />
in transport<br />
from car-sharing<br />
suburbanisation,<br />
transport<br />
cancelling<br />
to the 'public car'<br />
urban sprawl and<br />
including 'external'<br />
benefits<br />
car-sharing spaces<br />
'back to the city'<br />
costs<br />
of commuters'<br />
licensed<br />
more individual<br />
user financing<br />
road pricing for<br />
multi-modal<br />
life styles<br />
of road<br />
all motor<br />
mobility stations<br />
more flexible time<br />
infrastructure<br />
vehicles<br />
merging of traffic<br />
and space<br />
transit-oriented<br />
compensating<br />
management<br />
structures<br />
settlement<br />
for social<br />
agencies<br />
ageing of<br />
structures<br />
hardship<br />
automatic traffic<br />
populations<br />
inner city instead of<br />
urban quality<br />
data processing<br />
merging of physical<br />
green land<br />
and<br />
speed<br />
and virtual mobility<br />
development<br />
barrier-free<br />
management<br />
total telematisation<br />
reforming the<br />
cities<br />
parking<br />
of the transport<br />
financing<br />
noise protection<br />
management<br />
system<br />
of public transport<br />
& traffic calming<br />
promoting<br />
...<br />
barrier-free<br />
service<br />
pedestrian<br />
'universal design'<br />
offensive<br />
and bicycle traffic<br />
integrating modes<br />
of public<br />
...<br />
in<br />
transport<br />
the mobility<br />
e-ticketing<br />
association<br />
instead<br />
'Vision Zero'<br />
of ticket<br />
for traffic safety<br />
machines<br />
new mobility culture<br />
road toll pays<br />
and traffic<br />
for public<br />
behaviour<br />
transport<br />
...<br />
World Transport Policy & Practice________________________________________________________<br />
Volume 13.1 September 2006<br />
28
Political planning and innovative course settings<br />
(figure 6) for future developments (like<br />
renewable energies, true costs of transport,<br />
transit-oriented settlement structures, inner city<br />
development instead of green land development,<br />
integrating transport modes within the mobility<br />
association all need comprehensive packages of<br />
measures, and we have to carefully consider<br />
their possible undesired side effects. So for<br />
instance, the basic claim for true costs in<br />
transport is closely connected with the price for<br />
mobility, and therefore it has to be introduced<br />
gradually step-by-step, so that it does not<br />
overburden economy and society.<br />
Beside trends and course settings there are,<br />
finally, many concrete measures which serve as<br />
levers (figure 6) in planning and politics, as for<br />
instance, an ecological tax reform, emission<br />
trading in transport, road pricing for all motor<br />
vehicles, a service offensive of public transport,<br />
promoting walking and biking, from car-sharing<br />
to the 'public car', multi-modal mobility stations,<br />
merging of traffic management agencies,<br />
intelligent speed adaptation and more. We have<br />
a lot to do to achieve more sustainable mobility.<br />
Personennahverkehrs im Mobilitätsverbund mit<br />
Car-Sharing. Der Nahverkehr 23, Nr. 9<br />
Address for correspondence:<br />
Imove, Institut für Mobilität & Verkehr<br />
Institute for Mobility & Transport<br />
Kaiserslautern University of Technology<br />
Germany<br />
hartmut.topp@imove-kl.de<br />
References<br />
Brühl, Hasso et al (2005): Wohnen in der<br />
Innenstadt - eine Renaissance? Difu-Beiträge zur<br />
Stadtforschung Nr. 41, Berlin<br />
Cerwenka, Peter (1989): Verkehr - eine<br />
unendliche Geschichte? Straße und Autobahn<br />
(40) Nr. 9<br />
Menzel, Christoph (2004): Basic Conditions for<br />
the Implementation of Speed Adaptation<br />
Technologies in Germany. Grüne Reihe Nr. 64,<br />
imove Kaiserslautern<br />
Statistisches Bundesamt (2003): Bevölkerung<br />
Deutschlands bis 2050. Ergebnisse der 10.<br />
koordinierte Bevölkerungsvorausberechnung.<br />
Wiesbaden<br />
Topp, Hartmut H. (2003): Mehr Mobilität,<br />
weniger Verkehr bei Innen- vor Außenentwicklung.<br />
Raumforschung und Raumordnung<br />
61, Nr. 4<br />
Topp, Hartmut H. (2005): Die Potenziale von<br />
Car-Sharing - Mehr Chancen des Öffentlichen<br />
World Transport Policy & Practice________________________________________________________<br />
Volume 13.1 September 2006<br />
29
Splintering the public realm:<br />
Using local public space for<br />
corporate economic gain?<br />
Fiona Raje<br />
Introduction<br />
This paper reflects on empirical evidence from<br />
recently-completed research on transport and<br />
social inclusion which revealed an apparent gap<br />
between stated local authority policy and actual<br />
planning practice in the urban environment.<br />
The wider research looked at the ways in which<br />
people in two case study areas in Oxfordshire in<br />
the UK experience the transport system and how<br />
this affects their ability to access key services,<br />
activities and facilities. The findings described<br />
here concentrate on one of the main issues<br />
revealed in the urban case in Barton, an urban<br />
peripheral estate of Oxford. The paper looks at<br />
how local authority planning decisions may<br />
conflict with their own Council’s stated policies<br />
and how the manifestation of this conflict can<br />
contribute to social exclusion in neighbourhoods<br />
which are already vulnerable to the effects of<br />
social inequalities.<br />
Background<br />
The concept of “splintering urbanism” was<br />
developed by the UK urban planning scholars<br />
Stephen Graham and Simon Marvin who were<br />
responding to “what we feel is an urgent need:<br />
to develop a more robust, cross-cutting,<br />
international, critical, dynamic and<br />
transdisciplinary approach to understanding the<br />
changing relations between contemporary cities,<br />
infrastructure networks and technological<br />
mobilities” (Graham and Marvin, 2001:33). The<br />
authors argued that “a parallel set of processes<br />
are under way within which infrastructure<br />
networks are being ‘unbundled’ in ways that<br />
help sustain the fragmentation of the social and<br />
material fabric of cities” (Graham and Marvin,<br />
2001:33). MacLeod (2004:28) provides an<br />
overview of some of the features of the concept:<br />
Blending several theoretical perspectives and<br />
deriving their analysis from a truly impressive<br />
range of cities stretching across the global<br />
‘north’ and ‘south’, Graham and Marvin position<br />
the emergence of features like gated<br />
communities, US-style privatised Business<br />
Improvement Districts, self-enclosed shopping<br />
malls, and edge city developments within a<br />
broader context of political economic transition.<br />
In particular, and importantly, they locate such<br />
trends within the shifting contours of state<br />
power and the practices of and limits to urban<br />
and regional planning.<br />
The concept of fragmentation of the public realm<br />
is relevant to discussions of transport and social<br />
inclusion since any “splintering” which may<br />
occur would be counter to the objectives of<br />
lessening social exclusion. To this end, in this<br />
paper we examine one of the features of<br />
Graham and Marvin’s splintered urban<br />
environment in greater depth: the gated<br />
community, a residential area with restricted<br />
access:<br />
Through the establishment of designated<br />
perimeters (usually in the form of walls or<br />
fences) as well as controlled entrances, gated<br />
communities are intended to prevent intrusion<br />
by non-residents. For some scholars, they are<br />
deemed to be precipitating a private world that<br />
shares little with its neighbours or the larger<br />
political system leading to a fragmentation that<br />
“undermines the very concept of civitas –<br />
organised community life” (Blakely and Snyder,<br />
1999). (MacLeod, 2003:5)<br />
A history of residential separation in Oxford<br />
While not as prevalent in European societies as<br />
in many other regions of the world, the gated<br />
community is showing a rising presence in the<br />
UK. There are now over 1,000 gated<br />
communities in England with most being found<br />
World Transport Policy & Practice________________________________________________________<br />
Volume 13.1 September 2006<br />
30
in the wealthier south east and London in<br />
particular (Atkinson and Flint, 2003).<br />
of the former local pub, The Fox, adjacent to<br />
local authority-owned flats and is being sold as:<br />
The physical separation of one residential area<br />
from another has an infamous precedent in<br />
Oxford. In the 1930s, rapid growth of the motor<br />
industry brought an influx of immigrants from<br />
other parts of the UK to Oxford. There was a<br />
resultant pressure on the city’s limited housing<br />
resources:<br />
A modern gated development…the development<br />
is within close proximity to the Headington<br />
Roundabout and has easy access to the A40 and<br />
links to the M40. Buses to Oxford Central and<br />
London a short walk away.<br />
(http://www.barratthomes.co.uk/searchres.cfm<br />
accessed 281004).<br />
The council estate at Cutteslowe became<br />
notorious in 1934 when developers of an<br />
adjoining private estate built walls to prevent<br />
the council’s tenants from using its roads: it was<br />
alleged that the tenants were former Oxford<br />
slum-dwellers, although most of the houses<br />
were inhabited by newcomers to the city. The<br />
council was not able to compel the demolition of<br />
the walls until 1959. (Crossley, 1979 @<br />
www.britishhistory.ac.uk/report.asp?compid=22805<br />
accessed 270505)<br />
One of the newest gated communities is being<br />
built in Barton (see Plate 1). The gated Barratt<br />
Homes development “Jazz” is located on the site<br />
The apartments are being marketed without<br />
reference to the Barton estate upon which they<br />
are built, their location being advertised as<br />
“Headington, Oxford” – the more socially<br />
salubrious adjacent neighbourhood. The<br />
marketing information indicates that the<br />
development’s main attribute appears to be that<br />
it is located near to the main inter-urban road<br />
network for ease of access to the Oxford-London<br />
corridor. The Barton estate has seen other<br />
private developments being built within its<br />
boundaries but the establishment of a gated<br />
community represents another factor<br />
contributing to the further fracturing of the local<br />
community fabric.<br />
Plate 1: Gated development adjacent to local authority housing, North Way, Barton<br />
Source: Fiona Rajé<br />
World Transport Policy & Practice________________________________________________________<br />
Volume 13.1 September 2006<br />
31
The gated community in the wider<br />
community<br />
The literature of the post-apartheid South<br />
African city describes gated or walled<br />
communities as “security villages” (Jürgens and<br />
Gnad, 2002:337). There may be some merit in<br />
viewing the development in Barton in such a<br />
light. Villages tend to be isolated with access to<br />
many facilities and opportunities being<br />
dependent upon car access: this is a<br />
characteristic of the Jazz development. Similarly,<br />
building housing with restricted access in an<br />
area that is commonly associated in the media<br />
with crime intensifies the perception of personal<br />
risk to new residents without the security of the<br />
gates and walls of the security village. The very<br />
fact that the development is gated implies to a<br />
purchaser that the area around their new home<br />
is not a space to be explored but to be accessed<br />
by car from the conveniently located trunk road<br />
network. By extension, making social<br />
connections with local residents outside the<br />
gates may be equally liable to associations with<br />
dubiety.<br />
Atkinson and Flint (2004) argue that gated<br />
communities are not only an example of<br />
residential segregation but are also symbolic of<br />
a contemporary turn towards segregation and<br />
social withdrawal which necessitate urgent policy<br />
intervention:<br />
In contrast to the view that gated communities<br />
provide an extreme example of residential<br />
segregation we go further and argue that the<br />
time-space trajectories of residents suggest a<br />
dynamic pattern of separation that goes beyond<br />
the place of residence. Gated communities<br />
appear to provide an extreme example of more<br />
common attempts by other social groups to<br />
insulate against perceived risk and unwanted<br />
encounters. Patterns of what we term timespace<br />
trajectories of segregation can thereby be<br />
seen as closed linkages between key fields, such<br />
as work and home, which enable social distance<br />
to be maintained and perceived risks to be<br />
managed by elite social groups. We conclude<br />
that gated communities further extend<br />
contemporary segregatory tendencies in the city<br />
and that policy responses are required which<br />
curtail the creation of such havens of social<br />
withdrawal. (Atkinson and Flint, 2004:875)<br />
The gated community: the policy conflict<br />
The emergence of a policy discourse on gated<br />
communities raises concerns about the<br />
objectives of the local planning community.<br />
MacLeod (2004:20) reports that “some<br />
commentators imply a causal link between<br />
gating and social exclusion”. By granting<br />
planning permission for a gated development,<br />
regardless of any clauses that may have been<br />
associated with the permission to help assuage<br />
negative impacts, brings into doubt the vision of<br />
the local planning authority. (It is understood<br />
that when permission was granted for the<br />
developer to demolish the existing pub and build<br />
apartments on the land, an agreement was<br />
made for the housebuilder to provide a new pub<br />
in Barton. Subsequently, the building company<br />
abandoned plans to build the new pub.<br />
Negotiations between the local authority and<br />
developer were on-going during the research<br />
period and it has since been reported that an<br />
agreement has been reached whereby the<br />
housebuilder will pay £140,000 of the £300,000<br />
required to refurbish the sports pavilion on<br />
Barton’s recreation ground. The balance of<br />
funding will be sought through an application to<br />
the National Lottery Fund. (Sources: Oxfordshire<br />
County Council website www.oxfordshire.gov.uk<br />
and “Developer will help fund £300k<br />
refurbishment” Oxford Times/Oxford Mail<br />
website www.thisisoxfordshire.co.uk accessed<br />
220105).<br />
Oxfordshire County Council’s social inclusion<br />
scrutiny review clearly states that promoting<br />
social inclusion is a key role of the authority:<br />
‘Social inclusion’ is not just ‘jargon’, but refers to<br />
the core work of the Council: helping people to<br />
fulfil their potential and to overcome the<br />
disadvantages that they might face. It is vital<br />
World Transport Policy & Practice________________________________________________________<br />
Volume 13.1 September 2006<br />
32
that good quality services are provided to all<br />
people, especially those who are potentially<br />
vulnerable and need support. Social exclusion,<br />
whether through low income, poor educational<br />
achievement, illness and disability, isolation or<br />
other circumstances, is a loss to the whole<br />
community, and as a Council we have a<br />
responsibility to tackle both the causes of social<br />
exclusion as well as the outcomes. (Oxfordshire<br />
County Council, 2004:3)<br />
However, the report goes on to reveal that it<br />
found a need to weave social inclusion issues<br />
through all Council policy and activity. It was<br />
critical of the lack of a corporate social inclusion<br />
strategy, a deficit of resources to coordinate<br />
social inclusion promotion, the absence of a<br />
joined-up approach to social inclusion and<br />
expressed a need for greater corporate<br />
commitment to the social inclusion:<br />
The Review found that although many officers<br />
were committed to broad principles of social<br />
inclusion, there was not a common<br />
understanding of what that meant to the<br />
Council, or what the Council’s aims were for<br />
disadvantaged people. There is insufficient lead<br />
from the Executive or the County Council’s<br />
Senior Management Team on co-ordinating<br />
social inclusion activity or providing a strategic<br />
focus. This makes it harder for individual service<br />
managers and officers to pursue social inclusion<br />
activity, or to get guidance on their social<br />
inclusion priorities. (Oxfordshire County Council,<br />
2004:3)<br />
Given the above, there may be an unintentional<br />
lack of awareness of the ways in which a gated<br />
community may impact a local community<br />
negatively amongst the planning officers of the<br />
Council. It is imperative against such a<br />
background that empirical studies of impacts of<br />
new types of developments should be carried<br />
out and findings fed back into future decisionmaking<br />
within the Council as well as being<br />
shared with other authorities. Evidence-based<br />
planning can do much to preclude the negative<br />
impacts of decisions that have not taken full<br />
account of consequences on the wider<br />
community. Pressure from developers to secure<br />
land adjacent to road networks and pressure on<br />
planners to secure investment in road<br />
improvements by developers can cloud<br />
judgement, obscuring professional sensitivity to<br />
softer impacts which may have more farreaching<br />
effects on local people. In this case,<br />
such as sanctioning the socially exclusionary use<br />
of land formerly occupied by the only pub on the<br />
estate. The absence of a local pub precipitates<br />
the need to travel away from Barton to go to a<br />
pub and the closure of the pub has removed one<br />
of the only spaces for social gathering from the<br />
neighbourhood.<br />
Along the road from “Jazz” is “Renaissance Park”<br />
another Barratt Homes development, not gated<br />
but also marketed with a distinct emphasis on<br />
its convenience for access to the inter-urban<br />
road network:<br />
An appealing development…with access to the<br />
M40 – London and Birmingham – A40 to<br />
Whitney (sic)- and Oxford City Centre’<br />
(http://www.barratthomes.co.uk/searchre<br />
s.cfm accessed 281004)<br />
Staying with the issues related to the planners’<br />
decision to allow the gated development and the<br />
neighbouring housing site to go ahead raises<br />
another concern about the apparent<br />
disconnection between the authority’s<br />
statements that it promotes public transport<br />
usage and less dependence on car travel. The<br />
marketing of the two developments makes it<br />
clear that the car-owning public is their target<br />
market. The premise of car-based travel<br />
associated with the new housing runs counter to<br />
the Council’s policy on transport and<br />
development:<br />
Oxfordshire County Council's Structure Plan<br />
reinforces PPG13 - the Government’s planning<br />
policy guidance on transport - by aiming to<br />
reduce the need to travel by private car through<br />
World Transport Policy & Practice________________________________________________________<br />
Volume 13.1 September 2006<br />
33
land use planning policy…More generally, the<br />
Structure Plan policies seek to ensure that<br />
developments are located and designed so as to<br />
be easily accessible by walking, cycling and<br />
public transport. (Oxfordshire County Council,<br />
2000:25)<br />
Oxfordshire County Council's Residential Design<br />
Guide… is intended to inform and guide<br />
developers to provide developments which<br />
encourage more sustainable travel by<br />
minimising the need to use cars particularly for<br />
shorter trips to local facilities. (Oxfordshire<br />
County Council, 2005:ch1 p3)<br />
Arguably, the two housing sites are located “to<br />
be easily accessible” by walking and cycling:<br />
that is, if one does not feel uncomfortable<br />
walking through underpasses to access facilities<br />
outside the estate, having to dismount from a<br />
bicycle to use an underpass or face the<br />
challenge of negotiating large volumes of<br />
circulating traffic at the Headington Roundabout<br />
– a large junction where the volume of interurban<br />
traffic transiting the roundabout has led to<br />
reports of delays of up to 20 minutes for traffic<br />
exiting the Barton arm of the junction at peak<br />
times (Rajé, 2004). Similarly, both<br />
developments are near to bus stops. However,<br />
the buses pass these stops as they enter the<br />
estate and passengers boarding here would have<br />
to travel through several other streets on their<br />
journey back to the main roundabout, out of<br />
Barton and on towards Oxford city centre. It<br />
should also be pointed out that the buses only<br />
operate along one route from Barton, to Oxford<br />
and on to Kidlington, resulting in the need for<br />
interchange to access some destinations, while<br />
others, often relatively nearby geographically,<br />
are effectively inaccessible by bus. Therefore,<br />
the private car again becomes the most suitable<br />
solution to the in-migrant’s transport needs. It<br />
also protects him from perceived potential perils<br />
beyond the gates of his manufactured<br />
community.<br />
However, despite the actions of the developer,<br />
Barratt, in overtly marketing these properties in<br />
terms of their proximity to the inter-urban road<br />
network and the concealment of the<br />
development’s location under guises such as<br />
“Headington” and “Northway” rather than Barton<br />
(which can only serve to undermine the fabric of<br />
the local community), the house builder<br />
promotes itself as “Britain’s leading urban<br />
regenerator” (The Oxford Times, 06 May 2005:<br />
47). In an article entitled “Barratts regenerate<br />
local brownfield sites”, a mythology of intention<br />
appears to be peddled:<br />
House builder Barratt…is transforming derelict<br />
land and recycling redundant buildings to create<br />
new communities around the UK…Barratt<br />
Maidenhead has successfully transformed the<br />
former site of the derelict Fox pub, in Northway,<br />
Oxford, into its stylish and popular Jazz<br />
development…<br />
‘We have successfully recycled all kinds of sites,<br />
which have made good use of valuable land<br />
resources, helped to meet the strong demand<br />
for new homes and also brought life back to<br />
urban areas, producing a wide range of benefits<br />
for local communities and the<br />
environment…Regeneration can reduce the need<br />
for new infrastructure, produce sustainable<br />
residential developments and help re-form<br />
communities nearer their workplaces, lessening<br />
car dependency.’ (The Oxford Times, 06 May<br />
2005: 47)<br />
Despite the noble aims expressed by Barratt<br />
group chief executive, David Pretty, in the quote<br />
above, this research indicates that a small<br />
community of car-dependent professional<br />
commuters are likely to live in the gated<br />
development. Working away from the area, they<br />
would have little opportunity to mix with anyone<br />
beyond the gates and local people would gain<br />
nothing by having the new residents living in<br />
their neighbourhood.<br />
World Transport Policy & Practice________________________________________________________<br />
Volume 13.1 September 2006<br />
34
How this development may bring life back to this<br />
peripheral urban area or produce a wide range<br />
of benefits for the local community and<br />
environment is not readily apparent. <strong>What</strong> does<br />
appear to emerge, instead, is a causative<br />
connection between the proximity of the urban<br />
road network and the availability of brownfield<br />
land to be developed under the guise of<br />
regeneration. If lessening car dependency was<br />
truly the developer’s objective, a site with<br />
greater propinquity to the public transport,<br />
cycling and walking networks would have been<br />
more attractive. Thus, in a competitive and<br />
highly-lucrative housing market, the road<br />
network enables exploitative development to<br />
take place, that is, development that goes<br />
against the principles of social and<br />
environmental sustainability. This raises<br />
concerns about the acceptability of such<br />
enclaves in an area which has already been<br />
singled out as in need of regeneration (i.e. in<br />
need of the development of a sustainable<br />
community). It would appear that rather than<br />
contributing to the regeneration of Barton, this<br />
is an example of selective social exclusion with<br />
the transport system allowing enclave-dwellers<br />
the flexibility to look beyond their own locality<br />
for social, employment and other life<br />
opportunities.<br />
Conclusion<br />
In summary, the granting of permission to build<br />
a gated community in a deprived neighbourhood<br />
may be interpreted as a form of complicity<br />
between institutional actors, house builder and<br />
local planning authority, in perpetuating and<br />
extending socially divisive and exclusionary<br />
features in the built environment. To local<br />
people, planning decisions such as this imply a<br />
lack of engagement of public service providers<br />
with estate communities. Residents feel, as a<br />
result, that decisions have been imposed upon<br />
them with little understanding of their<br />
circumstances and that they have little or no say<br />
in decisions about their neighbourhood. As a<br />
result, the local authority may become<br />
associated with the arbitrary exercise of power<br />
on an estate, rather than being seen as on the<br />
side of the residents (Page, 2000).<br />
References<br />
Atkinson, R. and J. Flint (2003). Fortess UK?<br />
Gated communities, the spatial elites and the<br />
time-space trajectories of segregation. Gated<br />
Communities: Building Social Division or Safer<br />
Communities?, Department of Urban Studies,<br />
University of Glasgow, September 18-19.<br />
Atkinson, R. and J. Flint (2004). "Fortress UK?<br />
Gated communities, the spatial revolt of the<br />
elites and time-space trajectories of<br />
segregation." Housing Studies 19(6): 875-892.<br />
Crossley, A. (1979). A History of the County of<br />
Oxford - Vol. IV: The city of Oxford. Oxford.<br />
Graham, S. and S. Marvin (2001). Splintering<br />
Urbanism: networked infrastructures,<br />
technological mobilities and the urban condition.<br />
Abingdon, Routledge.<br />
Jürgens, U. and M. Gnad (2002). "Gated<br />
communities in South Africa - experiences from<br />
Johannesburg." Environment and Planning B:<br />
Planning and Design 29(3): 337-353.<br />
MacLeod, G. (2004). Privatizing the city? The<br />
tentative push towards edge urban<br />
developments and gated communities in the<br />
United Kingdom: Final Report for the Office of<br />
the Deputy Prime Minister. London, University of<br />
Durham.<br />
Oxford Times (2005). Barratts regenerate local<br />
brownfield sites. 06 May 2005.<br />
Oxfordshire County Council (2000). Oxfordshire<br />
Local Transport Plan (2001-2006). Oxford,<br />
Oxfordshire County Council.<br />
Oxfordshire County Council (2004). Are we<br />
included? Why not?: Social Inclusion Scrutiny<br />
Review. Oxford, Oxfordshire County Council.<br />
Oxfordshire County Council (2005). Transaction:<br />
World Transport Policy & Practice________________________________________________________<br />
Volume 13.1 September 2006<br />
35
Local Transport Plan for Oxfordshire 2006-<br />
2011(Draft 11/04/05). Oxford, Oxfordshire<br />
County Council.<br />
Rajé, F. (2004). "Engineering Social Exclusion?<br />
Poor transport links and severance." Municipal<br />
Engineer 157(ME4): 267-273.<br />
Page, D. (2000). Communities in the balance:<br />
the reality of social exclusion on housing<br />
estates. York, Joseph Rowntree Foundation.<br />
Address for correspondence:<br />
fraje@ouce.ox.ac.uk<br />
World Transport Policy & Practice________________________________________________________<br />
Volume 13.1 September 2006<br />
36
Effects of pedestrianisation on the commercial and<br />
retail areas:<br />
Study in Khao San Road, Bangkok<br />
Santosh Kumar & William Ross<br />
Introduction<br />
Cities are becoming increasingly car dependent<br />
and are rapidly being redesigned to make car<br />
travel easier. Developing countries are framing<br />
policies that will encourage motorised travel with<br />
a consequent reduction of non-motorised<br />
modes. These policies seldom consider the<br />
urban poor and the more vulnerable transport<br />
users such as pedestrians and cyclists.<br />
Outside of newly built, gated residential and<br />
commercial areas, improved car access has<br />
generally resulted in poorer access for walkers<br />
(Ravetz, 1980). The amount of space devoted to<br />
the car in terms of road and car parking has<br />
grown throughout the twentieth century,<br />
although it is not commensurate with the<br />
increase in road traffic. The increase in the car<br />
dependant nature of neighbourhoods has<br />
reduced the business of small shops within the<br />
neighbourhoods as the large department stores<br />
are easily accessible by car and also provide<br />
sufficient, usually free, parking. This car friendly<br />
change in neighbourhood design encourages<br />
people to drive more for a trip that could often<br />
be fulfilled by a walk within the neighbourhood.<br />
Higher road traffic levels also had major impacts<br />
on the levels of social interaction and community<br />
connectedness at the neighbourhood levels<br />
(Ross, 1999). From a study in San Francisco, it<br />
was found that the community interactions were<br />
more in areas with less traffic and people had<br />
more chance to meet and had good social<br />
activities in these areas (Whitelegg, 1993;<br />
Appleyard, 1981).<br />
In order to obtain the positive effects for the<br />
community, several car restraining measures<br />
have to be implemented. These measures<br />
include economic instruments and physical<br />
Plate 4: Khao San Raod during the night<br />
bustling with visitors<br />
changes through traffic calming.<br />
Pedestrianisation and traffic calming have<br />
proven to be effective measures of improving<br />
lifestyle and safety to the residents. A study of<br />
traffic calming areas in the UK showed that<br />
there was a 29% reduction in accidents to<br />
cyclists of all age groups and especially for<br />
children where the figures fell by 48%. The<br />
study also found an overall accident reduction of<br />
60% after implementing traffic calming (Weber<br />
and Mackie, 1996 cited by Galway Cycling<br />
Campaign, 1999). Similarly results of large scale<br />
traffic calming project in the Dutch cities,<br />
Eindhoven and Rijswijk, found that the accident<br />
rates were reduced by 80% (Schlabbach, 1997).<br />
Pedestrianisation measures are best undertaken<br />
at a local level. The down side of implementing<br />
is the frequent objections during<br />
implementation. The objections are sometimes<br />
justified since no design method is without<br />
problems (Roberts, 1981). Local businesses<br />
frequently object as they feel that<br />
pedestrianisation removes the business from<br />
passing traffic. This perception has been proven<br />
wrong by various studies (Hass-Klau, 1993;<br />
Drennen, 2003; Kumar, 2006).<br />
World Transport Policy & Practice________________________________________________________<br />
Volume 13.1 September 2006<br />
37
Pedestrian areas are the places with high<br />
walking densities. The walking does not only<br />
denote the purpose of commute but also<br />
represents the way the walkers feel about the<br />
city. People usually have very few places to<br />
meet in a car dependant city; these places<br />
include shopping complexes or conferences.<br />
However, where public spaces are more<br />
attractive then an increased meeting of people<br />
in these precincts can be noticed, Central-<br />
European countries provide good examples of<br />
public precincts. The success of a city centre<br />
cannot only be understood from an idea of<br />
reducing traffic problems but increasingly from<br />
the amount of people who benefit from them in<br />
a recreational way (Monheim, 1992).<br />
The dramatic change that pedestrian precincts<br />
have brought to some cities in Europe can be<br />
inferred from high pedestrian volumes and also<br />
from the new businesses and shopping malls<br />
developing in these city centres (Monheim,<br />
2001).<br />
Pedestrianisation has a positive effect on the<br />
businesses in the area of implementation. The<br />
effect is usually in the form of increased<br />
turnover, increased property values and streets<br />
attracting the wealthier, thereby benefiting the<br />
overall retail sales and drawing economic<br />
advantage to the area (Sermons and Seredich,<br />
2001; Hass-Klau, 1993). Pedestrianisation also<br />
encourages local people to buy utilities in their<br />
own neighbourhoods and attracts more<br />
customers from a wider area, increasing the<br />
community relations (Ross, 1999; Kumar,<br />
2005).<br />
Poor pedestrian, cycling and transit options can<br />
harm businesses by losing the worker potential.<br />
Investment in pedestrian programs is llittle and<br />
sometimes nil. These projects often require<br />
minimal time for construction and most do not<br />
require any financial support from business<br />
owners. Litman (2004) summarised the various<br />
effects of walking in a community (see Table 1).<br />
Table 1: Effects of walking in a community<br />
Description Criteria Measuring Techniques<br />
Accessibility Closeness to goods,<br />
and Savings services and activities,<br />
public transportation, cost<br />
savings<br />
Health<br />
Amount of active<br />
transportation and net<br />
impacts on public health<br />
Efficient Land More efficient land use<br />
use<br />
associated with more non<br />
motorised transportationoriented<br />
land use<br />
patterns.<br />
Liveability The quality of the local<br />
environment and<br />
community interactions<br />
<strong>Eco</strong>nomic Impact on commercial<br />
Development establishments and shift<br />
in consumer expenses<br />
(Source: Litman, 2004)<br />
Extent that non motorised<br />
transit providing mobility for<br />
transit poor<br />
Physical exercise provided to<br />
usually inactive people<br />
The level of car oriented<br />
infrastructure i.e. more roads<br />
or overpasses for cars<br />
Change in appeal of the<br />
implemented areas<br />
Change in sales in the<br />
commercial sectors and the<br />
decrease in expense for fuel<br />
and vehicle.<br />
Travel Modelling, analysis of travel<br />
options, consumer expenditure<br />
surveys<br />
Travel and Health Surveys to<br />
determine the number of people<br />
who benefit from walking exercise<br />
Identifying the social, economic<br />
and environmental benefits of<br />
more non motorised<br />
transportation-oriented land use<br />
Property values, business<br />
activities, consumer preference<br />
surveys.<br />
Market surveys and property<br />
assessments.<br />
World Transport Policy & Practice________________________________________________________<br />
Volume 13.1 September 2006<br />
38
Citing the above reasons it can be said that<br />
pedestrian precincts increase economic<br />
productivity, employment, business activity,<br />
investment and other kinds of economic<br />
development. Customers place high value<br />
onpedestrian environments such as retail malls,<br />
suburban office campuses and pedestrianoriented<br />
resort communities. Pedestrianised<br />
commercial areas can be very important in<br />
increasing the liveability and friendly<br />
environments that attract residents and visitors<br />
(USEPA, 2004). Placing café seating on<br />
sidewalks widening the footpaths and increasing<br />
the greenery near the store fronts can increase<br />
the appeal and attract the pedestrian/potential<br />
customers.<br />
According to a study of more than 100<br />
pedestrianised cities worldwide, it was found<br />
that the turnovers in the city centres of these<br />
cities increased in 49% of the cities and<br />
remained stable in 25%. Cities in Austria,<br />
Germany and Scandinavia experienced increase<br />
in turnover of more than 60% (OECD, 1978).<br />
There have been several studies conducted in<br />
many parts Europe and the US but very few or<br />
almost none have been done in the Asian<br />
developing cities. Hence, this study focussed on<br />
the effects of pedestrianisation on the retailing<br />
and commercial community of Bangkok. Khao<br />
San Road, a partially pedestrian street in<br />
Bangkok, was selected to investigate the effect<br />
that pedestrianisation had on the businesses and<br />
the way the business community felt since<br />
pedestrianisation. The results documented in<br />
this paper will focus on the changes in sales<br />
volumes, opinion of retailers on<br />
pedestrianisation since implementation of the<br />
project, their opinions on the existing timings<br />
and their stance on future improvement of the<br />
project. The results will help in further<br />
developing the project and also replicating the<br />
study with recommendations in the other areas<br />
of Bangkok which can help in increasing the<br />
sales of the small businesses and also enhance<br />
the liveability of the area.<br />
Background of the study<br />
Bangkok has a rich cultural past and is a famous<br />
tourist destination. The growing economy of the<br />
country led to an improvement in lifestyle and<br />
an increase in vehicle numbers. Areas in<br />
Bangkok are filled with noise and emissions from<br />
automobiles. Everyday in Bangkok nearly 600<br />
new cars are added to the roads making an<br />
extra 3 kilometres of bumper-to-bumper traffic<br />
(Kenworthy, 2003).<br />
Bangkok has a very impressive mixture of land<br />
use compared to similar western cities with high<br />
car dependency. Commercial, residential and<br />
retail facilities are usually within a walkable<br />
distance (Newman and Kenworthy, 1989).<br />
However, Bangkok’s very high motor friendly<br />
infrastructure, with generous parking facilities,<br />
wide roads and flyovers act as a catalyst for<br />
increasing car dependency (Poboon, 1997).<br />
Walking and cycling characteristics in Bangkok<br />
are very bleak with only 13% of the work trips<br />
on these modes while the other Asian countries<br />
have an average of 34% (Newman and<br />
Kenworthy, 1999). The low levels of walking and<br />
cycling are due to the safer and more pleasant<br />
conditions for car travel (Kumar, 2006).<br />
Kenworthy (2003) recommended that if priority<br />
is given to improving pedestrian and cycling<br />
conditions in Bangkok, there will be a significant<br />
shift from car to other modes. Apart from<br />
initiating a modal shift there are other affects of<br />
pedestrianisation, it can bring economic benefit<br />
to the retailers on the pedestrianised area.<br />
World Transport Policy & Practice________________________________________________________<br />
Volume 13.1 September 2006<br />
39
Plate 1: Pedestrianised Khao San Road<br />
As a strategy to develop pedestrian areas<br />
Bangkok Metropolitan Authority (BMA) has<br />
initiated pedestrianisation schemes in some<br />
commercial areas. One such area is the famous<br />
Khao San Road (Plate 1). It is a street located in<br />
the Banglampoo district of Bangkok (Figure 1).<br />
It is a famous destination for many local and<br />
foreign travellers and backpackers. The location<br />
is apt for backpackers as it provides cheap<br />
lodging and boarding facilities. Apart from the<br />
motels, Khao San Road has food stalls, travel<br />
agencies, souvenir and music shops. The road<br />
has been pedestrianised as part of government<br />
policy with the help of the local police station.<br />
The Tourism Authority of Thailand (TAT) helped<br />
in promoting the project. The project was<br />
implemented in the year 2001 (C Kaewumporn<br />
2006, pers. comm., 23 February) and another<br />
reason for implementation was the increasing<br />
traffic jam on the street.<br />
Figure 1: Map of Khao San Road<br />
Pedestrianisation has been implemented in some<br />
areas of Bangkok but the outcomes of the<br />
projects were never studied. Hence this study<br />
attempted to fill the vacuum of the outcome of<br />
pedestrian projects. The study investigated the<br />
response of the small business owners in Khao<br />
San Road upon the effect of pedestrianisation on<br />
their business turnover and their view on<br />
World Transport Policy & Practice________________________________________________________<br />
Volume 13.1 September 2006<br />
40
pedestrianisation before and after<br />
implementation. For this study, the businesses<br />
in Khao San road have been categorised viz.<br />
Restaurants, shops, guest houses, and travel<br />
agencies and samples were taken through<br />
stratified random sampling method. The data<br />
was collected by means of a questionnaire which<br />
focussed on the economic changes since<br />
pedestrianisation. The obtained results have<br />
been interpreted using SPSS 13.0.<br />
Study site, sampling and sample size<br />
Khao San Road in Bangkok, the study site, is a<br />
famous destination for foreign backpackers as it<br />
offers a wide range of services along with<br />
reasonably priced accommodation. The road is<br />
currently pedestrianised during specific hours of<br />
the day. During non-pedestrian hours, on-road<br />
parking is available making the street narrow.<br />
There is a high frequency of taxis and tuk-tuk's<br />
on the road. Public transport cannot be found on<br />
the road mainly due to its size, but there are bus<br />
stops near to Khao San Road which are easily<br />
accessible on foot.<br />
Khao San Road has a wide diversity of retail<br />
shops. For this study all shops that were present<br />
before implementing pedestrianisation and after<br />
pedestrianisation have been considered.<br />
According to pre-survey results it was found that<br />
there were about 100 guest houses, 125 food<br />
stalls, 20 travel agencies and 120 shops selling<br />
music, souvenirs, and textiles.<br />
A stratified random sampling method was used<br />
in selecting the samples. Neuman (2003)<br />
suggests that for a study with a population<br />
under 1000, the required sample size has to be<br />
more for accuracy hence a sample size of about<br />
30% is suggested, and for a moderately larger<br />
populations (about 10,000) the sample size can<br />
be about 10% and for populations over 150,000<br />
the sample size ratio can be 1%. For this study,<br />
the shops in Khao San road have been divided<br />
into categories (Table 2) viz. Restaurants,<br />
shops, guest houses, and travel agencies and<br />
the respective samples have been considered.<br />
Table 2: Population and sample size of the study<br />
Type of Shop Population Sample Size<br />
Food stalls 125 38<br />
Shops 120 36<br />
Guest houses 100 30<br />
Travel Agencies 20 06<br />
Total 365 110<br />
Results of the Study<br />
The following section discusses the results<br />
obtained from the questionnaire survey. The<br />
research was carried out during the months of<br />
September and October 2005 and mainly<br />
focussed on the changes in business activity,<br />
linking these changes to changes in the<br />
liveability of the area. Other studies<br />
(Appleyard,1981; OECD,1990; Hass-Klau,1993,<br />
Newman & Kenworthy, 1999) have shown that<br />
the implementation of traffic calming in<br />
residential areas and the pedestrianisation of<br />
Figure 2: Change in sales volume of retailing shops<br />
retail areas will improve amenity and liveability<br />
of the affected area. For the purpose of this<br />
World Transport Policy & Practice________________________________________________________<br />
Volume 13.1 September 2006<br />
41
esearch, liveability is expressed in the quality of<br />
the local environment which will act as an<br />
attractor of customers to the businesses in the<br />
area. As stated in the Table 1, the changes in<br />
sales volume and rental values were considered<br />
to be good indicators of improved business<br />
activity resulting from improved liveability.<br />
Other things being equal, improvements in these<br />
indicators can be attributed to an improvement<br />
in the local pedestrianised environment.<br />
Changes in sales volume<br />
Sales volume is the sales volume of a retail shop<br />
in a specified period of time. The sales volume<br />
depends on various factors such as the<br />
economic condition of the country or the area<br />
and the amount of activity in the area. The<br />
number of customers to the area is a direct<br />
factor affecting the sales volume. If the area can<br />
attract more visitors then the shops in the<br />
location will have more potential customers.<br />
Pedestrianisation tends to increase the sales<br />
volume as it attracts more visitors to the area of<br />
implementation (Plate 2). Even though the<br />
economic condition of the country is good and<br />
rising, unappealing areas don’t attract visitors<br />
increased after the project, people like to walk<br />
and shop...” replied one restaurant owner, while<br />
35% said that their sales volume had not<br />
changed, “...my business has not changed<br />
much…because of the footpath shops..” said a<br />
souvenir shop owner. The reason for this can be<br />
attributed to the location of the shop which was<br />
away from the mainstream pedestrian area and<br />
also because of the services the shop offered. A<br />
few guest houses in the study were located<br />
inside “soi’s” or lanes lacking direct contact with<br />
the mainstream of the pedestrian activity.<br />
“...the guest house is away from the main road<br />
so not much affect but the tourists have to walk<br />
with their luggage...” said a guest house<br />
manager. It has been found that the<br />
establishments which benefited the most were<br />
the food and souvenir shops. It can be noted<br />
from the activity of the street that not only<br />
foreign tourists avail the retailing service, but<br />
also the local Thai people buy from the shops on<br />
Khao San Road.<br />
Changes in the Property/Rental Values<br />
Plate 2:More customers is more sales<br />
resulting in business closures in that area (Colin<br />
Buchanan and Partners, 2001). Pedestrianisation<br />
can remedy such a situation.<br />
In the current study the respondents were asked<br />
about the status of their sales volume. About<br />
47% (Figure 2) of the respondents replied that<br />
their sales volume had increased, “Sales<br />
Figure 3: Change in the Rental Values<br />
Fluctuation in rental values in a commercial area<br />
mainly depends upon the amount of business<br />
done in the area. This sub-section will discuss<br />
the results obtained on the vacillation of rental<br />
values in Khao San Road. The respondents were<br />
questioned about the changes in the rental value<br />
of their business premises. The majority of the<br />
responses (52%) (see Figure 3) expressed “no<br />
World Transport Policy & Practice________________________________________________________<br />
Volume 13.1 September 2006<br />
42
change” in the rental value and 22% replied that<br />
the rental value factor does not apply to their<br />
business. “I don't need to pay rent..” replied a<br />
guest house owner. On the other hand, 26%<br />
reported that their rent had increased.<br />
ranged from as little as 1,000 baht to 2,500<br />
baht to the existing rent. The latest period of<br />
increase in rent noted was for the previous 3<br />
months and the maximum period was for the 3<br />
previous years.<br />
However, the changes in sales volumes<br />
discussed earlier clearly state that there as been<br />
a positive change after pedestrianisation. The<br />
sales volume has not decreased greatly but has<br />
either remained constant or has increased.<br />
Figure 4: Revision of Rents<br />
Similarly, the respondents were asked about the<br />
revision in the rent they pay to the owner and<br />
28% (Figure 4) reported an increase in their<br />
rent, “..my owner increased my rent by 2,000<br />
baht a year back..” replied a tenant retailer,<br />
while the majority of the respondents replied<br />
that the question was not applicable for them.<br />
The major response of “not applicable” is<br />
because the owner of the shop also operates the<br />
business. The respondents who replied that<br />
there was a change in rent were tenants.<br />
According to Thailand laws, the area of Khao<br />
San Road falls under ‘royal property’ and hence<br />
ownership cannot be claimed. The shops located<br />
in this area are under a long lease and the value<br />
is revised every 3 years.<br />
The unusual replies can be explained because<br />
many of the shops were not rented but rather<br />
run by the owners; hence some of the responses<br />
were “does not apply”. In most of the cases, the<br />
owners of the building did not want to increase<br />
the rents and hence there was no change in<br />
rental values. However, some of the landlords<br />
did increase the rents giving rise to the result of<br />
“increased rent”. The increase in the rents<br />
Opinion of retailers on pedestrianisation<br />
Pedestrianising a street requires stakeholder<br />
agreement and in many cases pedestrianisation<br />
projects fail if there is a vacuum in the<br />
consultation process among the stakeholders,<br />
such as the retailers, the police, and municipal<br />
authorities. If there is strong approval from the<br />
stakeholders, the project is more likely to be<br />
successful. In this study the retailers have been<br />
asked about their opinion on pedestrianisation of<br />
Khao San Road.<br />
The study found that before implementation, a<br />
majority of the retailers (Figure 5) believed that<br />
pedestrianisation could not improve the existing<br />
condition and were indifferent to the project. A<br />
retailer replied “why pedestrianise the street?<br />
farang (foreigners) like to come in a car”. It was<br />
also found that 30% disagreed with the idea, as<br />
they believed that pedestrianisation would bring<br />
negative effects to their business (the removal<br />
of cars from the street would also remove their<br />
customers) and disagreed to the project idea;<br />
“...traffic jams are good for the<br />
business....people watch my shop when they are<br />
stuck in the jam...” replied a tailor shop owner.<br />
Among the retailers 20% were optimistic and<br />
felt that the changes pedestrianisation would<br />
bring to their business would be positive and<br />
agreed to the project implementation.<br />
“...remove the cars and the customers will<br />
increase...” replied a restaurant manager.<br />
World Transport Policy & Practice________________________________________________________<br />
Volume 13.1 September 2006<br />
43
Opinion of the current<br />
pedestrian timings and<br />
stance on further<br />
pedestrianisation<br />
Khao San Road is pedestrianised<br />
from 6pm to 3am. Partially<br />
pedestrianising a street in many<br />
cases will not allow the full<br />
potential of pedestrianisation to<br />
be utilised. Partial<br />
pedestrianisation also restricts<br />
other traffic calming benefits,<br />
such as increased liveability and<br />
Figure 5: Opinion of retailers on pedestrianisation project<br />
street appeal, as during the day<br />
the street is just like other<br />
Since pedestrianisation, the majority of the ordinary streets with cars.<br />
retailers (85%) have agreed with the project<br />
while the retailers who disagreed decreased to<br />
just 10%, “..I think no cars means more<br />
customers, now even Thais come and drink...”<br />
replied a pub owner. It has to be noted that the<br />
results obtained are in accord with the general<br />
psychological tendency of retailers around the<br />
world. In other places of pedestrianisation there<br />
are records showing that initially there was a<br />
This study has questioned the respondents<br />
regarding their opinion on the current pedestrian<br />
timing and the results are explained below. The<br />
results from the study revealed that 74% of the<br />
respondents agree or strongly agree to the<br />
current pedestrian timings and required no<br />
change in them (darkened portion of Figure 6).<br />
“A perfect and classic project” replied a retailer,<br />
protest against the project but after while another said “…commercial areas can<br />
implementing there were requests from other<br />
businessmen to implement the project in their<br />
areas. The number of retailers who still disagree<br />
with the project (10%) is related to the kind of<br />
business they hold. In the case of travel agents,<br />
the project might not be effective as the<br />
benefit with this project. My sales increased….”<br />
While 13% of the respondents reported that<br />
they disagreed to the current timing, (among<br />
whom 5% disagreed or strongly disagreed with<br />
the timings and recommended an increase of<br />
the timings to be longer), the rest of the 8%<br />
customer evaluates the quality of service the disagreed or strongly disagreed and<br />
agents provide rather than the accessibility to<br />
the agency itself.<br />
recommended a decrease in the current timings;<br />
“very hard to walk on the street for long<br />
distance, should reduce timings for visitors<br />
convenience.” replied a guest house owner.<br />
World Transport Policy & Practice________________________________________________________<br />
Volume 13.1 September 2006<br />
44
Figure 6: Opinion on the current pedestrian timings<br />
The respondents were also questioned on their<br />
proclivity towards further pedestrianising the<br />
street and implementing other traffic calming<br />
measures. Forty-four percent responded that<br />
they will not participate while 41% (Figure 7)<br />
showed support for the improvement. One<br />
retailer said “Sure my support is there, it<br />
increases the sales and also wide variety of<br />
things to buy” (Plate 4). As with every project<br />
there were also people (15%) who said they will<br />
oppose the idea, “I will not support it if the<br />
garbage condition is worse like now….” said a<br />
retailer. The opposition can be reduced with<br />
proper awareness among the stakeholders.<br />
Figure 7: Stance on further pedestrianisation<br />
Conclusion<br />
Earlier studies found that the implementation of traffic calming measures, including pedestrianisation, will<br />
reduce traffic speeds and accidents and thus make the streets safer and more pleasant places to be. The<br />
current study, conducted in Khao San Rd, Bangkok, Thailand, has shown that traffic calming can also<br />
have a positive economic benefit for the retailing and commercial community by increasing sales<br />
volumes. Furthermore, as indicated by increased property/rental values and business activity as well as<br />
by the preference of consumers as expressed in surveys, the liveability of the area is also improved. The<br />
current study also found that retailers were positively inclined towards further pedestrianisation in the<br />
area.<br />
It is also suggested that while implementing the project, sufficient care must be taken in providing<br />
enough garbage disposal facilities and efficient collection measures so that as visitor numbers increase<br />
the appeal of the road will not be diminished by litter.<br />
World Transport Policy & Practice________________________________________________________<br />
45<br />
Volume 13.1 September 2006
This study has shown that the argument often put forward by retailers that their customers need car<br />
access (presumably in order to carry the goods home), is simply not correct. While retailers in Khao San<br />
Rd were initially sceptical of the pedestrianisation project, few were opposed to extending the project<br />
once they had experienced its benefits. In a city as dominated by cars as Bangkok, Khao San Rd has<br />
become an oasis for both foreigners and Thai people seeking refuge from the noise, dangers and pollution<br />
of cars.<br />
References<br />
Appleyard D, 1981, Liveable Streets, University<br />
of California Press, Berkeley, , ,<br />
Colin Buchanan and Partners, 2001, Kensington<br />
High Street Study, Colin Buchanan and<br />
Partners, London<br />
Drennen E., 2003, <strong>Eco</strong>nomic Effects of Traffic<br />
Calming on Small urban Businesses,<br />
Department of Public Administration, San<br />
Francisco University, December 2003,<br />
Masters Thesis,<br />
Galway Cycling Campaign, 1999, /Area Wide<br />
Traffic Calming,/ Galway Cycling<br />
Campaign -Feachtas Rothaiochta na<br />
Gaillimhe, April, 1999. Available at:<br />
http://www.eirbyte.com/gcc/info/calming.<br />
html#_edn1<br />
Hass-Klau C, 1993, Impact of Pedestrianisation<br />
and Traffic Calming on Retailing: A Review<br />
of the evidence from Germany and UK,<br />
Transportation Policy, Vol. 1, Issue 1, pp.<br />
21-31<br />
Kenworthy J, 2003, Automobile Dependency in<br />
Bangkok: An International Comparison<br />
with Implications for Planning Policies,<br />
World Transport Policy and Practice, Earth<br />
Scan, London<br />
Kumar K.S, 2005, Benefits of Traffic Calming<br />
and Scope for its Application in Bangkok,<br />
Paper and Poster presented at the Road<br />
Safety for Four Continents (RS4C)<br />
Conference, Warsaw, Poland, 5-7 October,<br />
2005<br />
Kumar K.S, 2006, Retailers, Pedestrianisation<br />
and Khao San Road, Masters Thesis,<br />
Mahidol University, Thailand<br />
Litman T, 2004, <strong>Eco</strong>nomic Value of Walkability,<br />
Victoria Transport Policy Institute, Canada<br />
Monheim R, 2001, The Role of Pedestrian<br />
Precincts in the Evolution of German City<br />
Centres from Shopping to Urban<br />
Entertainment Centres, Presented at<br />
Walking the 21st Century Conference in<br />
Perth WA, pp. 44 -54<br />
Monheim R, 1992, The importance of<br />
accessibility for downtown retail and its<br />
perception by retailers and customers,<br />
The attraction of retail locations, IGU-<br />
Symposium, Vol. I, Kallmünz/Regensburg:<br />
Verlag M. Laßleben. 19- 46<br />
Newman P and Kenworthy J, 1989, Cities and<br />
Automobile Dependence: An International<br />
sourcebook, Gower, Aldershot<br />
Newman P and Kenworthy J, 1999,<br />
Sustainability and Cities: Overcoming<br />
Automobile Dependence, Island Press,<br />
Washington DC<br />
OECD, 1990, Environmental Policies for cities in<br />
1990’s, OECD, Paris<br />
OECD, 1978, Results of a Questionnaire Survey<br />
on Pedestrian Zones in Paris, OECD, Paris<br />
Poboon C, 1997, Anatomy of a Traffic Disaster:<br />
Towards a Sustainable Solution to<br />
Bangkok’s Transport Problems, PhD<br />
Thesis, Murdoch University, Perth,<br />
Western Australia<br />
Ravetz A, 1980, Remarkable Cities:<br />
Contradictions of the Recent Urban<br />
Environment, Croom Helm, London<br />
Roberts J, 1981, Pedestrian precincts in Britain,<br />
Transport and Environmental Studies,<br />
London<br />
Ross W, 1999, Personal mobility or community<br />
accessibility: a planning choice with social<br />
economic and environmental<br />
consequences, PhD Thesis, Institute of<br />
Sustainability and Technology Policy,<br />
Murdoch University, Western Australia,<br />
Australia<br />
World Transport Policy & Practice________________________________________________________<br />
Volume 13.1 September 2006<br />
46
Schlabbach K, 1997, Traffic Calming in Europe,<br />
ITE Journal, July, 1997. Available at:<br />
http://www.ite.org/traffic/documents/JGA<br />
97A38.pdf<br />
Sermons and Seredich, 2001, Assessing<br />
Traveller Responsiveness to Land and<br />
Location based Accessibility and Mobility<br />
solutions, Transportation Research Part D:<br />
Transport and Environment, Vol.6, Issue.<br />
6, pp. 417-428<br />
USEPA, 2004, Characteristics and Performance<br />
of Regional Transportation Systems,<br />
Smart Growth Program, US Environmental<br />
Protection Agency Available at<br />
http://www.epa.gov/dced/<br />
CharPerm_RTS.htm, Retrieved on June<br />
17th, 2005<br />
Whitelegg J, 1993, Transport for sustainable<br />
future: The case of Europe. Belhaven<br />
Press, London<br />
Address for correspondence:<br />
sunnysanthosh@gmail.com<br />
World Transport Policy & Practice________________________________________________________<br />
Volume 13.1 September 2006<br />
47
Questionnaire for studying the impact of pedestrianisation on the business owners in Khao San Road<br />
Date of Interview : ___________________ Business Type: FS/SH/GH/TA (FS: Food stall,<br />
SH: Ordinary Shop, GH Guest House, TA travel<br />
agency)<br />
Number of years doing the business in KSR: ________________<br />
1. <strong>What</strong> was your opinion when the project was proposed? Did you think there will be an impact on<br />
the business because of pedestrianisation: Yes / No<br />
Please explain ___________________________________________________<br />
2. <strong>What</strong> were the opinions of your co-businessmen in Khao San Road about<br />
pedestrianisation at the time of implementation? _________________<br />
3. In your opinion do you feel that the footpath shops are an obstacle for your<br />
business: Yes / No / Does not concern<br />
4. Do you derive any benefit from the footpath shops: Yes / No.<br />
Please explain ___________________________________________<br />
Effect on <strong>Eco</strong>nomic Variables<br />
5. <strong>What</strong> is your opinion on the following after applying pedestrianisation?<br />
Increase Reduce<br />
No Change<br />
i. Change is sales volumes □ □ □<br />
ii. Change in the rental/property values □ □ □<br />
6. When was the last time that your rent was revised? ___________ (Increased/Decreased)<br />
7. <strong>What</strong> is your opinion on the current pedestrian timings in Khao San Road?<br />
□ Strongly Agree □ Agree □ Indifferent<br />
□ Disagree (Increase / Decrease)<br />
□ Strongly Disagree (Increase / Decrease)<br />
8. <strong>What</strong> role will you play if more pedestrian friendly measures are implemented in Khao San Road<br />
and the nearby areas?<br />
□ Support □ Protest □ will not participate<br />
9. <strong>What</strong> will be your recommendation to other commercial areas in Bangkok in regard to<br />
pedestrianisation? ______________________________________________<br />
10. Any other comments or suggestions:<br />
World Transport Policy & Practice___________________________________________________<br />
Volume 13.1 September 2006<br />
48
Cycling for active transport<br />
and recreation in Australia:<br />
Status review and future<br />
directions<br />
Rissel C, Garrard J<br />
Introduction<br />
An important priority for health<br />
promotion in the 21 st century is<br />
increasing the levels of physical activity<br />
for whole populations. Physical inactivity<br />
is the second (after tobacco smoking)<br />
most important behavioural cause of illhealth<br />
in society (AIHW, 1999). The<br />
majority of adult Australians are not<br />
physically active at the level<br />
recommended to achieve health benefits<br />
(AIHW, 2004). Physical inactivity is a<br />
major modifiable risk factor for<br />
cardiovascular disease (CVD) and<br />
independently affects other CVD risk<br />
factors such as type II diabetes, total<br />
blood-cholesterol level, obesity and<br />
hypertension (USDHH, 1999; Bauman<br />
and Owen 1998).<br />
The energy expenditure to achieve<br />
population level increases in physical<br />
activity levels is most likely to be<br />
sustained if incorporated into daily<br />
routines. Therefore, the concept of<br />
‘active transport’ is an important one.<br />
The term ‘active transport’ relates to<br />
physical activity undertaken as a means<br />
of transport (Davis, 1999). This includes<br />
travel by foot, bicycle and other nonmotorised<br />
vehicles (Mason, 2000).<br />
Among the three major active transport<br />
modes (ie public transport, walking and<br />
cycling), cycling is currently the least<br />
used in Australia, although all three have<br />
the potential for substantial increases<br />
(Austroads, 2005).<br />
In Australian state capitals, the<br />
proportion of trips taken by bicycle<br />
ranges from one to five per cent, while<br />
the proportion of Australians owning<br />
bicycles ranges from 30-65 per cent<br />
(Australian Bicycle Council, 2004). In<br />
many European cities the proportion of<br />
trips taken by bicycle is over 25 per cent<br />
of all trips (ADONIS, 1998). Over half<br />
(55%) of car trips in Sydney and other<br />
capitals are less than five kilometres and<br />
33 per cent are less than three<br />
kilometres (NSW Department of<br />
Transport, 1995), distances considered<br />
easily amenable to cycling.<br />
While there are many European<br />
examples of policy and practice that have<br />
contributed to increases in levels of<br />
cycling (Pucher and Dijkstra, 2003),<br />
there is very little Australian research to<br />
provide evidence to policy makers on<br />
effective interventions to promote<br />
cycling. The purpose of this paper is to<br />
review all the published and as much of<br />
the unpublished ‘grey’ Australian<br />
literature that could be found that<br />
addresses the promotion of cycling, and<br />
that has an evaluation component that<br />
allows the identification of effective<br />
interventions or factors that influence<br />
population levels of cycling.<br />
Method<br />
The electronic data-bases MEDLINE,<br />
PUBMED, and APAIS were searched for<br />
the years 1995-2005 using the terms<br />
“cycling”, “cyclist”, “cycl*” and “bicycles”.<br />
The Google internet search engine was<br />
World Transport Policy & Practice___________________________________________________<br />
Volume 13.1 September 2006<br />
49
used to help locate possible reports or<br />
papers that described the evaluation of<br />
interventions to promote cycling. Further,<br />
the authors contacted all major<br />
Australian cycling organisations or<br />
persons active in the promotion of<br />
cycling in Australia to identify<br />
unpublished evaluation reports of cycling<br />
promotion programs.<br />
Papers or reports that focused on the<br />
health benefits of cycling were excluded,<br />
as this has been internationally well<br />
researched with unequivocal results of<br />
the positive health benefits (see for<br />
example papers or articles by<br />
Paffenberger et al (1986), Roberts et al<br />
(1996), Anderson et al (2000), Hu et al<br />
(2003), and Steindorf et al 2003)).<br />
Papers dealing with the use of bicycle<br />
helmets and injury issues were also<br />
excluded, even though the mandatory<br />
wearing of helmets in Australia may<br />
adversely influence population frequency<br />
of cycling (Jacobsen, 2003; Robinson,<br />
2005) by acting as a general, albeit small<br />
deterrent to everyday or casual cycling.<br />
While safety concerns directly impact on<br />
population levels of cycling, the injury<br />
prevention literature is distinct from that<br />
of cycling promotion, and is not included<br />
in this review.<br />
Physiological focused papers on athletic<br />
performance represented more than half<br />
of the articles retrieved from the<br />
literature search. However, articles<br />
dealing with competitive sport and elite<br />
cycling were also excluded, as this area<br />
of cycling is quite specialised and<br />
restricted to a relatively small proportion<br />
of the population. There is much greater<br />
potential for population-wide<br />
participation in cycling and physical<br />
activity through a focus on cycling for<br />
transport and recreation.<br />
Cycling prevalence in Australia<br />
Limited data on cycling prevalence in<br />
Australia are available from the national<br />
census (every five years), transport<br />
surveys, and special purpose studies.<br />
Data have been collected in the<br />
transport, health, sport, recreation and<br />
tourism sectors, often using inconsistent<br />
measures. This review focuses on data<br />
related to cycling for transport and<br />
recreation. These are described<br />
separately, though in some studies no<br />
distinction is made between these two<br />
forms of cycling.<br />
Cycling as a means of transport<br />
Unlike other modes of transport, data on<br />
cycling as a means of transport is poor.<br />
National population census data are<br />
available for journey to work only, which<br />
represents travel on only one day in the<br />
middle of the Australian winter. Travel<br />
surveys that include all forms of cycling<br />
for transport have been conducted in a<br />
limited number of Australian states, cities<br />
or regions. No consistent national data<br />
are available.<br />
In the 2001 Australian Census of<br />
Population and Housing, 0.94% of<br />
employed persons aged 15 years and<br />
over travelled to work by bicycle (Bell,<br />
Garrard and Swinbourne, in press). There<br />
was a marked gender difference, with<br />
0.40% of women cycling to work,<br />
compared with 1.39% of men (Bell,<br />
Garrard and Swinbourne, in press).<br />
Cycling prevalence was highest in the<br />
Northern Territory for men (4.19%) and<br />
women (2.37%), followed by the<br />
Australian Capital Territory (2.70% and<br />
0.96% respectively). Cycling prevalence<br />
was highest in the youngest age groups<br />
(15-24 years and 25-34 years) and<br />
declined thereafter with age, except for a<br />
small increase in the 75 and older age<br />
group). Cycling prevalence declined for<br />
World Transport Policy & Practice___________________________________________________<br />
Volume 13.1 September 2006<br />
50
men (from 1.45% to 1.39%) from 1996<br />
to 2001 and increased marginally for<br />
women (0.37% to 0.40%).<br />
The 1996 and 2001 censuses were<br />
collected on a single day in August (the<br />
middle of the Australian winter). Wet<br />
weather and limited daylight hours can<br />
adversely influence a person’s decision to<br />
cycle to work. The Victorian Activity and<br />
Travel Survey for the period 1997 to<br />
1999 indicated up to 30% more cycling<br />
trips undertaken in autumn than in<br />
winter (VicRoads, 2004). Therefore, the<br />
above cycling prevalence data<br />
underestimates the yearly prevalence of<br />
cycling to work in Australia.<br />
The Victorian Activity and Travel Survey<br />
(VATS) is an example of a survey that<br />
measures all travel by all modes by all<br />
people in the surveyed households<br />
(McGinley, 2003). While it records all<br />
bicycle trips (and not just journey to<br />
work), the sample of 14,874 households<br />
with 30,464 household occupants<br />
(comprising 770 individuals, 2.52%, who<br />
reported using a bicycle on their<br />
allocated travel day) is drawn only from<br />
metropolitan Melbourne. This does<br />
suggest that the prevalence of cycling is<br />
higher in urban areas compared with<br />
rural areas.<br />
For the data collection period 1997 to<br />
1999 in the VATS, approximately 75% of<br />
cyclists are male, and 49% are less than<br />
20 years old (mainly in the 10-20 years<br />
age group). On average, 1.2% of all trips<br />
in Melbourne are by bicycle, more than<br />
by bus (1%) or tram (1%). The average<br />
number of bicycle trips is 0.07 trips per<br />
person per day, although this varies by<br />
locality, with cycling for transport<br />
decreasing from 3.7% of trips in central<br />
Melbourne to 1.3% in the inner suburbs<br />
to 1.0% in the outer suburbs to 0.9% in<br />
outer metropolitan regions of Melbourne.<br />
A higher percentage of bicycle trips are<br />
made on weekends than on weekdays.<br />
The majority of bicycle trips are up to 1<br />
km in length (36%) and nearly 90% of<br />
bicycle trips are 5 km or less. Cycling to<br />
work accounts for the highest proportion<br />
of all bicycle trips (14%). It should be<br />
noted that the VATS survey data include<br />
bicycle trips undertaken for recreational<br />
purposes.<br />
In a survey of physical activity levels of<br />
South Australian adults conducted in<br />
2004 by the South Australian<br />
Department of Health, 8.5% of<br />
respondents reported cycling at least<br />
once a week (Gill and Taylor, 2005).<br />
Almost five per cent (4.8%) of<br />
respondents had cycled for at least 10<br />
minutes for recreation only in the past<br />
week, 1.6% had cycled for transport<br />
only, and 1.4% for both recreation and<br />
transport.<br />
In metropolitan Sydney in 1998, one<br />
percent of the population cycles<br />
everyday, which represents 91,000<br />
bicycle trips each week day (Transport<br />
Data Centre, 2003). However, there are<br />
marked regional differences, with some<br />
inner Sydney areas seeing 2-3% of<br />
journeys to work, and outer suburbs<br />
seeing less that 1% (Telfer and Rissel,<br />
2003). There has been a 64% increase in<br />
cycling to work in the inner Sydney areas<br />
between the 1996 and 2001 censuses<br />
(Telfer, 2003). In 1998, the majority of<br />
Sydney riders (58%) were male<br />
(Transport Data Centre, 2003).<br />
Cycling for recreation<br />
Annual surveys of participation of<br />
Australians aged 15 years and over in<br />
exercise, recreation and sport have been<br />
conducted by the Australian Sports<br />
Commission from 2001 to 2004<br />
(Australian Sports Commission 2005).<br />
Cycling, with a participation rate of<br />
10.5% in 2004, is the fourth most<br />
World Transport Policy & Practice___________________________________________________<br />
Volume 13.1 September 2006<br />
51
popular activity after walking (39%),<br />
aerobics/fitness (17.1%) and swimming<br />
(16.5%). Participation in cycling<br />
increased by 15.3% from 2001 to 2004<br />
(Australian Sports Commission 2005).<br />
Participation in recreational cycling<br />
events<br />
State-based bicycle advocacy<br />
organisations conduct a range of singleday<br />
rides and multi-day bicycle tours.<br />
Analysis of the ride participant database<br />
of the largest and most active of these<br />
organisations, Bicycle Victoria (BV),<br />
reveals that there were 208,244<br />
participants in eight BV-organised rides<br />
and tours from 1994 to 2004 (Garrard<br />
and Crawford, 2005). 26 Overall,<br />
participation in BV rides increased by an<br />
average of 10.8% per annum from 1994<br />
to 2004, with much of this increase<br />
occurring between 2001 and 2004.<br />
Gender differences in the shorter<br />
distance recreational cycling events are<br />
generally not as great as for cycling for<br />
transport, averaging about 30% across<br />
all rides. The longer recreational cycling<br />
events attract relatively fewer female<br />
participants, with the 210 km Victorian<br />
‘Around the Bay in a Day’ ride comprising<br />
12% females (Garrard and Crawford,<br />
2005).<br />
Influences on cycling<br />
Demographic influences on cycling in<br />
Australia include age, gender, socioeconomic<br />
status and location. The<br />
highest level of recreational cycling (at<br />
least once in the past year) occurs in<br />
those aged 25-34 years, and declines<br />
steadily with older age (Australian Bicycle<br />
Council, 2004). The age distribution of<br />
participants in cycling events organised<br />
by Bicycle Victoria shows a slightly older<br />
age distribution though comparisons are<br />
made more difficult due to the use of<br />
different age ranges (Garrard and<br />
Crawford, 2005). This could reflect age<br />
differences in frequency of cycling (most<br />
event participants train in preparation for<br />
rides and are therefore likely to cycle<br />
more than once a year); real age<br />
differences in participation in organised<br />
events compared with recreational<br />
cycling, or the possibility of differences<br />
between Victoria and the rest of<br />
Australia. The Australian Bureau of<br />
Statistics journey to work data indicates<br />
that cycling for transport (national<br />
census data) has high levels of<br />
participation among people aged 15-24<br />
years that is similar to that of people<br />
aged 25-34 years, and shows a similar<br />
decline with age as for recreational<br />
cycling (Bell, Garrard and Swinbourne, in<br />
press).<br />
There are substantial gender differences<br />
in cycling in Australia. The female rate of<br />
Australian commuter cycling is less than<br />
one third that of the male rate, and<br />
similar gender differences occur for<br />
recreational cycling (Garrard, 2003). In<br />
contrast, in several western European<br />
countries commuting cycling rates are<br />
high, and women cycle more frequently<br />
than men (Garrard, 2003). In Australia,<br />
women cycle shorter distances than men<br />
and have a stronger preference for<br />
cycling on bicycle paths, which provide<br />
separation from motor vehicles (Garrard<br />
et al, personal communication). Female<br />
cyclists’ income distribution is similar to<br />
the general Victorian population, but<br />
male cyclists are more likely to be in<br />
lower and higher income groups (Garrard<br />
et al, personal communication).<br />
Barriers to cycling<br />
Of the approximately 40-50 per cent of<br />
the Australian population that have<br />
access to a bicycle and are healthy<br />
enough to ride one, and looking at those<br />
World Transport Policy & Practice___________________________________________________<br />
Volume 13.1 September 2006<br />
52
trips where using a bicycle is feasible,<br />
there are different influences on cycling<br />
dependent on individual current cycling<br />
behaviour. For example, for persons not<br />
currently riding a bike, or not having<br />
done so for several years, then the<br />
barriers and motivations to cycle are<br />
different compared with someone who is<br />
a current recreational rider, or a regular<br />
cycle commuter. It is worth identifying<br />
three main groups here: non-riders,<br />
occasional riders, and then commuter<br />
cyclist and regular recreational riders.<br />
There are other groups of people<br />
involved in competitive cycling, such as<br />
road-racing or technical mountain bike<br />
riding, and touring cyclists, but these<br />
people have separate and specific<br />
barriers and motivations.<br />
The following table considers those<br />
factors that influence people who cycle<br />
for recreation and for transport. These<br />
influences are grouped by whether they<br />
are individual, social, cultural or<br />
economic factors, and environmental<br />
factors. Sometimes the same variable<br />
can have one dimension that is a barrier,<br />
and yet may also be a motivating factor.<br />
For example, for a non-cyclist getting<br />
fit/healthy can be a significant reason to<br />
start riding, but at the same time the<br />
lack of fitness can make starting to ride<br />
an effort and the perception that cycling<br />
takes great effort serves as a barrier.<br />
Safety concerns, often arising from the<br />
speed and volume of traffic and not<br />
having designated space for people riding<br />
bicycles, and aggressive driving has been<br />
consistently identified as deterrents to<br />
regular cycling (Greig, 2001). It is worth<br />
noting that concerns about safety are<br />
higher among non-cyclists than regular<br />
riders (Rissel et al, 2002), with noncyclists<br />
consistently overestimating the<br />
level of risk involved. People with varying<br />
levels of cycling experience perceive<br />
traffic safety differently. Based on<br />
qualitative research with women, Garrard<br />
(2003) suggests that this it is more to do<br />
with skills, self-confidence, experience<br />
and route familiarity – when these<br />
increase, traffic safety concerns<br />
decrease.<br />
Table 1: Influences on cycling<br />
Influences<br />
Includes<br />
Specific factors<br />
Recreation<br />
Transport<br />
Individual factors<br />
Demographic<br />
Age, gender, health status,<br />
Age, gender, health status,<br />
SES<br />
distance, SES<br />
Personal:<br />
Health, fitness, other people,<br />
Cost, convenience, health,<br />
motivation/initiation<br />
campaigns,<br />
events,<br />
fitness,<br />
incentives,<br />
information, skills, resources,<br />
environmental<br />
concerns,<br />
challenge,<br />
social<br />
other people, support to<br />
encouragement, support to<br />
address safety concerns,<br />
address safety concerns,<br />
time availability<br />
time availability/priority<br />
Fun, enjoyment, selfefficacy,<br />
achieve cycling<br />
Above, plus, establishing a<br />
Personal: maintenance<br />
goals, acquire skills,<br />
routine that works (eg safe<br />
World Transport Policy & Practice___________________________________________________<br />
Volume 13.1 September 2006<br />
53
experience, community links<br />
route, carrying things,<br />
(eg cycling groups)<br />
change facilities, bike<br />
Sense of control over safety<br />
security), sense of control<br />
over safety<br />
Social/<br />
cultural/<br />
Family/social ‘time together’<br />
Normative<br />
transport<br />
economic factors<br />
Values (eg encouraging<br />
behaviour<br />
children to be active)<br />
Driver behaviour<br />
Cost (relatively low, but<br />
‘Invisible infrastructure’ (eg<br />
requires bike and helmet)<br />
traffic calming)<br />
Cost and convenience of<br />
alternatives (eg cost of<br />
petrol)<br />
Population density<br />
Destinations of interest<br />
Environmental<br />
Natural environment<br />
Easy access to pleasant<br />
Weather, geography<br />
factors<br />
surroundings, geography<br />
Built environment<br />
Cycling facilities (off-road<br />
On and off-road paths, urban<br />
paths), amenities<br />
design, end-of-trip facilities<br />
Greig (2001) identified a number of<br />
predisposing factors that negatively<br />
impact on cycling. These are important to<br />
identify, in order that strategies can be<br />
developed that address them. These<br />
negative predisposing factors are the<br />
belief that cycling is dangerous, the<br />
perception that great effort is required,<br />
the reaction to compulsory helmet<br />
wearing, limited secure storage, not<br />
being aware of improved cycle ways, or<br />
the perception that cycling is something<br />
you do before you start driving. The<br />
fitness image of cyclists (for example,<br />
athletes or wearing lycra) can also be a<br />
barrier to those people who do not<br />
currently cycle.<br />
The degree of effort required to get to a<br />
cycle path is also related to whether a<br />
cycle path is used. In a study in Western<br />
Sydney, those people who owned a<br />
bicycle and were living close to a cycle<br />
path were more likely to use it than<br />
bicycle owners living 1.5 kilometres from<br />
the path (Merom et al, 2003).<br />
Australian Interventions to promote<br />
cycling<br />
Seventeen Australian programs with a<br />
component to increase cycling published<br />
since 1995 with an evaluation<br />
component have been included in Table<br />
2 below. The program title and first<br />
author and year of publication is given,<br />
followed by a brief summary of the main<br />
strategies used and results found. An<br />
assessment of the level of evidence<br />
provided by the evaluation is given<br />
according to the following hierarchy of<br />
evidence:<br />
I Evidence obtained from a<br />
systematic review of all<br />
randomised control trials (RCT)<br />
II Evidence obtained from at least<br />
one properly designed RCT<br />
World Transport Policy & Practice___________________________________________________<br />
Volume 13.1 September 2006<br />
54
III-1 Evidence obtained from welldesigned<br />
pseudo-RCT (alternative<br />
allocation or some other method)<br />
III-2 Evidence obtained from<br />
comparative studies with<br />
concurrent controls and allocation<br />
not randomised (cohort studies),<br />
Case control studies or interrupted<br />
time series with a control group<br />
III-3 Evidence obtained from<br />
comparative studies with historical<br />
control, two or more single arm<br />
studies or interrupted time series<br />
without a parallel control group<br />
IV Evidence obtained from case<br />
series, either post-test or pre test<br />
and post test<br />
This hierarchy of study designs<br />
(commonly referred to as “levels of<br />
evidence”) is used by the National Health<br />
and Medical Research Council (NHMRC,<br />
2000) to indicate the increasing potential<br />
for bias in those studies on lower levels,<br />
and therefore the greater reliance on the<br />
conclusions from those higher rated<br />
studies. However, it is also important to<br />
recognise that this hierarchy<br />
disadvantages research study designs<br />
where the subject of interest is<br />
communities, policies, or local<br />
governments or other complex social<br />
phenomenon. It is very expensive to<br />
randomly allocate whole local<br />
government areas to treatment and<br />
control conditions and community<br />
interventions are relatively rare in the<br />
public health literature. It is also<br />
important to note that in some public<br />
health settings it may only be feasible,<br />
or politically and/or ethically acceptable<br />
to conduct observational studies<br />
(Rychetnik and Frommer, 2004).<br />
Evaluation opportunities that arise<br />
through policy or infrastructure changes<br />
can create natural experiments that can<br />
provide relevant and useful ‘real life’<br />
data (Petticrew et al, 2005).<br />
There are certainly more programs<br />
seeking to promote cycling in Australia<br />
than are reported here, although many of<br />
these are not being formally evaluated or<br />
the results of evaluations that have been<br />
conducted have not been documented, or<br />
the documentation of these evaluations<br />
are not readily accessible to external<br />
agencies. The level of evidence of the<br />
effectiveness of the various strategies to<br />
promote cycling provided by the available<br />
published reports is relatively low,<br />
consistent with previous international<br />
reviews (Ogilvie et al, 2004). However,<br />
this is more a reflection of the<br />
inadequacies of the traditional biomedical<br />
evidence hierarchy in assessing<br />
the types of interventions needed to<br />
promote cycling in a variety of settings.<br />
Almost all of the identified cycling<br />
promotion program evaluations have<br />
shown some degree of increase in<br />
cycling, suggesting that if they were to<br />
be implemented on a wider scale and<br />
with adequate resources they would lead<br />
to increases in population levels of<br />
regular cycling.<br />
Discussion<br />
This review has highlighted the relatively<br />
low level of regular cycling for transport<br />
in Australia, and the marked gender<br />
disparity of riders. However, cycling is a<br />
very popular recreational activity (fourth<br />
most popular nationally), suggesting that<br />
under favourable conditions some of<br />
these riders could substitute short car<br />
trips for bicycle trips. This review has<br />
also highlighted the variety of personal,<br />
social and environmental influences on<br />
cycling, which are more or less influential<br />
depending on where on the continuum of<br />
cycling development a person might be.<br />
World Transport Policy & Practice___________________________________________________<br />
Volume 13.1 September 2006<br />
55
Achievable cycling targets<br />
In thinking about the factors that<br />
influence people to ride a bicycle, it is<br />
important to remember that even in<br />
those European cities where cycling is a<br />
common mode of transport, the highest<br />
proportion of trips by bicycle is around<br />
45 per cent of all trips (Anderson 2005).<br />
There are some circumstances where<br />
using a bicycle is not an option. First,<br />
there is a time/distance barrier for a<br />
journey, beyond which it is not an option<br />
to use a bicycle. While this point will vary<br />
depending on the level of cycling<br />
enthusiasm, between 30-60 minutes is a<br />
general limit for the majority of the<br />
population.<br />
Second, certain commitments will impact<br />
on the ability to use a bicycle. For<br />
example, carrying heavy or bulky items<br />
reduces the feasibility of cycling, as do<br />
other choices, such as walking to school<br />
with a child or taking an elderly relative<br />
shopping which then intrudes on the<br />
time/distance barrier.<br />
Third, a certain proportion (10%) of the<br />
population will be physically unable to<br />
ride a bike because of a physical<br />
disability – between 5.2% (severe or<br />
profound core activity restriction) to<br />
15.3% (one or more activity limitations<br />
or restrictions or participation<br />
restrictions), and this increases in older<br />
populations(AIHW, 2003). Lack of<br />
physical fitness or even adequate<br />
physical activity affects almost half the<br />
population, which reduces the<br />
time/distance able to be cycled.<br />
Finally, not having access to a bicycle is a<br />
critical determinant of cycling behaviour.<br />
Approximately 40 per cent (39%) of<br />
Sydney households have access to a<br />
bicycle (Transport Data Centre, 2003).<br />
with Sydney having the lowest level of<br />
bicycle ownership in Australia at 29 per<br />
cent, compared with bicycle ownership in<br />
Canberra at 65 per cent (Australian<br />
Bicycle Council, 2004).<br />
Recommendations for research and<br />
practice<br />
This review has highlighted the relative<br />
paucity of research and evaluation<br />
studies concerned with the promotion of<br />
cycling. Given the lack of evaluation<br />
data, there are many aspects of cycling<br />
that require research and evaluation. The<br />
main areas of work identified in our<br />
review are summarised below, but these<br />
are not intended to be comprehensive.<br />
• Implement and evaluate advocacy<br />
strategies to increase political<br />
commitment and will to support<br />
cycling, and increase the profile of<br />
everyday cycling among policy and<br />
decision makers;<br />
• Regular and systematic national and<br />
state assessment of cycling<br />
frequency and prevalence, such as<br />
outlined in the Cycling Data and<br />
Indicator Guidelines (Australian<br />
Bicycle Council, 2000);<br />
• Document/evaluate the effects of<br />
‘invisible’ infrastructure on cycling<br />
prevalence and safety, such as lower<br />
speed limits and traffic calming;<br />
• Document/evaluate the effects of offand<br />
on-road cycling infrastructure,<br />
and its promotion;<br />
• Better access to documents /<br />
understanding of the individual,<br />
normative, and social factors that<br />
facilitate or hinder cycling;<br />
• Better understanding and<br />
documentation of the role of ‘road<br />
rage’, poor driver behaviour and<br />
‘safety concerns’ on cycling<br />
prevalence;<br />
• Research to explore whether<br />
increases in cycling leads to overall<br />
World Transport Policy & Practice___________________________________________________<br />
Volume 13.1 September 2006<br />
56
increases in levels of physical<br />
activity;<br />
• Clearinghouse role for the Australian<br />
Bicycle Council (or similar) for<br />
reports on cycling and evaluations of<br />
strategies to promote cycling; and<br />
• Bicycle advocates/researchers need<br />
to document better the effective<br />
strategies for promoting cycling.<br />
Conclusions<br />
From the published evaluation studies<br />
located, it is clear that there are very few<br />
high quality Australian evaluations as<br />
defined by biomedical research<br />
standards, although the number of such<br />
reports and publications have increased<br />
substantially in the last five years.<br />
Despite this lack of evidence, there has<br />
been a small but sustained increase in<br />
the prevalence of cycling over recent<br />
years, particularly in the inner state<br />
capital city areas. There are many<br />
examples of small projects that have<br />
increased cycling, or improved the<br />
conditions for cycling, and many<br />
examples from other countries. The<br />
absence of control groups is not<br />
necessarily an evaluation limitation, as<br />
the prevailing cycling trends are declines<br />
or no change. The best available<br />
evidence indicates that the investment in<br />
cycling infrastructure AND promotion<br />
successfully encourages cycling. It is also<br />
clear from data on frequency of<br />
recreational cycling that a great many<br />
people want to ride bicycles. However,<br />
despite the multiple benefits of cycling<br />
across many sectors, political support<br />
and financial commitment to cycling are<br />
required to increase the prevalence of<br />
cycling.<br />
References<br />
ADONIS Project. Analysis and<br />
development of new insight into<br />
substitution of short car trips by cycling<br />
and walking. Italy: European<br />
Communities, 1998.<br />
Anderson LB, Schnohr P, Schroll M, Hein<br />
HO. All-cause mortality associated<br />
with physical activity during leisure<br />
time, work, sports and cycling to<br />
work. Archives of Internal Medicine<br />
2000; 160: 1621-1628.<br />
Anderson T. Odense-Denmark’s National<br />
Cycle city. ‘Connecting Cycling-Planning<br />
for Healthy Communities, Bicycle<br />
Federation of Australia bi-annual<br />
Conference,’ Brisbane October 5-8, 2005.<br />
Ashley B, Rissel C. Monitoring of cycling<br />
and active transport in the Hawthorne<br />
Canal catchment. HCAT Technical Report<br />
No.1 / 04, November 2004.<br />
Ashton-Graham C, John G, James B,<br />
Brög W, Grey-Smith H. Increasing cycling<br />
through 'soft' measures (TravelSmart) -<br />
Perth, Western Australia. In: McClintock<br />
H, editor. Planning for cycling: principles,<br />
practice and solutions for urban planners.<br />
Cambridge: Woodhead, 2002.<br />
Department for Planning and<br />
Infrastructure. Travel behaviour change<br />
program for the city of South Perth under<br />
the TravelSmart program: technical<br />
appendix. Perth: Government of Western<br />
Australia, 2003.<br />
Australian Bicycle Council. Australia<br />
Cycling- Bicycle ownership, use and<br />
demographics (draft). July 2004.<br />
Australian Bicycle Council. Cycling Data<br />
and Indicator Guidelines. Canberra:<br />
Commonwealth Department of Health<br />
and Aged Care, 2000.<br />
Australian Institute of Health and<br />
Welfare. Australia’s Health 2004: the<br />
ninth biennial health report of the<br />
Australian Institute of Health and<br />
Welfare. Canberra: AIHW, 2004.<br />
Australian Institute of Health and<br />
Welfare. Disability prevalence and trends.<br />
World Transport Policy & Practice___________________________________________________<br />
Volume 13.1 September 2006<br />
57
Canberra: AIHW, 2003. AIHW Cat no.<br />
DIS34.<br />
Australian Institute of Health and<br />
Welfare: Mathers C, Vost T, Stevenson C.<br />
The burden of disease and injury in<br />
Australia. AIHW Cat. No. PHE 17.<br />
Canberra: AIHW, 1999.<br />
Australian Sports Commission. Exercise,<br />
Recreation and Sport Survey (ERASS).<br />
Canberra: Australian Sports Commission,<br />
2005.<br />
(www.ausport.gov.au/scorsresearch/eras<br />
s2003.asp.)<br />
Austroads. The Australian National<br />
Cycling Strategy 2005-2010. Sydney:<br />
Austroads, Department of Transport and<br />
Regional Services, 2005.<br />
Baker S. Evaluation of the Community<br />
and Road Education Scheme (CARES<br />
facility), Sydney Park. Sydney: City of<br />
Sydney, 2005.<br />
Bauman A, Owen N. Physical activity of<br />
adults Australians: epidemiological<br />
evidence and potential strategies for<br />
health gain. Journal of Science, Medicine<br />
and Sport 1999;2:30-41.<br />
Bell C, Garrard J, Swinburn B. Active<br />
transport to work in Australia: is it all<br />
downhill from here? Asia-Pacific Journal<br />
of Public Health, (in press).<br />
Bicycle Victoria. Cycle Instead Victorian<br />
Pilot: final report. Melbourne: Bicycle<br />
Victoria, 2004.<br />
(http://www.bv.com.au/file/cycle_instea<br />
d_final_report_general.pdf, accessed 14<br />
March 2006).<br />
Bicycle Victoria. Australia’s busiest<br />
bicycle thoroughfare. BV News June<br />
2003. p. 10.<br />
Cooper B, Meiklejohn D. A new approach<br />
for travel behaviour change in<br />
Universities. Proceedings of the 26 th<br />
Australasian Transport Research Forum,<br />
Wellington, New Zealand, 1-3 October,<br />
2003.<br />
Davis A. Active transport: a guide to the<br />
development of local initiatives to<br />
promote walking and cycling. London:<br />
UK: Health Education Authority, 1999.<br />
Garrard J, Crawford S. Bicycle Victoria –<br />
participation in cycling events 1994-<br />
2004. Unpublished report. Melbourne:<br />
Deakin University, 2005.<br />
Garrard J, Rose G, Sing KL, Barton A.<br />
Commuter cycling in Melbourne,<br />
Australia: are females more likely than<br />
males to use routes with greater<br />
separation from motor vehicle traffic?<br />
(Personal Communication, March 2006)<br />
Garrard J. Healthy revolutions:<br />
promoting cycling among women. Health<br />
Promotion Journal of Australia 2003;<br />
14(3):213-5.<br />
Gill T, Taylor A. Physical activity in South<br />
Australian adults. Adelaide: South<br />
Australian Department of Health, 2005.<br />
Greig R. Cycling promotion in Western<br />
Australia. Health Promotion Journal of<br />
Australia 2001; 12(3):250-3.<br />
Hu G, Qiao Q, Silventoinen K, Eriksson<br />
JG, Jousilahti P, LindstronJ, Valle TT,<br />
Nissinen A, Toumilehto J.<br />
Occupational commuting and leisuretime<br />
physical activity in relation to<br />
risk for Type 2 diabetes in middleaged<br />
Finnish men and women.<br />
Diabetologia 2003: 46(3): 322-329.<br />
Jacobsen PL. Safety in numbers: more<br />
walkers and bicyclists, safer walking and<br />
bicycling. Injury Prevention 2003; 9:<br />
205-209.<br />
James B. Walking and cycling more: the<br />
TravelSmart evidence. Paper presented<br />
at the 14 th Annual Australian Health<br />
Promotion Association Conference ‘Made<br />
in the Future’, Sydney, 17-20 June,<br />
2002.<br />
Kuiper G. The Cycling in the City Project:<br />
summary report. Sydney: City of<br />
Sydney, May 2005.<br />
World Transport Policy & Practice___________________________________________________<br />
Volume 13.1 September 2006<br />
58
Marfut H, Rose G, Meikeljohn D, Wills S,<br />
Barber H. Ride to work and beyond!<br />
Maximising the behaviour change<br />
impacts of an active transport event.<br />
Journal of Science and Medicine in Sport<br />
2005; 8(4): s219.<br />
Marshall G. Promoting cycling for health<br />
and fitness. Health Promotion Journal of<br />
Australia 2001; 12(3):258-60.<br />
Mason C. Healthy people, places and<br />
transport. Health Promotion Journal of<br />
Australia 2000; 10(3): 190-196.<br />
McGinley F. Cycling in Melbourne 1997 –<br />
1999: Final report to VicRoads based on<br />
data from the Victorian Activity & Travel<br />
Survey (VATS) 1997-1999. Melbourne:<br />
Transport Research Centre, RMIT<br />
University, 2003.<br />
Merom D, Bauman, Vita P, Close G. An<br />
environmental intervention to promote<br />
walking and cycling-the impact of a<br />
newly constructed Rail Trail in Western<br />
Sydney. Preventive Medicine 2003;<br />
36(2): 235-242.<br />
National Health and Medical Research<br />
Council. How to review evidence:<br />
systematic identification and review of<br />
the scientific literature. Canberra:<br />
AusInfo, 2000.<br />
NSW Department of Transport.<br />
Integrated Transport Strategy for the<br />
Greater Metropolitan Region. Sydney,<br />
1995.<br />
Ogilvie D, Egan M, Hamilton V, Petticrew<br />
M. Promoting walking and cycling as an<br />
alternative to using cars: systematic<br />
review.<br />
BMJ;<br />
doi:10.1136/bmj.38216.714560.55<br />
(published 22 September 2004).<br />
Paffenbarger RS, Hyde RT, Wing AL,<br />
Hsieh CC. Physical activity, all-cause<br />
mortality, and longevity of college<br />
alumni. N Engl J Med 1986;314(10):<br />
605-13.<br />
Petticrew M, Cummins S, Ferrell C,<br />
Findlay Z, Higgins C, Hoy C, Kearns A,<br />
Sparks L. Natural experiments: an<br />
underused tool for public health. Public<br />
Health 2005; 119: 751-757.<br />
Carlin JB. Taylor P. Nolan T. School<br />
based bicycle safety education and<br />
bicycle injuries in children: a case-control<br />
study. Injury Prevention 1998; 4(1):22-<br />
7.<br />
Pucher J, Dijkstra L. Promoting safe<br />
walking and cycling to improve public<br />
health: lessons from the Netherlands and<br />
Germany. American Journal of Public<br />
Health 2003; 93(9): 1509-1516.<br />
Rissel C, Campbell F, Ashley B, Jackson<br />
L. Driver knowledge of road rules and<br />
attitudes towards cyclists. Australian<br />
Journal of Primary Health 2002; 8(2):<br />
66-69.<br />
Roberts I, Owen H, Lumb P, MacDougall<br />
C. Pedalling health: health benefits of a<br />
modal transport shift. Adelaide:<br />
University of Adelaide, 1996.<br />
Robinson DL. Safety in numbers in<br />
Australia: more walkers and bicyclists,<br />
safer walking and bicycling. Health<br />
Promotion Journal of Australia 2005;<br />
16(1): 47-51.<br />
Rose G, Ampt E. Travel blending: an<br />
Australian travel awareness initiative.<br />
Transport Res D 2001; 6: 95-110.<br />
Rychetnik L, Frommer M. A schema for<br />
evaluating evidence on public health<br />
interventions – Version 4. Melbourne,<br />
National Public Health Partnership, 2004.<br />
Steindorf K, Schmidt M, Kropp S, Chang-<br />
Claude J. Case-control study of<br />
physical activity and breast cancer<br />
risk among premenopausal women in<br />
Germany. American Journal of<br />
Epidemiology 2003; 157(2): 121-130.<br />
Telfer B, Rissel C, Bindon J, Bosch T.<br />
Encouraging cycling through a pilot<br />
cycling proficiency training program<br />
among adults in central Sydney. Journal<br />
World Transport Policy & Practice___________________________________________________<br />
Volume 13.1 September 2006<br />
59
of Science and Medicine in Sport (in<br />
press).<br />
Telfer B, Rissel C. Cycling to work in<br />
Sydney: analysis of journey-to-work<br />
Census data from 1996 and 2001.<br />
Camperdown: Central Sydney Area<br />
Health Service, Health Promotion Unit,<br />
September 2003.<br />
Telfer B. Increase in cycling to work in<br />
Sydney: analysis of journey-to-work<br />
Census data from 1996 and 2001. Health<br />
Promotion Journal of Australia 2003;<br />
14(3): 222-224.<br />
Transport Data Centre. Cycling in<br />
Sydney- Bicycle ownership and use.<br />
Transport Data Centre, RTA, 2003.<br />
USDHHS. Physical activity and health- a<br />
report of the Surgeon General. Atlanta:<br />
Centers for Disease Control and<br />
Prevention, National Center for Chronic<br />
Disease Prevention and Health<br />
Promotion.<br />
http://www.cdc.gov/nccdphp/sgr/sgr.ht<br />
m Last updated November 17, 1999.<br />
Accessed October 15, 2003.<br />
VicRoads. Cycling in Melbourne: bicycle<br />
ownership, use and demographics 1997-<br />
1999. Melbourne: VicRoads, 2004.<br />
Wen LM, Orr N, Bindon J, Rissel C.<br />
Promoting active transport in a workplace<br />
setting: evaluation of a pilot study in<br />
Australia. Health Promotion International<br />
2005; 20(2): 123-133.<br />
Zaccari V. Big Bike Day 2000 – 2004.<br />
Leichhardt: Leichhardt Municipal Council.<br />
2004.<br />
Address for correspondence:<br />
Chris Rissel<br />
Health Promotion Service<br />
Level 9 (north), King George V<br />
Missenden Road, Camperdown NSW<br />
2050, Australia.<br />
Phone: (02) 9515-9055<br />
Fax: (02) 9515-9056<br />
Email: criss@email.cs.nsw.gov.au<br />
World Transport Policy & Practice___________________________________________________<br />
Volume 13.1 September 2006<br />
60
Table 2: Australian interventions to promote cycling by setting and intervention type<br />
Intervention type<br />
Setting/population<br />
School University Workplace Community-wide<br />
Education/skills<br />
Bike Education program (Carlin,<br />
Taylor and Nolan, 1998)<br />
Adult skills group (Telfer et al,<br />
in press)<br />
Strategy: School based<br />
Strategy: 6 hours of group<br />
curriculum program with skills<br />
instruction, mostly learning<br />
component.<br />
Results: Increase in injuries in<br />
cycling skills and ride practice<br />
Results: An 40% increase in<br />
the intervention group<br />
weekly cycling time among<br />
Evidence level: III-2<br />
those not-riding at baseline<br />
Evidence level: III-3<br />
CARES program (Baker, 2005)<br />
Strategy: Purpose built training<br />
venue for skills development,<br />
plus classroom component<br />
Results: Decrease in injuries in<br />
intervention group (12% v<br />
22%)<br />
Evidence level: III-2<br />
Social marketing/ behaviour<br />
change<br />
Monash Travel Smart (Cooper<br />
and Meiklejohn, 2003)<br />
Strategies: Travel behaviour<br />
change media promotion<br />
among students<br />
Results: Observed increases in<br />
cycling<br />
Evidence level: III-3<br />
Health workforce intervention<br />
(Wen et al, 2005)<br />
Strategies: Individual travel<br />
behaviour change interviews<br />
with a cohort of staff, plus<br />
general social marketing<br />
strategies<br />
Results: Reduced car use, but<br />
no change in cycling level<br />
Evidence level: III-3<br />
Ride to Work Day (Marfut et al,<br />
2005)<br />
Strategies: Ride to work event<br />
advertised widely through<br />
workplaces<br />
Results: 13% rode to work for<br />
Adelaide project (Rose and<br />
Ampt, 2001)<br />
Strategies: individual action<br />
program, known as Travel<br />
Blending®,<br />
involves<br />
participating households being<br />
sent a series of four kits,<br />
containing information booklets<br />
and travel diaries, over a nineweek<br />
period<br />
Results: a 10% reduction in car<br />
driver kilometres<br />
Evidence level: III-3<br />
Event series data analysis<br />
(Garrard and Crawford, 2005)<br />
Strategies: Secondary data<br />
analysis<br />
Results: Increase in event<br />
participation over time<br />
World Transport Policy & Practice___________________________________________________<br />
Volume 13.1 September 2006<br />
61
the first time, and a quarter of Evidence level: IV<br />
these people were still riding to<br />
work five months later<br />
Evidence level: III-3<br />
Hawthorne Canal Project<br />
(Ashley and Rissel, 2004)<br />
Strategies: Distribution and<br />
promotion of local cycling map<br />
illustrating key connections,<br />
plus organised community rides<br />
Results: Bicycle counters<br />
indicated an increase in use of<br />
highlighted route<br />
Evidence level: III-3<br />
Bike event days (Zaccari, 2004)<br />
Strategies: Bike days organised<br />
by local council, including a<br />
family ride<br />
Results: Similar level of<br />
participation each year<br />
Evidence level: IV<br />
Infrastructure Cycle monitoring in Victoria<br />
(Bicycle Victoria, 2003)<br />
Strategies: Data analysis of<br />
bicycle counters at key<br />
strategic routes<br />
Results: Steady increase in bike<br />
counts<br />
Evidence level: III-3<br />
Western Sydney Rail Trail<br />
Evaluation (Merom et al, 2003)<br />
Strategies: Completion of new<br />
dedicated bicycle infrastructure,<br />
but minimal promotion<br />
Results: Small but statistically<br />
significant increase in use of<br />
facility<br />
Evidence level: III-2<br />
‘Invisible infrastructure’ (eg<br />
traffic calming policies, fiscal No Australian data<br />
policies such as congestion<br />
taxes, petrol prices)<br />
World Transport Policy & Practice___________________________________________________<br />
Volume 13.1 September 2006<br />
62
Multi-component Cycling 100 (Marshall, 2001)<br />
Strategies:<br />
Employees<br />
committed to replacing 4 car<br />
trips per week by bicycle and<br />
were given use of a free bicycle<br />
Results:<br />
Significant<br />
improvements in a range of<br />
health indicators<br />
Evidence level: III-3<br />
Cycling in the city (Kuiper,<br />
2005)<br />
Strategies: Employees at three<br />
workplaces committed to riding<br />
to work on two days a week<br />
were given cycling skills<br />
training and social supportuse<br />
within the workplace.<br />
Results: Increase in employees<br />
regularly riding<br />
Evidence level: III-3<br />
Cycle Instead program (Greig,<br />
2001)<br />
Strategies: Media and<br />
community intervention<br />
Results: Significant increase in<br />
the proportion of respondents<br />
who had cycled in the previous<br />
six months (28% vs 36%) plus<br />
bike counters showed an overall<br />
increase of 68.2% of cyclists.<br />
Evidence level: III-3<br />
Cycle Instead Shepparton<br />
(Bicycle Victoria, 2004)<br />
Strategies: Media and<br />
community campaign over two<br />
months<br />
Results: 39% increase in<br />
cycling after two months<br />
Evidence level: III-3<br />
TravelSmart South Perth<br />
(James, 2002; Ashton-Graham,<br />
2002; Department of<br />
Infrastructure, 2003)<br />
Strategies: In-depth interviews<br />
with households about travel<br />
behaviour change<br />
Results: 61% increase in cycle<br />
trips<br />
Evidence level: III-2<br />
World Transport Policy & Practice___________________________________________________<br />
Volume 13.1 September 2006<br />
63
Travel in Inner City versus Urban Fringe<br />
of Adelaide:<br />
The Role of Neighbourhood Design<br />
A Soltani, A Allan, S Somenahalli, F Primerano<br />
Obesity, greenhouse gas emissions, and<br />
oil dependence are major concerns of<br />
sustainability in Australian society1. One<br />
factor is the increasing share of private<br />
vehicle using contributes to these<br />
problems. Another factor is suburban<br />
development, widely criticized for its<br />
contribution to longer average trip<br />
lengths and excessive dependence on<br />
private vehicles at the expense of public<br />
transport and non-motorized modes.<br />
1 Australia is now equal second with the UK,<br />
behind only the United States, when it comes<br />
to the proportion of obese people in the<br />
population Knox , S. (2003). "Planning as a<br />
Public Health Issue." Urban Policy and<br />
Research 21(No. 4): 317–319.. Also, Australia<br />
has higher greenhouse gas emissions per<br />
capita than any other developed country.<br />
Turton, H. and C. Hamilton (August 2002).<br />
<strong>Up</strong>dating per capita emissions for<br />
ndustrialised countries, The Australia Institute.<br />
Accordingly, for instance, a ‘‘Liveable<br />
Neighbourhoods’’ approach (The Western<br />
Australian Planning Commission 1997)<br />
to planning has been proposed as a<br />
counter to urban sprawl.<br />
There is considerable current interest in<br />
the effects of urban design and land use<br />
characteristics on the transport choices<br />
made by people everyday. The<br />
underlying assumption is that residential<br />
neighbourhood characteristics have an<br />
important influence on a person's<br />
willingness to make a trip by transit,<br />
ridesharing, bicycling, or walking -<br />
modes other than driving alone. Further,<br />
the amount and direction of other travel<br />
behaviour issues such as the frequency<br />
of travel, and the distance travelled<br />
should be a function of surrounding<br />
neighbourhood characteristics, thus that<br />
the combination of neighbourhood<br />
characteristics and travel demand<br />
World Transport Policy & Practice___________________________________________________<br />
Volume 13.1 September 2006<br />
64
management strategies can have a<br />
positive interactive effect in influencing<br />
travel patterns.<br />
This study investigates travel pattern in<br />
both inner city and urban fringe<br />
households from four decisively selected<br />
suburbs to discover the potential impacts<br />
of neighbourhood design on travel<br />
choices. For this purpose, an integrated<br />
database of land use characteristics and<br />
travel activities was developed for a<br />
sample of households in the studied<br />
areas. The database was established by<br />
adding site information, developed<br />
through field observation, to the specific<br />
2005 Household Travel Survey<br />
(HTS2005) dataset of the sample areas.<br />
The HTS2005 dataset includes<br />
information about individuals’ travel, and<br />
their perception on their neighbourhood<br />
environment for a number of 321<br />
individuals. These data were then<br />
analysed to explore the interactions that<br />
may exist between transport level of<br />
service, land use, urban design<br />
characteristics, and individual pattern of<br />
travel.<br />
Background Studies<br />
There is an ongoing trend to examine<br />
how urban form and land use patterns<br />
impact upon travel. This question was<br />
raised more than twenty years ago and<br />
inspired many debates so far. Review<br />
articles have also been written<br />
summarising related empirical results<br />
(Stead and Marshall 2001); (Crane<br />
2000);(Handy 1996). However, research<br />
efforts are underway to improve<br />
modelling and assessment tools to<br />
measure the impacts of these effects.<br />
Some Australian and international<br />
examples are reviewed below:<br />
Moriarty and Beed (Moriarty and Beed<br />
1992) found that the expected<br />
relationship between higher density and<br />
lower per capita travel was found to<br />
apply in Australian cities in 1986, where<br />
higher-density cities had much more<br />
travel than the smaller, less dense cities.<br />
They mentioned also that despite the<br />
shortening of the separation between<br />
residential areas and activity centres, per<br />
capita travel increased greatly. They<br />
concluded that travel convenience was<br />
found to provide a better fit to the data<br />
than did land use differences.<br />
Li, Fisher et al (Li, Fisher et al. 2005)<br />
examined the relation between built<br />
environment factors and walking activity<br />
at both the neighbourhood level and the<br />
resident level, in an older adult sample.<br />
This study resulted that there was a<br />
positive relation between built<br />
environment factors and walking activity<br />
at the neighbourhood level. At the<br />
resident level, perceptions of safety for<br />
walking and number of nearby<br />
recreational facilities were positively<br />
related to high levels of walking activity.<br />
Also a significant interaction was<br />
observed between number of street<br />
intersections and perceptions of safety<br />
from traffic. In a similar study by Giles-<br />
Corti, Broomhall et al (Giles-Corti,<br />
Broomhall et al. 2005) it was found that<br />
the likelihood of using public open spaces<br />
increased with increasing levels of<br />
access, but the effect was greater in the<br />
model that adjusted for distance,<br />
attractiveness, and size. After<br />
adjustment, those with very good access<br />
to large, attractive open spaces were<br />
50% more likely to achieve high levels of<br />
walking. The observational study also<br />
showed that after matching open spaces<br />
for size and location, 70% of users<br />
observed visited attractive public open<br />
spaces.<br />
World Transport Policy & Practice___________________________________________________<br />
Volume 13.1 September 2006<br />
65
With analysing the influence of personal<br />
characteristics and the attributes of the<br />
residential environment on travel<br />
behaviour in Randstad Holland Region<br />
(Dieleman, Dijet et al. 2002) it was found<br />
that both set of factors have a strong<br />
influence on modal choice and distance<br />
travelled. The characteristics of<br />
residential environment retain their<br />
impact on travel when personal factors<br />
are held constant, as the results from the<br />
multivariate analyses demonstrate.<br />
Those living in the suburbs and rural<br />
regions have to travel longer distances to<br />
work, either by car or public transport.<br />
For shopping trips, urban form plays a<br />
substantial part in the distance travelled<br />
by public transport. Those living in rural<br />
areas or suburbs travel longer distance<br />
via public transport. In fact, the two sets<br />
of factors are of about equal importance<br />
for modal choice and distance travelled,<br />
although trip purpose modifies these<br />
relationships considerably, especially for<br />
distances travelled for shopping and<br />
leisure.<br />
Handy (Handy 1996) suggested that<br />
given motivation to walk, urban form is<br />
an external factor that can enable actual<br />
walk. A traditional walkable design<br />
encourages walking for shopping<br />
purpose, however, the newly designed<br />
suburbs can do the same if they afford<br />
retailing and stores within walkable<br />
distance. In addition, Handy showed that<br />
land use patterns affect the choice set<br />
formation of travel modes which are<br />
realistic to the trip maker: land use<br />
makes a difference in determining<br />
whether residents perceived walking as<br />
an option available to them. Frank and<br />
Pivo (Frank and Pivo 1994) found that<br />
while residential density of trip origin is<br />
an important factor in choosing a mode,<br />
employment density of destination does<br />
matter.<br />
However, not all studies found a<br />
significant contribution of urban form<br />
features in influencing travel behaviour.<br />
A study by Crane and Crepeau (Crane<br />
and Crepeau 1998) in US, found that<br />
there is no evidence that street network<br />
impacts upon the decision of mode<br />
choice for non-work travelling. In<br />
Portland, Oregon, Hess (Hess 2001)<br />
suggested that there is an expected<br />
significant influence for parking charges<br />
on decisions to drive alone or to take<br />
alternative modes. But, there is no<br />
evidence that land use and proximity to<br />
light rail can change the modal choice<br />
decision.<br />
Boarnet and Crane (Boarnet and Crane<br />
2001) suggest that the environment<br />
friendly travel pattern in densely<br />
developed areas, close to or in the city<br />
centre, may well be a result of their<br />
preferences for living there. They<br />
basically welcome the opportunity that<br />
city life offers for reduced travels. That is<br />
one of the reasons why they reside<br />
there. I argue, however, this selfselection<br />
doesn’t seem to change the<br />
hypothesis that neighbourhood design<br />
matters. In fact, when somebody<br />
voluntarily prefers to live in a place that<br />
induces walking and bicycling in daily life<br />
(thus subsequently avoiding using car) is<br />
a fair example of the importance and<br />
consideration of neighbourhood design.<br />
There will be no change if we assume<br />
that the residents have been unwillingly<br />
surrounded by neighbourhood facilities<br />
instead of choosing deliberately the<br />
neighbourhood.<br />
Brunton and Brindle (Brunton and Brindle<br />
1999) in a study of the Melbourne<br />
metropolitan area, concluded that<br />
regional accessibility to activities was<br />
World Transport Policy & Practice___________________________________________________<br />
Volume 13.1 September 2006<br />
66
significant factors in car use, while other<br />
urban form factors have relatively little<br />
effect. If a broader range of factors is<br />
considered, the relationship between<br />
density and car using becomes weaker.<br />
They criticized the use of urban planning<br />
for addressing car dependency problems<br />
because of its frail role. They concluded<br />
that rather than take the normative<br />
position that a particular urban form<br />
must be encouraged if desired travel<br />
outcomes are to be achieved, a given city<br />
may be able to adapt to achieve the<br />
desired accessibility level in several<br />
ways. Policy may then be able to be<br />
based on setting target levels of<br />
accessibility rather than density for<br />
particular areas and land uses. The study<br />
by Brunton and Brindle (Brunton and<br />
Brindle 1999) considered aggregated<br />
attributes and measures of land use and<br />
travel, failing to consider the finer<br />
characteristics of neighbourhoods (such<br />
as provisions for various forms of travel,<br />
neighbourhood character and its<br />
conduciveness for non-motorised forms<br />
of travel), the socio-demographics of the<br />
population (such as the difference in<br />
travel patterns of individuals and<br />
households), and the type of travel being<br />
undertaken.<br />
The study by Giles-Corti and Donovan<br />
(Giles-Corti and Donovan 2002) in Perth,<br />
found that the influence of the built<br />
environment on physical activity levels,<br />
was marginal to individual social factors<br />
and individual’s characteristics. Despite<br />
this, access to open spaces and<br />
recreational facilities determined whether<br />
or not they were used. Thus, in this way,<br />
it can support and enhance the<br />
achievement of appropriate levels of<br />
physical activity behaviour. One<br />
limitation of this study is choosing a<br />
specific area which was homogeneous<br />
with less diversity within it. Also the<br />
method of analysis can be criticised due<br />
to its simple assumption on link between<br />
exogenous factors.<br />
It sounds that the relationship between<br />
urban form and travel behaviour is more<br />
complex than it may seem on the<br />
surface. The methodological obstacles,<br />
has made it difficult to study the causal<br />
relationship. While some scholars have<br />
argued that the relationship is marginal,<br />
others suggest finding better ways to<br />
study on urban form-travel interactions<br />
(Handy 1996).<br />
The policies that emerge from the<br />
research for directing the new<br />
development or revision of the existing<br />
situation have to be supported with<br />
relevant empirical work to be more<br />
reliable. The critique of these studies has<br />
suggested that a number of issues must<br />
be taken into account when drawing any<br />
conclusions for policy (Stead and<br />
Marshall 2001). These issues include the<br />
strength of the evidence, the<br />
transferability of findings, the scale of<br />
analysis, and the causality of<br />
relationships. Therefore, the degree to<br />
which urban form might affect travel<br />
behaviour can be lower than literature<br />
has indicated (where they have not<br />
considered socio-economics). Meanwhile,<br />
this does not mean that urban<br />
planning/design does not have a<br />
significant role to play in helping to<br />
achieve more sustainable travel patterns.<br />
Planning policies can influence transport<br />
supply as well as the distribution of land<br />
uses, and so provide a way of influencing<br />
travel demand and/or modal choice.<br />
Methodology<br />
Some of methodological improvements<br />
have been made in this study: using<br />
World Transport Policy & Practice___________________________________________________<br />
Volume 13.1 September 2006<br />
67
discrete choice models to explain<br />
individual behaviour; using GIS for<br />
capturing disaggregated elements of<br />
urban form; incorporating other<br />
important factors such as<br />
household/individual preferences and<br />
attitudes; and also incorporating the<br />
overall structure of city region<br />
surrounded the neighbourhood by<br />
regional accessibility; jobs distribution<br />
and public transport infrastructure<br />
measures.<br />
It is tried to take a disaggregated<br />
approach: in terms of urban form<br />
opertionalising, a Census Collecting<br />
District (CCD)-as defined in (Australian<br />
Bureau of Statistics (ABS) 2001)- is<br />
suggested as spatial unit of analysis.<br />
Thus all local urban form measures were<br />
taken in CCD level. For those measures<br />
with a regional impact, such as<br />
accessibility to work throughout the<br />
metropolitan region, a Traffic Analysis<br />
Zone (TAZ)-as defined in 1999<br />
Metropolitan Adelaide Household Survey<br />
(Government of South Australia 1999)<br />
has been applied as spatial unit. In case,<br />
where a CCD was not compatible with<br />
TAZ, a weighting system was used<br />
suggested by Primerano (Primerano<br />
2004). Using GIS facilitates work with<br />
more precision and efficiency. In case,<br />
GIS maps were not up to dated or<br />
apparent, an on-screen digitising method<br />
used to enter new features or edit<br />
current spatial features. The role of GIS<br />
for preparing data for modelling process<br />
is depicted on Figure 1.<br />
Analysis<br />
Basic Data<br />
Urban Digital Data<br />
GIS Database<br />
/Analyst<br />
Transport Network<br />
and Level of Service<br />
Discrete<br />
Choice<br />
Modelling<br />
Travel Survey Data<br />
Figure 1: The role of GIS for preparing data for modeling process<br />
The original survey consisted of 1500<br />
addresses but only 321 valid addresses.<br />
The response rate is about 21% based on<br />
the valid returned questionnaire only.<br />
This response rate is considered quite<br />
well for a survey of this length, since the<br />
response rate for a survey administered<br />
to the general population is typically 10–<br />
40% (Sommer and Sommer 1997). A<br />
comparison of sample characteristics to<br />
population characteristics, based on the<br />
World Transport Policy & Practice___________________________________________________<br />
Volume 13.1 September 2006<br />
68
2001 Australian Census, showed a<br />
reasonable distribution.<br />
For modelling purpose, a set of discrete<br />
choice models was developed for<br />
modelling individual mode choices. The<br />
models were all discriminated by travel<br />
purpose and the geographic location of<br />
trip makers.<br />
Case Study Areas<br />
The study area includes four residential<br />
suburbs of metropolitan Adelaide:<br />
Norwood, Unley, Golden Grove and Para<br />
Hills. These four suburbs are different in<br />
terms of their physical attributes which is<br />
assumed to make a considerable<br />
difference in travel behaviour of their<br />
residents. Norwood (1853) and Unley<br />
(1871) as typical traditionally designed<br />
neighbourhoods have a mix of land uses,<br />
residential, office, shopping, civic uses,<br />
and entertainment, within easy walking<br />
distance of home. On the other hand,<br />
suburban developed areas: Golden Grove<br />
(1980s — 90s) and Para Hills (1974) lack<br />
heterogeneous land uses. The density of<br />
population and activities of these suburbs<br />
are lower than those of Norwood and<br />
Unley. The styles of housing area mostly<br />
developments of separate houses with<br />
back yards, land-escaped gardens and<br />
parking spaces, however, some<br />
developments made by South Australian<br />
Housing Trust to accommodate different<br />
social groups especially in Golden Grove<br />
(Bosman 2004).<br />
The locations of case study areas within<br />
metropolitan Adelaide are depicted on<br />
figure 2. Some travel characteristics of<br />
the four suburbs are provided in table 1.<br />
Here are a number of facts about these<br />
areas extracted from HTS2005:<br />
• Compared to other two suburbs, the<br />
Para Hills and Golden Grove<br />
populations are younger, which now<br />
forms the age group of 0-35, the<br />
highest age group in terms of<br />
population but the age group over 65<br />
the lowest. This demographic<br />
difference has had its toll on<br />
transport demand market over the<br />
time.<br />
• The areas of Norwood and Unley are<br />
characterized with relatively low car<br />
ownership compared to Golden Grove<br />
and Para Hills suburban areas. It is<br />
interesting that Para Hills has the<br />
highest figure of vehicle ownership<br />
per household: 1.6 vehicles per<br />
household. Also it has the highest<br />
percentage of households with three<br />
vehicles or more. On the other hand<br />
it has the lowest income average and<br />
highest proportion of households with<br />
income lower than $500. This<br />
primarily shows that vehicle<br />
ownership does not depend only on<br />
income level.<br />
• All four suburbs are served properly<br />
by public metro-ticket bus as the<br />
only public mean. Meanwhile, public<br />
transport share in the studied areas<br />
is not significant.<br />
• The average commuting distance is<br />
different for each suburb. While the<br />
residents of Norwood, Unley and Para<br />
Hills should travel about 16, 14 and<br />
18km, the Golden Grove workers<br />
should commute significantly longer:<br />
23km.<br />
• The home rent throughout the four<br />
suburbs is similar: about $200 per<br />
week in average. In contrast,<br />
housing average price for Unley is<br />
highest followed by Norwood and<br />
Golden Grove which are similar<br />
together. In Para Hills, the housing<br />
price is slightly lower.<br />
• Norwood and Unley residents have<br />
higher trip generation (for Norwood<br />
World Transport Policy & Practice___________________________________________________<br />
Volume 13.1 September 2006<br />
69
and Unley were 3.7% and 3.5%<br />
which are higher than those of Para<br />
Hills and Golden Grove: 3.3%). The<br />
travel behaviour among the four case<br />
suburbs is markedly different, as the<br />
two outer suburbs are more cardependent;<br />
• Norwood has the highest share of<br />
short trips with length of less than 1<br />
km (approximately 10%). Golden<br />
Grove has the longest trips for work<br />
(19.5 km) and non-work purposes<br />
(16.3 km).<br />
Figure 2: The Location of Four Case Studied Suburbs and Their Land Use Pattern<br />
Table 1: Travel Characteristics for the Residents of Four Case Studied Areas<br />
Variable Name Norwood Unley<br />
Para Golden<br />
Hills Grove<br />
Car use share for commuting (percent) 78 76 88 91<br />
Car use share for non-work travel 61 60 81 76<br />
(percent)<br />
Walk/bicycle share for commuting 15 11 2 4<br />
(percent)<br />
Walk/bicycle share for non-work 31 28 11 9<br />
(percent)<br />
Public bus share for commuting 3 7 5 6<br />
(percent)<br />
Public bus share for non-work (percent) 6 12 6 9<br />
Average travel time for daily trips (min) 14 16 23 21<br />
Average commuting distance (km) 6.7 5.8 14.6 19.5<br />
Average travel distance for non-work 5.0 5.4 11.1 16.3<br />
(km)<br />
Trip frequency per adult per day 3.7 3.5 3.3 3.3<br />
World Transport Policy & Practice___________________________________________________<br />
Volume 13.1 September 2006<br />
70
Measuring urban form<br />
A set of comparative spatial indicators<br />
were developed to quantify built<br />
environment characteristics. These<br />
measures all together represent the<br />
physical character of a residential<br />
neighbourhood and are assumed to be<br />
relatively independent from each other.<br />
Density was measured using three single<br />
indicators: residential gross density;<br />
employment density and retail density.<br />
The land use entropy index (LUM) is used<br />
as a measure of land use mix 2 . Regional<br />
accessibility to workplaces was calculated<br />
using a gravity-based formula. Proximity<br />
indices for shopping centres and schools<br />
were calculated as the median distance<br />
between them and all residential units<br />
within a neighbourhood area weighted by<br />
the number of dwelling units. To consider<br />
the permeability of each residential<br />
neighbourhood, four different indicators<br />
were developed: the proportion of culde-sacs;<br />
street space allocation as a<br />
proportion of the total centreline<br />
distances of streets in each area; the<br />
route directness index was calculated by<br />
dividing the direct distance between an<br />
origin and destination by the actual<br />
network distance between them and the<br />
average of urban block area. The<br />
composite measures of the suitability of<br />
local streets for walking and cycling: PEF<br />
and CEF - was introduced for this studyrepresent<br />
the quality of the built<br />
environment in terms of physical activity<br />
options (sidewalks, bike lanes), safety<br />
(low traffic, safe for walking/cycling,<br />
street lighting), and attractiveness<br />
(appearance, building setback, variety in<br />
housing styles, landscape). The values<br />
for these two measures were obtained<br />
through a field observation survey (which<br />
was undertaken for 110 streets). The<br />
percentage of neighbourhood area<br />
covered by metropolitan public bus route<br />
buffers was also calculated to consider<br />
the availability of public transport<br />
services. The covered area is the area<br />
within 0.2 km of local bus routes, where<br />
pedestrian connections to transit areas<br />
are available from the surrounding area.<br />
2 Mean land use entropy was computed as:<br />
s<br />
p<br />
−<br />
∑<br />
i=<br />
1<br />
( p )ln( p )<br />
i<br />
ln( s)<br />
where i is the proportions of each of the s<br />
land use types which s is the number of land<br />
uses. Cervero , R., and K. Kockelman (1997).<br />
"Travel Demand and the 3Ds: Density,<br />
Diversity, and DesignTravel demand and 3D's:<br />
density; diversity and design." Transportation<br />
Research D Vol. 2(No. 3.). The number of<br />
seven categories considered for this study:<br />
residential; commercial; recreational;<br />
industrial; governmental; community services<br />
and open spaces.<br />
i<br />
World Transport Policy & Practice___________________________________________________<br />
Volume 13.1 September 2006<br />
71
Table 2: Urban Form Measures for Four Study Areas<br />
Variable Name Norwood Unley Para<br />
Hills<br />
Golden<br />
Grove<br />
Residential Density (persons/ha) 53.8 43.8 30.2 47.2<br />
Employment Density (jobs/ha) 22.1 19.9 6.3 7.6<br />
Retail Density (Percentage of Floor .03 .03 .001 .003<br />
Space)<br />
Land use mix entropy .63 .72 .48 .38<br />
Accessibility to Workplaces 872.6 754.0 1619.2 1633.9<br />
Closeness to Shopping Complex (km) .873 .754 1.619 1.634<br />
Closeness to Schools (km) 1.051 .876 1.588 1.778<br />
Proportion of cul-de-sacs .35 .48 .51 .62<br />
Route directness 1.22 1.37 1.53 1.61<br />
Median block area (ha) 1.9 1.8 5.3 7.2<br />
Pedestrian Environment Factor (PEF) 7.15 6.88 5.4 5.28<br />
Cyclist Environment Factor (CEF) 6.14 5.84 5.09 4.72<br />
Bus Coverage (percent) .60 .64 .53 .73<br />
Street Space Allocation 137 9 137 0 135 1 107 6<br />
The aggregated results for four suburbs<br />
show that Norwood and Unley have<br />
better environment for inducing nonmotorised<br />
travel modes. In addition to<br />
providing various public facilities in these<br />
suburbs, smooth and continuous<br />
sidewalks and on-street bike lanes have<br />
been provided in Norwood, and also<br />
Unley experienced some practice of<br />
traffic calming. Within two outer suburbs<br />
Golden Grove has successful landscapes,<br />
architecture and green spaces.<br />
Meanwhile both outer suburbs need<br />
traffic calming and development of<br />
pedestrian/cyclist infrastructure at local<br />
scale. While Golden Grove has similar<br />
advantages to Unley and Norwood in<br />
terms of suitability for walking/cycling,<br />
the walking and cycling trends in Golden<br />
Grove is lesser. Although there are<br />
relatively good infrastructure; facilities<br />
and landscape for pedestrian and cyclists<br />
in Golden Grove, the question remains<br />
why these residents do not? In fact,<br />
homogeneous land use patterns in<br />
Golden Grove are less encouraging<br />
walking/cycling activities.<br />
Para Hills has the lowest share of nonmotorised<br />
travel, which shows that the<br />
built form is really poor in encouraging<br />
sustainable travel. There are several<br />
disadvantages such as lack of sense of<br />
safety/security after dark; single-zoning;<br />
lack of community sense; lack of local<br />
facilities and a hilly topography.<br />
The primary results from the figures<br />
illustrated on table 1 and table 2,<br />
reinforce the view that bringing origin<br />
and destinations closer together is<br />
associated to increase walking and daily<br />
non-work activity frequencies. The extent<br />
to which this association is casual is the<br />
matter that will be discussed in follow<br />
modelling debates. However, the fact<br />
remains that inner city residents exhibit<br />
higher levels of non-motorised activities.<br />
Modal Choice modelling<br />
Multinominal logit models were<br />
developed and used to evaluate the<br />
World Transport Policy & Practice___________________________________________________<br />
Volume 13.1 September 2006<br />
72
effects of urban form/design variables on<br />
modal choice. The multinomial logit<br />
models estimate the likelihood of<br />
choosing a mode of travel by a household<br />
member. These models use sociodemographics<br />
of the sample households<br />
(and individuals) as exogenous variables<br />
along with the measures of urban<br />
form/design. For analysis, the individual<br />
is considered as the unit of analysis to<br />
achieve more accurate outcomes. Five<br />
mode alternatives were modelled:<br />
• Metro-ticket public bus (C5):<br />
available to all individuals;<br />
• Shared-ride (C4): available to all<br />
individuals;<br />
• Driving alone(C3): available to adult<br />
members with a driver’s licence from<br />
households that have at least one<br />
vehicle available;<br />
• Walking (C2): available to all<br />
individuals;<br />
• Cycling (C1): available to individuals<br />
except those aged over 76 and it is<br />
designated as being also available to<br />
individuals whose trip distance is less<br />
than the maximum distance biked by<br />
an individual in the sample.<br />
The sample data contains 1,027 trip<br />
records taken from HTS2005 database to<br />
represent travel undertaken by<br />
individuals who resided in one of the four<br />
case study areas. One alternative specific<br />
attributes is calculated for non-chosen<br />
alternatives: travel time. Travel time is<br />
calculated using travel distance assuming<br />
constant average speed 3 for different<br />
3 The following values are applied: Car=46.4 ,<br />
Walk= 4.25 , Bicycle=8 (female) or 11<br />
(male), Public Bus=23 km/h (Primerano, F.<br />
(2004). Development of Accessibility<br />
Measures for Transport and Urban<br />
Planning. Transport Systems Centre.<br />
Adelaide, University of South Australia.<br />
modes by dividing the distance travelled<br />
by the speed of the mode alternative for<br />
every trip which is explained earlier.<br />
Results<br />
The modal choice models, including<br />
values of Alternative Specific Constants<br />
(ASCs), Alternative Specific Attributes<br />
(ASAs), values of attribute coefficients<br />
and their significance are detailed in<br />
Appendix 1. The adjusted<br />
2<br />
ρ<br />
values are<br />
good with values ranged from 0.36 to<br />
0.56 (compared to the model with no<br />
coefficients). The t-statistics in the model<br />
are all above the threshold values of<br />
±1.96 (95 percent confidence) showing<br />
that all ASCs and the coefficient<br />
estimates of attributes are all significant.<br />
The coefficients of the alternative specific<br />
attributes are all the expected sign and<br />
are significant. Model coefficients show<br />
the importance and strengths of urban<br />
factors and their ability to improve the<br />
explanatory power of behavioural<br />
models. Driving alone (C3) was taken as<br />
the referent alternative here. All analysis<br />
was done by LIMDEP ver. 7.0 (Greene<br />
1998).<br />
Living farther from Adelaide CBD leads to<br />
a lower propensity to make non-work<br />
trips by non-motorised modes. In<br />
addition, living farther from CBD, is<br />
associated with longer kilometres<br />
travelled for work purpose; they need to<br />
travel longer, or they may travel longer<br />
than they need? One reason is that<br />
employment has remained quite<br />
centralised in metropolitan Adelaide<br />
despite the overall trend to<br />
suburbanisation of jobs:”… 39 per cent of<br />
all jobs held by females in 1991 were still<br />
located in the CBD and inner suburbs,<br />
compared with 33 per cent for males<br />
(Forster 1999), p. 59).” In other words,<br />
the CBD is the largest employment<br />
World Transport Policy & Practice___________________________________________________<br />
Volume 13.1 September 2006<br />
73
centre, with one third of Adelaide's jobs,<br />
and strong employment in the<br />
professional, office and service works.<br />
Other employment centres of smaller<br />
scale also exist in the south, north and<br />
northwest parts of Adelaide. One<br />
advantage of inner suburbs: Norwood<br />
and Unley is better access to<br />
employment centres in CBD. Baker<br />
(Baker 1997) suggested that the<br />
increasing number of employees in CBD<br />
is contributing to the continuing demand<br />
for terraces and town housing in inner<br />
Adelaide.<br />
In addition, when job is located at least 2<br />
kilometres far from home, the likelihood<br />
of walking/cycling to is decreased. On<br />
contrast, higher accessibility to<br />
workplace increases the propensity to<br />
walk/cycle to job. In fact, in Adelaide,<br />
the number of jobs relative to the<br />
resident labour force is relatively low,<br />
thus workers may find it difficult to find a<br />
job near their residential location. This<br />
low job ratio may result in a large<br />
average commute distance and time and<br />
related to this, lower shares of nonmotorised<br />
modes. However, this finding<br />
recommend that employment or<br />
residential relocation may serve as a<br />
means for households to travel shorter,<br />
but it often functions as a last option<br />
when other strategies have proven<br />
insufficient. The reason for this<br />
reluctance to relocate is that substantial<br />
costs are involved in changing jobs and<br />
particularly the place of residence, not<br />
only for the worker but also his/her<br />
family.<br />
recreation and open spaces; within the<br />
studied suburbs, the farther the shopping<br />
centre the less likely an individual catch<br />
public transport to there; Also within the<br />
two outer suburbs, the farther<br />
education/training centre or schools, the<br />
lower the likelihood of walking/cycling to<br />
as expected;<br />
Within the two inner suburbs, higher<br />
network density is associated positively<br />
with the choice of walking/cycling. In<br />
addition, where street space allocation is<br />
higher, it is less likely an individual to be<br />
driven by a household member or drive a<br />
vehicle with passenger to work. Within<br />
the two outer suburbs, individuals tend<br />
to walk/cycle to non-work destinations<br />
where the neighbourhood designed as<br />
permeable. On the other hand, within the<br />
two inner suburbs, where urban block is<br />
larger the likelihood of catching public<br />
transport is lower. As part of non-work<br />
trips are taken by non-motorised means<br />
(15%-25% in studied areas), the impact<br />
of these variables may thus be a mixture<br />
of some local urban fabric factors to ease<br />
the movement through the area.<br />
Within the two inner suburbs, individuals<br />
residing in single-family houses are less<br />
likely to walk, but higher shared-ride<br />
choice to work. On contrast, within the<br />
two outer suburbs, living in<br />
flats/apartments increases the likelihood<br />
of walking/cycling to non-work<br />
destinations. There was no clear casual<br />
relationship between residential/retail<br />
densities on modal choice in studied<br />
areas;<br />
As expected, where land use mixing is<br />
higher, the more likely an individual to<br />
be driven by a household member or<br />
drive a vehicle with passenger to nonwork<br />
destinations such as shopping;<br />
Travel time has a negative coefficient<br />
with choosing a mode for both work and<br />
non-work trips. In fact, the higher the<br />
values of this attribute the lower the<br />
utility, thus, the greater the travel time<br />
World Transport Policy & Practice___________________________________________________<br />
Volume 13.1 September 2006<br />
74
the lower the benefit to the user. This<br />
finding is consistent with Crane and<br />
Crepeau (Crane and Crepeau 1998)<br />
showing the importance of travel time as<br />
a cost factor in a behavioural model.<br />
Furthermore, time plays a central role<br />
when deciding whether to engage in an<br />
activity. A theoretical treatment of the<br />
time constraint problem can be found in<br />
e.g. Jara-Diaz (Jara-Diaz 1998). The<br />
main consequence of the time constraint<br />
for the modelling of non-work trips is<br />
that making a trip of one kind reduces<br />
the time to make a trip of another kind.<br />
Among the social factors, it was found<br />
that women in all four suburbs, are more<br />
likely to drive alone for work trips but<br />
also more likely to choose shared-ride<br />
choice for non-work activities. Females<br />
are more likely to walk in inner suburbs<br />
but less likely to ride a bike.<br />
Retired/unemployed individuals tend to<br />
use public transport. Young adults and<br />
part time/casual workers are likely to get<br />
to work with shared-ride mode.<br />
Individuals certified as driver are less<br />
likely to catch public transport.<br />
Individuals of low income households in<br />
inner suburbs tend to walk/cycle to work.<br />
Individuals of high income families in<br />
outer suburbs are less likely to catch<br />
public transport for non-work<br />
destinations, but those with low income<br />
tend to catch public transport to.<br />
Individuals of low income households in<br />
inner suburbs tend to walk/cycle to nonwork<br />
destinations. The middle-aged<br />
individuals (36-55 years old) are more<br />
likely to drive with a passenger or be<br />
driven by a member of the household.<br />
The presence of children has potential<br />
impact, as many non work car trips are<br />
generated by children’s needs, whether it<br />
is for school, recreational activities, or<br />
medical concerns. The study by<br />
(Rosenbloom and Burns 1993) showed<br />
that both mothers and fathers make a<br />
significant number of trips solely for<br />
children, with mothers making the<br />
majority of these trips for children up to<br />
17 years old.<br />
Conclusions and Implications for<br />
Further Investigation<br />
This study is a primary step in Australian<br />
context with applying a disaggregated<br />
approach; considerable additional<br />
analysis is possible and is encouraged.<br />
The results would help to identify<br />
practical means to incorporate built<br />
environment aspects in local demand<br />
travel forecasting systems, to better<br />
understanding of the connection between<br />
urban form and travel choice behaviour.<br />
This study also may serve to assist other<br />
practitioners in Adelaide in their efforts to<br />
address the issue of induce travel, and to<br />
present better solutions for sustainability<br />
concerns.<br />
The results showed that urban form not<br />
only makes more alternatives also makes<br />
a shift in modal choice. It is important to<br />
say that improving access to more travel<br />
choices does not routinely result to less<br />
car use. As pointed earlier, some people<br />
take their own transport due to their<br />
attitudes and perceptions. They drive<br />
because they believe in it and they want<br />
it regardless of cost, time and other<br />
constraints. In a unique study that<br />
looked at the association between land<br />
use, transportation and attitudes , it was<br />
found that personal attitudes is a strong<br />
predictor of travel behaviour, perhaps<br />
stronger than land use characteristics<br />
(Kitamura, Mokhtarian et al. 1997).<br />
While this research did not consider<br />
individuals’ attitudes directly, the findings<br />
suggest that attitudes may potential<br />
influence travel decisions. <strong>What</strong> this<br />
World Transport Policy & Practice___________________________________________________<br />
Volume 13.1 September 2006<br />
75
esearch suggests is making more<br />
alternatives and improvement in more<br />
sustainable travel modes is a necessary<br />
condition which should be given high<br />
attention in policy and planning.<br />
Walking and cycling are fringe modes<br />
and represent rare behaviours in studied<br />
areas. Even among the inner city<br />
households, and considering all utilitarian<br />
and leisure travel, over a 24-hour period,<br />
only 6% cycled and 23%walked. So<br />
discussing the potential for urban<br />
form/design, to induce or enable<br />
walking/cycling should be taken with<br />
caution. As Sallis and Owen (Sallis and<br />
Owen 1999) discuss, “Interventions in<br />
built environment do not directly change<br />
behaviour. Interventions modify the<br />
factors that control behaviour, and those<br />
changes are expected to lead to<br />
improved behaviour” (p. 135). I mean we<br />
don’t expect to have a dramatically shift<br />
in modal choice just through the<br />
modifications in community design.<br />
However, the theory that urban<br />
form/design matters remains valid and<br />
here suggests that one need to live in a<br />
quality design neighbourhood with a<br />
close proximity-less than 200m as now in<br />
Norwood for instance, to public facilities<br />
to have a significant impact on<br />
walking/cycling. The fact that residents<br />
of Norwood and Unley spend more time<br />
being actively in their neighbourhood<br />
may also be resulted from stronger sense<br />
of community and higher neighbourhood<br />
cohesion which are explaining by many<br />
non-physical factors not sole urban<br />
design features. Intuitively, spending<br />
more time out-doors, in turn, cause an<br />
increase in social communication and<br />
social cohesion over time, and perhaps<br />
as a result reinforce increased physical<br />
activity.<br />
It would be interesting to see whether<br />
physical changes like the construction of<br />
sidewalks or improvement to bike lanes<br />
in an established suburb such as Para<br />
Hills are associated with changes in<br />
walking/cycling, after accounting for<br />
socio-economics. Does move to<br />
environments that offer better<br />
opportunities for walking/cycling<br />
associated with increase in<br />
walking/cycling? In this topic, recently,<br />
on going longitudinal panel studies have<br />
been started in Western Australia, which<br />
is surveying people travel behaviour prior<br />
to and after a residential moving<br />
(University of Western Australia 2004);<br />
An important question remains is that if<br />
increases in modal shifting are not<br />
substantial enough to justify the cost of<br />
improvements in walking/cycling<br />
infrastructure especially in established<br />
suburbs? Since in new developments<br />
such as part of Golden Grove, zoning and<br />
subdivision rules can be modified to allow<br />
proximity to shops, parks and public<br />
services, but in established suburbs it is<br />
challenging. We could refer to other<br />
environmental/health benefits as well as<br />
social impacts.<br />
Only four suburbs have been studied and<br />
a modest survey response rate has been<br />
obtained, so theses results are not<br />
necessarily generalisable unless they are<br />
replicated in other contexts and for<br />
populations with different socioeconomic<br />
attributes. A low variation between urban<br />
form variables in geographical areas, due<br />
to small sample size, plus lesser variation<br />
within suburbs makes the urban form<br />
measures less insensate to detect the<br />
effect of urban form on travel choices.<br />
Information was collected only about the<br />
urban form of the sample sites. Such<br />
kind of information should be gathered<br />
from the characteristics of destinations of<br />
World Transport Policy & Practice___________________________________________________<br />
Volume 13.1 September 2006<br />
76
daily commuting. Similarly, data on the<br />
destination of midday travel, trip<br />
chaining, or other related topics were not<br />
included, because the attraction of those<br />
trips made outside of the origin suburbs<br />
are important as well.<br />
References:<br />
Australian Bureau of Statistics (ABS)<br />
(2001). Census of Population and<br />
Housing: Journey to Work datasheets.<br />
Australia.<br />
Baker, E. (1997). Gentrication and<br />
gender effects in North Adelaide.<br />
Department of Geographical and<br />
Environmental Studies, University of<br />
Adelaide.<br />
Boarnet, M. G. and R. Crane (2001).<br />
Travel by design. The influence of urban<br />
form on travel, Oxford University Press.<br />
Bosman , C. (2004). "Homes for<br />
everyone." Journal of Australian<br />
Studies(80).<br />
Brunton, P. and R. Brindle (1999). The<br />
relationship between urban form and<br />
travel behaviour. ARRB Research Report.<br />
Australia., ARRB.<br />
Cervero , R., and K. Kockelman (1997).<br />
"Travel Demand and the 3Ds: Density,<br />
Diversity, and DesignTravel demand and<br />
3D's: density; diversity and design."<br />
Transportation Research D Vol. 2(No. 3.).<br />
Crane, R. (2000). "The influence of urban<br />
form on travel: An interpretive review."<br />
Journal of Planning Literature 15(1): 3-<br />
22.<br />
Crane, R. and R. Crepeau (1998). "Does<br />
Neighbourhood Design Influence Travel?<br />
A Behavioural Analysis of Travel Diary<br />
and GIS Data." Transport Research<br />
Digest 3(4): 225-238.<br />
Dieleman, F. M., M. Dijet, et al. (2002).<br />
"Urban Form and Travel Behaviour:<br />
Micro-level Household Attributes and<br />
Residential Context." Urban Studies<br />
39(3): 507–527.<br />
Forster, C. (1999). Australian Cities:<br />
Continuity and Change. Melbourne,<br />
Oxford University Press.<br />
Frank, L. and G. Pivo (1994). "The<br />
impacts of mixed use and density on the<br />
utilization of three modes of travel: the<br />
single occupant vehicle, transit and<br />
walking." Transportation Research<br />
Record 1466: 44-52.<br />
Giles-Corti, B., M. H. Broomhall, et al.<br />
(2005). "Increasing Walking How<br />
Important Is Distance To, Attractiveness,<br />
and Size of Public Open Space?"<br />
American Journal of Preventive Medicine<br />
28(2S2): 1817–1842.<br />
Giles-Corti, B. and R. J. Donovan (2002).<br />
"The relative influence of individual,<br />
social and physical environment<br />
determinants of physical activity." Social<br />
Science & Medicine 54: 1793–1812.<br />
Government of South Australia (1999).<br />
Metropolitan Adelaide Household Travel<br />
Survey (MAHTS). Adelaide, Department<br />
of Transport and Planning.<br />
Greene , W. H. (1998). LIMDEP Version<br />
7.0 : User's Manual. Sydney,<br />
<strong>Eco</strong>nometric Software, Inc.<br />
Handy, S. (1996). "Understanding the<br />
link between urban form and non work<br />
travel behaviour." Journal of Planning<br />
Education and Research 15: 183-198.<br />
Hess, D. E. (2001). "Effect of free<br />
parking on commuter mode choice:<br />
Evidence from travel diary data."<br />
Transportation Research Record 1753:<br />
35-42.<br />
Jara-Diaz , S. R. (1998). Time and<br />
income in travel choice: towards a<br />
microeconomic activity-based theoretical<br />
framework. Theoretical Foundations of<br />
Travel Choice Modelling. T. Garling, T.<br />
Laitila and K. Westin. Oxford, Pergamon:<br />
1-30.<br />
Kitamura, R., P. L. Mokhtarian, et al.<br />
(1997). "A micro-analysis of land use and<br />
travel in five neighbourhoods in the San<br />
World Transport Policy & Practice___________________________________________________<br />
Volume 13.1 September 2006<br />
77
Francisco Bay Area." Transportation 24:<br />
125-158.<br />
Knox , S. (2003). "Planning as a Public<br />
Health Issue." Urban Policy and Research<br />
21(No. 4): 317–319.<br />
Li, F. K., J. Fisher, et al. (2005).<br />
"Multilevel modelling of built environment<br />
characteristics related to neighbourhood<br />
walking<br />
activity in older adults." Journal of<br />
Epidemiology and Community Health 59:<br />
558-564.<br />
Moriarty, P. and C. Beed (1992).<br />
Explanation of personal travel increases<br />
in Australian cities. Australasian<br />
Transport Research Forum, Canberra.<br />
Primerano, F. (2004). Development of<br />
Accessibility Measures for Transport and<br />
Urban Planning. Transport Systems<br />
Centre. Adelaide, University of South<br />
Australia.<br />
Rosenbloom, S. and E. Burns (1993).<br />
"Why working women drive alone:<br />
Implications of the travel reduction<br />
programs." Transportation Research<br />
Record 1459: 39-45.<br />
Sallis, J. F. and N. Owen (1999). Physical<br />
Activity and Behavioural Medicine:<br />
Thousand Oaks. California, Sage.<br />
Sommer, B. and R. Sommer (1997). A<br />
Practical Guide to Behavioral Research:<br />
Tools and Techniques. New York, NY.,<br />
Oxford University Press.<br />
Stead, D. and S. Marshall (2001). "The<br />
Relationships between Urban Form and<br />
Travel Patterns. An International Review<br />
and Evaluation." EJTIR 1(2).<br />
The Western Australian Planning<br />
Commission (1997). the Liveable<br />
Neighbourhoods Community Design<br />
Code. Perth, Department for Planning<br />
and Infrastructure, WA.<br />
Turton, H. and C. Hamilton (August<br />
2002). <strong>Up</strong>dating per capita emissions for<br />
industrialised countries, The Australia<br />
Institute.<br />
University of Western Australia (2004).<br />
The RESIDE (RESIDential Environments)<br />
Project. Perth, School of Population<br />
Health. 2006.<br />
Address for correspondence:<br />
Ali Soltani<br />
Ali.Soltani@postgrads.unisa.edu.au<br />
Dr Andrew Allan<br />
Senior Lecturer, School of Natural and<br />
Built Environments, University of South<br />
Australia<br />
Dr Sekhar Somenahalli<br />
Lecturer, School of Natural and Built<br />
Environments, University of South<br />
Australia<br />
Dr Frank Primerano<br />
Senior Transport Analyst, Department for<br />
Transport, Energy and Infrastructure,<br />
Government of South Australia<br />
World Transport Policy & Practice___________________________________________________<br />
Volume 13.1 September 2006<br />
78
World Transport Policy & Practice<br />
<strong>Eco</strong>-<strong>Logica</strong> Ltd. ISSN 1352-7614<br />
World Transport Policy & Practice___________________________________________________<br />
Volume 13.1 September 2006<br />
79