CNPA BASIC PETROLEUM GEOLOGY TRAINING - CCOP
CNPA BASIC PETROLEUM GEOLOGY TRAINING - CCOP
CNPA BASIC PETROLEUM GEOLOGY TRAINING - CCOP

You also want an ePaper? Increase the reach of your titles
YUMPU automatically turns print PDFs into web optimized ePapers that Google loves.
MODULE 4<br />
4.0 RESERVOIR ROCK EVALUATION<br />
4.1 Porosity<br />
4.1.1 Porosity Determination<br />
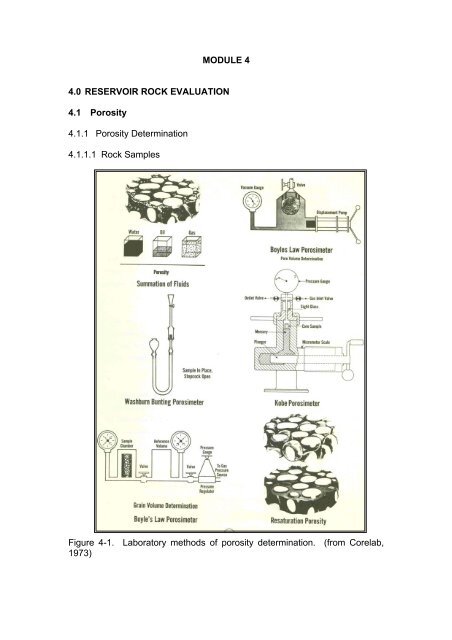
4.1.1.1 Rock Samples<br />
Figure 4-1. Laboratory methods of porosity determination. (from Corelab,<br />
1973)
Bulk volume is first determined by displacement of liquid, or by accurately<br />
measuring a shaped sample and computing its volume.<br />
Then any of the following methods are used to measure either the pore<br />
volume or grain volume.<br />
1. Summation of Pore Fluids – involves independent determination of<br />
gas, oil and pore water volumes from a fresh core sample. The pore<br />
volume is determined by adding up the three independent volumes.<br />
2. Washburn-Bunting Method – measures pore volume by vacuum<br />
extraction and collection of the gas (usually air) contained in the pores.<br />
3. Liquid Resaturation – pores of a prepared sample are filled with a liquid<br />
of known density and the weight increase of the sample is divided by<br />
the liquid density.<br />
4. Boyle’s Law Method – involves the compression of a gas into the pores<br />
or the expansion of gas from the pores of a prepared sample. Either<br />
pore volume or grain volume may be determined depending upon the<br />
porosimeter and procedure used.<br />
5. Grain Density – measures total porosity. After the dry weight and bulk<br />
volume of the sample are determined, the sample is reduced to grain<br />
size and the grain volume is determined and subtracted from the bulk<br />
volume.<br />
Another method of porosity determination is by petrographic analysis of thin<br />
sections of a rock sample. This is done by point counting of pores under a<br />
microscope. Impregnation of the sample in a vacuum with dyed resin<br />
facilitates pore identification.<br />
4.1.1.2 Well Logs<br />
A common source of porosity data are the well logs. Porosity may be<br />
calculated from the sonic, density, and neutron logs. These three logs are<br />
usually referred to as porosity logs. Porosity may also be obtained from the<br />
resistivity logs.
4.2 Permeability<br />
4.2.1 Permeability Determination<br />
4.2.1.1 Rock Samples<br />
Figure 4-2. Laboratory measurement of permeability. (from Corelab, 1973)<br />
Laboratory measurement of permeability usually uses air as the flow fluid and<br />
thus the value obtained is permeability to air (K air ).<br />
4.2.1.2 Production and Flow Test<br />
Permeability values may also be obtained from results of flow test<br />
4.2.1.3 Well Logs<br />
• RFT – repeat formation test<br />
• DST – drill stem test<br />
New methods of quantification of permeability using well logs are also being<br />
developed:<br />
• Resistivity Gradient<br />
• Porosity and Water Saturation
Absolute Permeability (k) – permeability of a rock to a fluid when the rock is<br />
100% saturated with that fluid.<br />
Example:<br />
Assume a core sample, 100% saturated with brine, 2 cm 2 in cross-section and<br />
3 cm long flows a 1 centipoise (cp) brine at the rate of 0.5 cm 3 /s under a 2<br />
atmosphere (atm) pressure differential. Its absolute permeability is<br />
k =<br />
Qµ L<br />
( P P2 ) A<br />
1<br />
−<br />
=<br />
3<br />
(0.5 cm / s)(1<br />
cp)(3<br />
cm)<br />
2<br />
(2 atm)(2<br />
cm )<br />
= 0.375 darcy or 375 md<br />
If the brine in the core sample in the above example is replaced by an oil of 3<br />
cp viscosity under the same pressure differential and the oil flow rate is 0.167<br />
cm 3 /s, the absolute permeability is again<br />
k =<br />
Qµ L<br />
( P P ) 2<br />
A<br />
1<br />
−<br />
=<br />
3<br />
(0.167 cm / s)(3<br />
cp)(3<br />
cm)<br />
2<br />
(2 atm)(2<br />
cm )<br />
= 0.375 darcy or 375 md<br />
Effective Permeability (k e )– permeability of a rock to a particular fluid when<br />
that fluid has a pore saturation of less than 100%<br />
Example:<br />
Using the same previous example, but this time the core has 70% water<br />
saturation (Sw=70%) and 30 % oil saturation (So=30%) and, at these and<br />
only these saturations, under the same pressure drop it flows 0.3 cm 3 /s of the<br />
brine and 0.02 cm 3 /s of the oil, then the effective permeability to water (k w ) is<br />
3<br />
Qµ<br />
L (0.3 cm / s)(1<br />
cp)(3<br />
cm)<br />
K w =<br />
( P P ) =<br />
= 0.225 darcy or 225 md<br />
2<br />
2<br />
A (2 atm)(2<br />
cm )<br />
1<br />
−<br />
and the effective permeability to oil is<br />
3<br />
Qµ L (0.02 cm / s)(3<br />
cp)(3<br />
cm)<br />
K o =<br />
( P P ) =<br />
2<br />
2<br />
A (2 atm)(2<br />
cm )<br />
1<br />
−<br />
= 0.045 darcy or 45 md<br />
Relative Permeability (k r ) – the ratio of the effective permeability of a fluid at a<br />
given value of saturation to the effective permeability of that fluid at 100%<br />
saturation (absolute permeability), expressed as a fraction from 0 to 1.<br />
In the example used, the relative permeabilities are<br />
kw 0.225<br />
ko 0.045<br />
k rw = = = 0.60 k ro = = = 0.12<br />
k 0. 375<br />
k 0. 375
4.3 Relation of Permeability to Porosity<br />
Many investigators have attempted to correlate permeability to porosity, grain<br />
size and shape, and packing. The most frequently used relation was<br />
developed by Kozeny as follows:<br />
3<br />
φ<br />
k =<br />
2<br />
2<br />
5× Sv × (1 −φ)<br />
k = permeability, cm2 (= 1.013 x 10 8 darcies)<br />
Φ = effective porosity<br />
Sv = total grain surface/unit volume of reservoir, cm 2 /cm 3<br />
The following figures show the relationship of grain size (Figure 4-1) and<br />
sorting (Figure 4-2) to porosity and permeability.<br />
Figure 4-1. Porosity, permeability and grain size. Porosity is not affected by<br />
grain size but permeability increases with increase in grain size.
Figure 4-2. Porosity and permeability are affected by sorting, both increases<br />
with better sorting.