Investor Presentation - Dorman Products
Investor Presentation - Dorman Products
Investor Presentation - Dorman Products

Create successful ePaper yourself
Turn your PDF publications into a flip-book with our unique Google optimized e-Paper software.
March 2014<br />
© 2013 <strong>Dorman</strong> <strong>Products</strong>, Inc. Contains confidential and proprietary information of <strong>Dorman</strong> <strong>Products</strong>.<br />
Information contained herein is intended only for the recipient(s). Any disclosure, copying, or distribution is strictly prohibited.<br />
1
Forward Looking Statements<br />
Certain statements in this presentation constitute “forward-looking statements” within<br />
the meaning of the Private Securities Litigation Reform Act of 1995. Words such as<br />
“believe,” “demonstrate,” “expect,” “estimate,” “forecast,” “anticipate,” “should” and<br />
“likely” and similar expressions identify forward-looking statements. In addition,<br />
statements that are not historical should also be considered forward-looking statements.<br />
Readers are cautioned not to place undue reliance on those forward-looking statements,<br />
which speak only as of the date the statement was made. Such forward-looking<br />
statements are based on current expectations that involve a number of known and<br />
unknown risks, uncertainties and other factors which may cause actual events to be<br />
materially different from those expressed or implied by such forward-looking statements.<br />
These factors include, but are not limited to, competition in the automotive aftermarket<br />
industry, concentration of the Company’s sales and accounts receivable among a small<br />
number of customers, the impact of consolidation in the automotive aftermarket industry,<br />
foreign currency fluctuations, dependence on senior management and other risks detailed<br />
in the Company’s filings with the Securities and Exchange Commission, including its<br />
Annual Report on Form 10-K for the fiscal year ended December 28, 2013. The<br />
Company undertakes no obligation to update this information, including any forward<br />
looking statements, to reflect subsequently occurring events or circumstances<br />
2
Agenda<br />
<strong>Dorman</strong> Snapshot<br />
Industry Dynamics<br />
Growth Strategy<br />
Financial Results<br />
Summary<br />
3
Snapshot<br />
► Founded in 1978<br />
► NASDAQ listed since 1991: DORM<br />
► Founding Family = 26% Ownership<br />
► Dominant Aftermarket supplier of Formerly ‘Dealer<br />
Only’ Parts<br />
► Sales ‐ $664 million<br />
• > 150,000 SKUs representing 58,000 unique parts<br />
• > 150 managed product lines<br />
4
<strong>Dorman</strong>’s Core Competencies<br />
Unique Business Model:<br />
“New-to-the-Aftermarket”<br />
U.S.<br />
Retail<br />
43%<br />
Broad Distribution<br />
Other<br />
8%<br />
U.S.<br />
Traditional<br />
49%<br />
International Sourcing Expertise<br />
150,000 SKU Product Portfolio<br />
Focuses on ‘Niche’ Offerings<br />
Powertrain<br />
36%<br />
Chassis<br />
25%<br />
Hardware<br />
9%<br />
• Virtually no Manufacturing Assets<br />
Auto Body<br />
30%<br />
Note: Distribution and Product data as December 2013<br />
5
Industry Dynamics<br />
Source:<br />
Sources: AAIA 2014 Factbook, US Dept of<br />
Transportation, and US Energy Information Admin.<br />
6
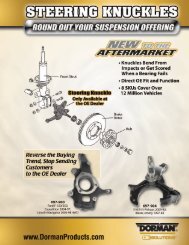
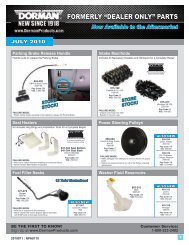
New‐to‐the‐Aftermarket Driving <strong>Dorman</strong> Growth<br />
New<br />
► Items previously only available at the OE Dealer or Salvage Yard<br />
► Drives comp store sales growth for customers<br />
Source: AAIA 2014 Factbook<br />
(2013 Aftermarket Estimated)<br />
7
New‐to‐the‐Aftermarket <strong>Products</strong><br />
New Product Sales Opportunities for our customers:<br />
2010 2011 2012 2013 Total<br />
New to the Aftermarket 657 680 804 873 3,014<br />
Line Extensions (many of which are exclusive items) 1,192 1,451 1,911 2,587 7,141<br />
Total unique parts introduced 1,849 2,131 2,715 3,460 10,155<br />
Growth over prior year 15% 27% 27%<br />
OE Dealer<br />
Exclusives<br />
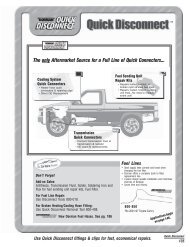
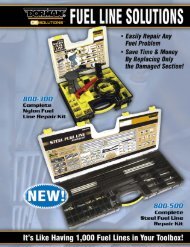
Job Replacement<br />
Kits<br />
Replace the Piece,<br />
Not the Assembly<br />
Underserved<br />
Competitive<br />
Variable Valve Timing Solenoids<br />
Exhaust Manifold Kits<br />
Door Handle Replacement Kits<br />
Control Arms<br />
8
New‐to‐the‐Aftermarket Engine<br />
► 23% of sales from products introduced in last two years<br />
► Culture of Contribution Drives Innovation<br />
• Unique installer relationships and feedback network to identify<br />
failure‐prone OEM parts<br />
• 330+ product personnel in co‐located and virtual teams in US and<br />
Asia<br />
• Strong quality and engineering focus R&D Investments<br />
with over 140 engineering and quality<br />
professionals on staff<br />
$15.0<br />
$10.5<br />
• Emphasis on ROI, speed to market $10.0<br />
$8.6<br />
and quality<br />
► Manufacturing base of<br />
several hundred suppliers<br />
• 75% sourced internationally<br />
• No manufacturer >10% of purchases<br />
Millions<br />
$5.0<br />
$0.0<br />
$4.6<br />
$13.4<br />
2010 2011 2012 2013<br />
9
Awareness Designed to Change Buying Habits<br />
Product Training<br />
Developing the tools needed to effectively<br />
communicate the <strong>Dorman</strong> Advantage<br />
Website<br />
The best source for comprehensive and<br />
constantly updated information<br />
First‐to‐Stock Program<br />
Customized marketing solutions for our<br />
customers<br />
Email Marketing<br />
Integrated approach to growing <strong>Dorman</strong>’s<br />
reach via database of customer contacts<br />
Advertising<br />
Growing product and brand awareness<br />
through digital and conventional ads<br />
Video<br />
<strong>Dorman</strong>’s YouTube channel offers<br />
product training and installation videos<br />
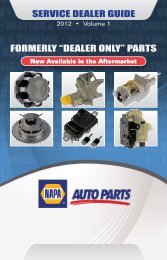
Service Dealer Guides<br />
Highlights new product introductions,<br />
600,000+ copies circulated every four months<br />
Tradeshow Support<br />
Supporting national, regional and customer<br />
show events year round<br />
New Product Announcements<br />
Monthly new product announcements emailed to<br />
over 40,000 customers and end users<br />
Social Media<br />
Leveraging popular media platforms to<br />
increase product exposure<br />
10
Growth<br />
Markets<br />
• US and Canadian Automotive Markets<br />
• Medium & Heavy Duty Aftermarket<br />
• Mexico<br />
• Light Duty Diesel<br />
Future Opportunities<br />
• Another market by 2015<br />
• Opportunistic acquisition<br />
• Expertise in Automotive<br />
• Distribution in new North American Markets<br />
11
Medium and Heavy Duty Markets<br />
►<strong>Dorman</strong> HD Solutions launched in January 2012<br />
►Dedicated product development team<br />
•Over 300 HD specific SKU’s available<br />
Approximately 1/3 rd the<br />
size of the automotive<br />
aftermarket<br />
•Over 200 SKU’s in development<br />
► Represents approximately 1% of sales<br />
Source: AAIA 2014 Factbook<br />
12
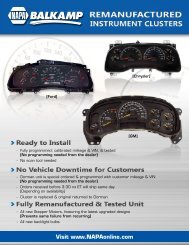
<strong>Dorman</strong> Hybrid Drive Batteries<br />
Source: R. L. Polk & Co.<br />
• Ready‐to‐install direct<br />
replacements<br />
• No programming required!<br />
• Coming Soon: Coverage for<br />
Camry, Accord & Insight<br />
• Complete details available:<br />
www.<strong>Dorman</strong>Hybrid.com<br />
587‐001<br />
Toyota Prius, 2009‐04<br />
587‐004<br />
Honda Civic, 2011‐06<br />
13
Financial Results Summary<br />
► Strong track record of organic revenue and EPS growth<br />
• 5 year sales CAGR 16% through 2013<br />
• EPS up from $0.75 in 2009 to $2.24 in 2013<br />
► Operating leverage enabled by outsourced manufacturing model<br />
• Gross margin expansion<br />
• SG&A leverage<br />
• Operating margins<br />
increase<br />
► Strong balance sheet with no debt<br />
► Stable working capital trends<br />
14
Strong Organic Sales and Earnings Growth<br />
Sales (in millions) –5 year CAGR 16% EPS before one time items –5 year CAGR 35%<br />
Fourth Quarter<br />
15
Summary Income Statement<br />
Fourth Quarter<br />
Fiscal Year<br />
2012 2013 2012 2013<br />
Net Sales $ 135,014 $ 169,809 $ 570,420 $ 664,466<br />
Gross Profit 51,841 66,085 215,209 260,968<br />
Margin 38.4% 38.9% 37.7% 39.3%<br />
S,G&A 28,875 34,478 110,978 133,029<br />
Op. Income 22,966 31,607 104,231 127,939<br />
Margin 17.0% 18.6% 18.3% 19.3%<br />
Int. and Other 33 41 123 189<br />
Income Taxes 7,684 10,947 37,703 45,830<br />
Net Income $ 15,249 $ 20,619 $ 66,405 $ 81,920<br />
Diluted EPS $ 0.42 $ 0.56 $ 1.82 $ 2.24<br />
16
Balance Sheet<br />
December December<br />
2012 2013<br />
Cash $ 27,708 $ 60,593<br />
AR 140,180 180,777<br />
Inventory 145,270 164,421<br />
Other current assets 22,891 26,649<br />
P,P & E, net 48,758 64,786<br />
Goodwill and other assets 27,876 31,943<br />
Total Assets $ 412,683 $ 529,169<br />
Debt $ - $ -<br />
Current liabilities 63,685 91,738<br />
Long term liabilities 16,126 23,790<br />
Equity 332,872 413,641<br />
Liab and Equity $ 412,683 $ 529,169<br />
Net Working Capital $ 272,364 $ 340,702<br />
17
Cash Flow<br />
Fiscal Year<br />
2012 2013<br />
Net Income $ 70,962 $ 81,920<br />
Dep'n and Amort'n 8,225 10,159<br />
Change in AR (9,730) (40,791)<br />
Change in Inventory (29,405) (19,045)<br />
Change in AP 10,738 17,627<br />
Other W/C Items (1,879) 11,689<br />
Operating C/F 48,911 61,559<br />
Capital Spending (18,078) (26,563)<br />
Dividend (54,716) -<br />
Other Changes 1,395 (2,111)<br />
Net Change in Cash $ (22,488) $ 32,885<br />
Free Cash Flow $ 30,833 $ 34,996<br />
Historical cap ex around 2% of sales excluding one-time projects<br />
18
Summary<br />
► Dominant New‐to‐the‐Aftermarket<br />
Parts Supplier<br />
► Strong Growth Opportunities<br />
► Long Track Record of Revenue and Cash<br />
Flow Growth<br />
► Solid Balance Sheet<br />
19
Questions?<br />
Matt Barton<br />
President<br />
mbarton@dormanproducts.com<br />
215-712-5132<br />
Matt Kohnke<br />
Chief Financial Officer<br />
mkohnke@dormanproducts.com<br />
215-712-5182<br />
20