Primergy rx300 s7
Primergy rx300 s7
Primergy rx300 s7

You also want an ePaper? Increase the reach of your titles
YUMPU automatically turns print PDFs into web optimized ePapers that Google loves.
TPC Benchmark E and<br />
TPC Benchmark Energy<br />
Full Disclosure Report for<br />
PRIMERGY RX300 S7<br />
Using<br />
Microsoft SQL Server 2012<br />
Enterprise Edition<br />
Using<br />
Microsoft Windows Server 2008 R2<br />
Enterprise Edition SP1<br />
TPC-E Version 1.12.0<br />
TPC-Energy Version 1.4.2<br />
Submitted for Review<br />
July 5, 2012
First Edition July 2012<br />
Fujitsu believes that the information in this document is accurate as of the publication date. The information in this<br />
document is subject to change without notice. We assume no responsibility for any errors that may appear in this<br />
document. The pricing information in this document is believed to accurately reflect the current prices as of the<br />
publication date. However, we provide no warranty of the pricing information in this document.<br />
Benchmark results are highly dependent upon workload, specific application requirements, system design and<br />
implementation. Relative system performance will vary as a result of these and other factors. Therefore, TPC<br />
Benchmark E should not be used as a substitute for a specific customer application benchmark when critical<br />
capacity planning and/or product evaluation decisions are contemplated.<br />
All performance data contained in this report were obtained in a rigorously controlled environment. Results obtained in<br />
other operating environments may vary significantly. We do not warrant or represent that a user can or will achieve<br />
similar performance expressed in transactions per second (tpsE) or normalized price/performance ($/tpsE). No<br />
warranty of system performance or price/performance is expressed or implied in this report.<br />
Copyright © 2012 Fujitsu. All rights reserved.<br />
Permission is hereby granted to reproduce this document in whole or in part provided the copyright notice printed<br />
above is set forth in full text on the title page of each item reproduced.<br />
PRIMERGY RX300 S7 and PRIMERGY RX200 S7 are trademarks of Fujitsu.<br />
Microsoft Windows Server 2008 R2, Microsoft SQL Server 2012 and BenchCraft are registered trademarks of<br />
Microsoft Corporation.<br />
Intel ® Xeon ® Processor is a registered trademark of Intel.<br />
TPC Benchmark is a trademark of the Transaction Processing Performance Council (TPC).<br />
Other product names mentioned in this document may be trademarks and/or registered trademarks of their respective<br />
companies.<br />
Fujitsu July 2012. TPC-E Full Disclosure Report -2-
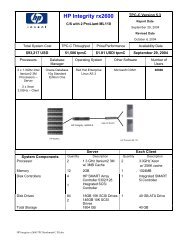
Abstract<br />
This report documents the TPC Benchmark E results achieved by Fujitsu using Microsoft SQL Server 2012<br />
Enterprise Edition.<br />
The TPC Benchmark E tests were run on a PRIMERGY RX300 S7 system using the Microsoft Windows Server<br />
2008 R2 Enterprise Edition SP1 operating system.<br />
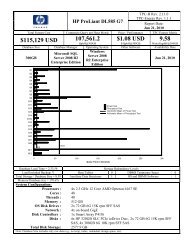
The results, summarized below, show the number of TPC Benchmark E transactions per second (tpsE), the price<br />
per tpsE ($/tpsE) and the TPC-Energy (Watts/tpsE).<br />
Hardware<br />
Fujitsu<br />
PRIMERGY<br />
RX300 S7<br />
Software<br />
Microsoft SQL<br />
Server 2012<br />
Enterprise Edition<br />
Microsoft Windows<br />
Server 2008 R2<br />
Enterprise Edition<br />
SP1<br />
Total System<br />
Cost tpsE $ USD/tpsE Availability Date<br />
$ 328,623 USD 1,871.81 $ 175.57 USD August 17, 2012<br />
Hardware TPC-Energy Average Power of REC Idle Power of REC<br />
Fujitsu<br />
PRIMERGY<br />
RX300 S7<br />
0.69 Watts/tpsE 1,288.82 Watts 843.88 Watts<br />
The benchmark implementation and results were audited by Francois Raab for InfoSizing Inc. (www.sizing.com). The<br />
auditor’s attestation letter is contained in Section 8 of this report.<br />
Fujitsu July 2012. TPC-E Full Disclosure Report -3-
PRIMERGY RX300 S7<br />
TPC-E 1.12.0<br />
TPC Pricing 1.7.0<br />
TPC-Energy 1.4.2<br />
Report Date<br />
July 5, 2012<br />
TPC-E<br />
Throughput<br />
1,871.81 tpsE<br />
Price/Performance<br />
$ 175.57 USD<br />
per tpsE<br />
Availability Date<br />
August 17,<br />
2012<br />
Total System Cost<br />
$ 328,623<br />
TPC-Energy Metric<br />
0.69 Watts/tpsE<br />
Database Server Configuration<br />
Operating System<br />
Microsoft Windows Server<br />
2008 R2 Enterprise Edition<br />
SP1<br />
Database Manager<br />
Microsoft SQL Server<br />
2012 Enterprise<br />
Edition<br />
Processors/Cores/Threads<br />
2/16/32<br />
Memory<br />
512 GB<br />
SUT<br />
Tier A<br />
PRIMERGY RX200 S7<br />
1x Intel Xeon E5-2660 2.20 GHz<br />
16 GB Memory<br />
1x 250 GB 7.2k rpm SATA Drive<br />
2x onboard LAN 1 Gb/s<br />
1x Dual Port LAN 1 Gb/s<br />
Tier B<br />
PRIMERGY RX300 S7<br />
2x Intel Xeon E5-2690 2.90 GHz<br />
512 GB Memory<br />
8x 146 GB 15k rpm SAS Drives<br />
2x onboard LAN 1 Gb/s<br />
5x SAS RAID Controller<br />
Storage<br />
1x PRIMECENTER Rack<br />
4x ETERNUS JX40<br />
60x 200 GB SSD Drives<br />
2x 1 TB 7.2k rpm SATA Drives<br />
Initial Database Size<br />
7,704 GB<br />
Redundancy Level 1<br />
RAID-5 data and RAID-10 log<br />
Storage<br />
60 x 200 GB SSD<br />
2 x 1 TB 7.2k rpm HDD<br />
6 x 146 GB 15k rpm HDD<br />
Fujitsu July 2012. TPC-E Full Disclosure Report -4-
PRIMERGY RX300 S7<br />
TPC-E 1.12.0<br />
TPC Pricing 1.7.0<br />
TPC-Energy 1.4.2<br />
Report Date<br />
July 5, 2012<br />
Availability Date<br />
August 17, 2012<br />
Description<br />
Part Number<br />
Price<br />
Source<br />
Unit Price<br />
Qty<br />
Extended<br />
Price<br />
3-yr. Maint.<br />
Price<br />
Database Server (Tier B) Hardw are<br />
PRIM ERGY RX300S7 1 65,198.00 1 65,198.00<br />
PY RX300S7 8x2.5" HDD bays S26361-K1373-V201 1 1<br />
Modular PSU 800W platinum hp S26113-F574-E10 1 1<br />
Pow er Supply Dummy S26113-F574-E99 1 1<br />
Cable pow ercord rack, 4m, grey T26139-Y1968-E100 1 1<br />
Intel Xeon E5-2690 8C/16T 2.90 GHz S26361-F3686-E290 1 2<br />
32GB(1x32GB) 4Rx4 L DDR3-1333 LR ECC S26361-F3698-E517 1 16<br />
Performance Mode Installation S26361-F3694-E2 1 2<br />
DVD-RW supermulti slimline SATA S26361-F3269-E2 1 1<br />
HD SAS 6G 146GB 15K HOT PL 2.5" EP S26361-F4482-E514 1 8<br />
RAID Ctrl SAS 6G 1GB (D3116) S26361-F3669-E1 1 1<br />
RAID Ctrl SAS 6G 8Port ex 1GB FH/LP LSI S26361-F3713-L501 1 4<br />
Rack-Mount Kit F1-C S7 LV S26361-F2735-E175 1 1<br />
Rack Cable Arm 2U S26361-F2735-E82 1 1<br />
Mounting in symmetrical Racks S26361-F4530-E10 1 1<br />
region kit APAC/America/EMEA/Indien S26361-F1452-E100 1 1<br />
PRIMERGY RX300S7 Installation, normal business hours PYR300-N038005-0NA 1 350.00 1 350.00<br />
PYRX300 Series Warranty Uplift, 36 Months, Enhanced Plus PYR300-U004361-0NA 1 931.00 1 931.00<br />
Level, 24x7 4hr Onsite, Prepaid billing (PYR300-U004361-0NA)<br />
Subtotal (*) 65,198.00 1,281.00<br />
Storage<br />
PRIM ECENTER RACK 1 2,400.00 1 2,400.00<br />
PRIMECENTER M1 Rack 724S 24U-1050x700 S26361-K827-V220 1<br />
Dummy panel, plastics, 1U + assembly S26361-F4530-L131 3<br />
Dummy panel, plastics, 2U + assembly S26361-F4530-L132 6<br />
Socket strip 3phase 3x 8 sockets S26361-F2262-L31 1 210.00 1 210.00<br />
PYPRIMECENTER Warranty Uplift, 36 Months, Enhanced Plus PYPCTR-U004361-0NA 1 720.00 1 720.00<br />
Level, 24x7 4hr Onsite, Prepaid billing (PYPCTR-U004361-0NA)<br />
ETERNUS JX40 1 2,611.00 4 10,444.00<br />
ETERNUS JX40 FTS:ETJXS11BG 4<br />
PRIMERGY Rackinstallation SX/DX ex w orks D:FCSX-INPSR 4<br />
SSD SAS 6G 200 GB MLC NO HP 2.5" EP PERF S26361-F4581-L200 1 3,350.00 60 201,000.00<br />
SAS CABLE 1X SFF 8088-1X SFF 8088 2M D:KBSAS1S-1S-2M 1 70.00 4 280.00<br />
HD SATA 1000 GB 2.5" S26361-F3601-L100 1 510.00 2 1,020.00<br />
PYJX40 Warranty Uplift, 12 Months, Enhanced<br />
PYJX40-U004121-0NA 1 609.00 4 2,436.00<br />
Plus Level, 24x7x365 Phone Support (Sev1 -<br />
Live Transfer), 24x7x365 Onsite and Parts<br />
(Sev1 Resp. Time - 4 Hours), Incl. Holidays,<br />
Prepaid billing<br />
PYJX40 Post Warranty, 24 Months, Enhanced<br />
PYJX40-P004241-0NA 1 1,218.00 4 4,872.00<br />
Plus Level, 24x7x365 Phone Support (Sev1 -<br />
Live Transfer), 24x7x365 Onsite and Parts<br />
(Sev1 Resp. Time - 4 Hours), Incl. Holidays,<br />
Prepaid billing<br />
PYJX40 during normal business hours,<br />
PYJX40-N043005-0NA 1 450.00 4 1,800.00<br />
<strong>Primergy</strong> storage installation, One Time billing<br />
Subtotal(*) 215,354.00 9,828.00<br />
Fujitsu July 2012. TPC-E Full Disclosure Report -5-
PRIMERGY RX300 S7<br />
TPC-E 1.12.0<br />
TPC Pricing 1.7.0<br />
TPC-Energy 1.4.2<br />
Report Date<br />
July 5, 2012<br />
Availability Date<br />
August 17, 2012<br />
Database Server (Tier B) Softw are<br />
SQL Server 2012 Enterprise Edition 2Core License 7JQ-00256 2 13,472.50 8 107,780.00<br />
Window s Server 2008 R2 Enterprise Edition P72-04217 2 2,280.00 1 2,280.00<br />
Microsoft Problem Resolution Services n/a 2 259.00 1 259.00<br />
Subtotal 110,060.00 259.00<br />
Application Server (Tier A ) Hardw are<br />
<strong>Primergy</strong> RX200 S7 1 4,274.00 1 4,274.00<br />
PY RX200 S7, 4x2.5 S26361-K1386-V101 1 1<br />
Modulare SV 450W platin hp S26113-F575-E10 1 1<br />
Pow er Supply Dummy S26113-F574-E99 1 1<br />
Intel Xeon E5-2660 8C/16T 2.20 GHz 20MB S26361-F3691-E220 1 1<br />
4GB (1x4GB) 2Rx8 L DDR3-1600 U ECC S26361-F3694-E514 1 4<br />
Performance Mode Installation S26361-F3694-E2 1 1<br />
DVD-RW supermulti slimline SATA S26361-F3269-E2 1 1<br />
HD SATA 6G 250GB 7.2K HOT PL 2.5" BC S26361-F3708-E250 1 1<br />
Eth Ctrl 2x1Gbit PCIe x4 D2735-2 Cu lp S26361-F3610-E202 1 1<br />
Rack Mount Kit F1-C S7 LV S26361-F2735-E175 1 1<br />
Rack Cable Arm 1U S26361-F2735-E81 1 1<br />
Cable pow ercord rack, 4m, grey T26139-Y1968-E100 1 1<br />
Mounting in symmetrical Racks S26361-F4530-E10 1 1<br />
region kit APAC/America/EMEA/Indien S26361-F1452-E100 1 1<br />
PRIMERGY RX200S7 Installation, normal business hours PYR200-N038005-0NA 1 200.00 1 200.00<br />
PYRX200 Series Warranty Uplift, 36 Months, Enhanced Plus PYR200-U004361-0NA 1 750.00 1 750.00<br />
Level, 24x7 4hr Onsite, Prepaid billing (PYR300-U004361-0NA)<br />
Subtotal(*) 4,274.00 950.00<br />
Application Server (Tier A ) Softw are<br />
Window s Server 2008 R2 Standard x64 Edition P73-04165 2 711.00 1 711.00<br />
Subtotal 711.00<br />
Miscellaneous<br />
DISPLAY B20T-6 LED (incl 2spares) S26361-K1416-V140 1 187.20 3 561.60<br />
Infrastructure or Connectivity<br />
KB400 USB grey INT USA (incl 2 spares) S26381-K550-E102 1 14.00 3 42.00<br />
Mouse M480 grey (incl 2 spares) S26381-K431-E101 1 8.00 3 24.00<br />
LAN-CAT 5 Enhanced, l=3m T26139-Y2425-M3 1 5.00 2 10.00<br />
Subtotal(*) 637.60 0.00<br />
Total 396,234.60 12,318.00<br />
Dollar Volume Discount (see Notes) 28% 1 79,929.81<br />
316,304.79<br />
Notes:<br />
Price Source: 1=Fujitsu, 2=Microsoft Corporation<br />
Discount applies to all subtotal marked w ith(*) .<br />
Pricing is for these or similar quantities.Discounts for similary sized configurations w ill be similar to<br />
w hat is quoted here, but may vary based on the specific components priced.<br />
The benchmark results and test methodology w ere audited by Francois Raab for InfoSizing Inc. (w w w .sizing.com)<br />
Three-Year Cost of Ow nership USD $328,623<br />
TPC-E Throughput 1,871.81<br />
$ USD/tpsE $175.57<br />
Prices used in TPC benchmarks reflect the actual prices a customer w ould pay for a one-time purchase of the stated components. Individually negotiated discounts are<br />
not permitted. Special prices based on assumptions about past or future purchases are not permitted. All discounts reflect standard pricing policies for the listed<br />
components. For complete details, see the pricing section of the TPC benchmark pricing specifications. If you find that the stated prices are not available according to<br />
these terms, please inform the TPC at pricing@tpc.org. Thank you.<br />
Fujitsu July 2012. TPC-E Full Disclosure Report -6-
PRIMERGY RX300 S7<br />
TPC-E 1.12.0<br />
TPC Pricing 1.7.0<br />
TPC-Energy 1.4.2<br />
Report Date<br />
July 5, 2012<br />
Availability Date<br />
August 17, 2012<br />
Numerical Quantities Summary<br />
Reported Throughput: 1,871.81 tpsE Configured Customers:<br />
940,000<br />
Response Times (in seconds) Minimum Average 90th%tile Maximum<br />
Broker Volume 0.00 0.01 0.03 0.39<br />
Customer Position 0.00 0.01 0.02 0.97<br />
Market Feed 0.00 0.01 0.02 1.01<br />
Market Watch 0.00 0.01 0.02 1.00<br />
Security Detail 0.00 0.01 0.01 0.61<br />
Trade Lookup 0.00 0.07 0.11 1.22<br />
Trade Order 0.00 0.03 0.05 0.96<br />
Trade Result 0.00 0.03 0.05 0.98<br />
Trade Status 0.00 0.01 0.02 0.93<br />
Trade Update 0.01 0.08 0.12 1.22<br />
Data Maintenance<br />
Transaction Mix<br />
Broker Volume<br />
Customer Position<br />
Market Feed<br />
Market Watch<br />
Security Detail<br />
Trade Lookup<br />
Trade Order<br />
Trade Result<br />
Trade Status<br />
Trade Update<br />
Data Maintenance<br />
0.00 0.02<br />
Transaction Count<br />
N/A<br />
6,603,955<br />
17,520,233<br />
1,347,712<br />
24,258,833<br />
18,867,950<br />
10,781,456<br />
13,611,846<br />
13,477,103<br />
25,606,833<br />
2,695,416<br />
120<br />
0.05<br />
Mix %<br />
4.900%<br />
13.000%<br />
1.000%<br />
18.000%<br />
14.000%<br />
8.000%<br />
10.100%<br />
10.000%<br />
19.000%<br />
2.000%<br />
N/A<br />
Test Duration and Timings<br />
Ramp-up Time (hh:mm:ss)<br />
00:26:15<br />
Measurement Interval (hh:mm:ss)<br />
02:00:00<br />
Business Recovery Time (hh:mm:ss)<br />
00:13:29<br />
Total Number of Transactions Completed<br />
134,771,337<br />
Fujitsu July 2012. TPC-E Full Disclosure Report -7-
PRIMERGY<br />
RX300 S7<br />
TPC-E<br />
Throughput<br />
1,871.81 tpsE<br />
Price/Performance<br />
$ 175.57 USD<br />
per tpsE<br />
Energy Summary<br />
Availability Date<br />
August 17,<br />
2012<br />
Total System Cost<br />
$ 328,623<br />
TPC-E 1.12.0<br />
TPC Pricing 1.7.0<br />
TPC-Energy 1.4.2<br />
Report Date<br />
July 5, 2012<br />
Availability Date<br />
August 17, 2012<br />
TPC-Energy Metric<br />
0.69 Watts/tpsE<br />
Numerical Quantities For Reported Energy Configuration:<br />
REC Idle Power:<br />
Average Power of REC :<br />
843.88 Watts<br />
1,288.82 Watts<br />
Subsystem Reporting:<br />
Database Server *)<br />
Storage *)<br />
Application Server *)<br />
Miscellaneous *)<br />
Total REC<br />
Secondary Metrics<br />
Additional Numerical Quantities<br />
Full Load Full Load Idle<br />
Idle<br />
watts/tpsE Avg Watts % of REC Avg Watts % of REC<br />
0.32 592.41 45.97% 239.56 28.39%<br />
0.31 578.42 44.88% 544.80 64.56%<br />
0.05 100.99 7.84% 59.12 7.01%<br />
0.01 17.00 1.32% 0.40 0.05%<br />
0.69 1,288.82 100.00% 843.88 100.00%<br />
*) see pricing for list of components<br />
Lowest ambient temperature at air inlet:<br />
20.13 Degrees Celsius<br />
Items in Priced Configuration not in the Reported Energy Configuration<br />
None<br />
Items in the Reported Energy Configuration not in the Measured Energy Configuration<br />
Fujitsu Display B20T-6 LED<br />
Fujitsu July 2012. TPC-E Full Disclosure Report -8-
Table of Contents<br />
ABSTRACT ................................................................................................................................................................... 3<br />
CLAUSE 0: PREAMBLE ............................................................................................................................................. 11<br />
Introduction ........................................................................................................................................................... 11<br />
Goal of the TPC-E Benchmark ............................................................................................................................. 11<br />
Restrictions and Limitations .................................................................................................................................. 12<br />
CLAUSE 1: OVERVIEW .............................................................................................................................................. 13<br />
Order and Titles .................................................................................................................................................... 13<br />
Executive Summary Statement ............................................................................................................................ 13<br />
Benchmark Sponsor ............................................................................................................................................. 13<br />
Configuration Diagram .......................................................................................................................................... 14<br />
Hardware Configuration ........................................................................................................................................ 15<br />
Software Configuration ......................................................................................................................................... 16<br />
CLAUSE 2: DATABASE DESIGN, SCALING AND POPULATION .......................................................................... 17<br />
Database Creation ................................................................................................................................................ 17<br />
Partitioning ............................................................................................................................................................ 17<br />
Replication and Duplicated Attributes................................................................................................................... 17<br />
Cardinality of Tables ............................................................................................................................................. 18<br />
Distribution of Tables, Partitions and Logs ........................................................................................................... 19<br />
Database Interface, Data Model and Load Methodology ..................................................................................... 20<br />
CLAUSE 3: TRANSACTIONS .................................................................................................................................... 21<br />
Vendor-Supplied Code ......................................................................................................................................... 21<br />
Database Footprint Requirements ........................................................................................................................ 21<br />
CLAUSE 4: SUT, DRIVER AND NETWORK .............................................................................................................. 22<br />
Network Configuration .......................................................................................................................................... 22<br />
CLAUSE 5: EGEN ....................................................................................................................................................... 23<br />
EGen Version ....................................................................................................................................................... 23<br />
EGen Code ........................................................................................................................................................... 23<br />
EGen Modifications............................................................................................................................................... 23<br />
CLAUSE 6: PERFORMANCE METRICS AND RESPONSE TIME ............................................................................ 24<br />
EGen Driver .......................................................................................................................................................... 24<br />
Measured Throughput .......................................................................................................................................... 24<br />
Test Run Graph .................................................................................................................................................... 24<br />
Steady State ......................................................................................................................................................... 25<br />
Work Performed During Steady State .................................................................................................................. 25<br />
Transaction Input Parameter Averages ................................................................................................................ 26<br />
CLAUSE 7: TRANSACTION AND SYSTEM PROPERTIES ...................................................................................... 27<br />
ACID Tests ........................................................................................................................................................... 27<br />
Redundancy Level and Data Accessibility............................................................................................................ 27<br />
Business Recovery ............................................................................................................................................... 28<br />
CLAUSE 8: PRICING RELATED ITEMS .................................................................................................................... 30<br />
60-Day Space ....................................................................................................................................................... 30<br />
Attestation Letter ................................................................................................................................................... 31<br />
CLAUSE 9: SUPPORTING FILES .............................................................................................................................. 33<br />
Fujitsu July 2012. TPC-E Full Disclosure Report -9-
Supporting Files Index table ................................................................................................................................. 33<br />
APPENDIX: THIRD PARTY PRICE QUOTATIONS ................................................................................................... 38<br />
APPENDIX B: TPC-ENERGY DISCLOSURE REPORT ............................................................................................ 39<br />
TPC-Energy Clause 2-related items (Methodology) ............................................................................................. 39<br />
TPC-Energy Clause 3-related items (Metrics) ...................................................................................................... 39<br />
TPC-Energy Clause 4-related items (Drivers/Controller) ..................................................................................... 42<br />
TPC-Energy Clause 6-related items (Instrumentation) ........................................................................................ 42<br />
TPC-Energy Clause 8-related items ..................................................................................................................... 43<br />
Fujitsu July 2012. TPC-E Full Disclosure Report -10-
Clause 0: Preamble<br />
Introduction<br />
TPC Benchmark E (TPC-E) is an On-Line Transaction Processing (OLTP) workload. It is a mixture of read-only<br />
and update intensive transactions that simulate the activities found in complex OLTP application environments.<br />
The database schema, data population, transactions, and implementation rules have been designed to be broadly<br />
representative of modern OLTP systems. The benchmark exercises a breadth of system components associated<br />
with such environments, which are characterized by:<br />
The simultaneous execution of multiple transaction types that span a breadth of complexity; Moderate<br />
system and application execution time;<br />
A balanced mixture of disk input/output and processor usage; Transaction integrity (ACID properties);<br />
A mixture of uniform and non-uniform data access through primary and secondary keys;<br />
Databases consisting of many tables with a wide variety of sizes, attributes, and relationships with<br />
realistic content;<br />
Contention on data access and update.<br />
The TPC-E operations are modelled as follows: The database is continuously available 24 hours a day, 7 days a<br />
week, for data processing from multiple Sessions and data modifications against all tables, except possibly during<br />
infrequent (e.g., once a month) maintenance Sessions. Due to the worldwide nature of the application modelled<br />
by the TPC-E benchmark, any of the transactions may be executed against the database at anytime, especially in<br />
relation to each other.<br />
Goal of the TPC-E Benchmark<br />
The TPC-E benchmark simulates the OLTP workload of a brokerage firm. The focus of the benchmark is the<br />
central database that executes transactions related to the firm’s customer accounts. In keeping with the goal of<br />
measuring the performance characteristics of the database system, the benchmark does not attempt to measure<br />
the complex flow of data between multiple application systems that would exist in a real environment.<br />
The mixture and variety of transactions being executed on the benchmark system is designed to capture the<br />
characteristic components of a complex system. Different transaction types are defined to simulate the<br />
interactions of the firm with its customers as well as its business partners. Different transaction types have varying<br />
run-time requirements.<br />
The benchmark defines:<br />
Two types of transactions to simulate Consumer-to-Business as well as Business-to-Business activities<br />
Several transactions for each transaction type<br />
Different execution profiles for each transaction type<br />
A specific run-time mix for all defined transactions<br />
For example, the database will simultaneously execute transactions generated by systems that interact with<br />
customers along with transactions that are generated by systems that interact with financial markets as well as<br />
administrative systems. The benchmark system will interact with a set of driver systems that simulate the various<br />
sources of transactions without requiring the benchmark to implement the complex environment.<br />
The Performance Metric reported by TPC-E is a "business throughput” measure of the number of completed<br />
Trade-Result transactions processed per second (see Clause 6.7.1). Multiple Transactions are used to simulate<br />
the business activity of processing a trade, and each Transaction is subject to a Response Time constraint. The<br />
Performance Metric for the benchmark is expressed in transactions-per-second-E (tpsE). To be compliant with the<br />
TPC-E standard, all references to tpsE Results must include the tpsE rate, the associated price-per-tpsE, and the<br />
Availability Date of the Priced Configuration (See Clause 6.7.3 for more detail).<br />
Although this specification defines the implementation in terms of a relational data model, the database may be<br />
implemented using any commercially available Database Management System (DBMS), Database Server, file<br />
system, or other data repository that provides a functionally equivalent implementation. The terms "table", "row",<br />
and "column" are used in this document only as examples of logical data structures.<br />
Fujitsu July 2012. TPC-E Full Disclosure Report -11-
TPC-E uses terminology and metrics that are similar to other benchmarks, originated by the TPC and others.<br />
Such similarity in terminology does not imply that TPC-E Results are comparable to other benchmarks. The only<br />
benchmark Results comparable to TPC-E are other TPC-E Results that conform to a comparable version of the<br />
TPC-E specification.<br />
Restrictions and Limitations<br />
Despite the fact that this benchmark offers a rich environment that represents many OLTP applications, this<br />
benchmark does not reflect the entire range of OLTP requirements. In addition, the extent to which a customer<br />
can achieve the Results reported by a vendor is highly dependent on how closely TPC-E approximates the<br />
customer application. The relative performance of systems derived from this benchmark does not necessarily hold<br />
for other workloads or environments. Extrapolations to any other environment are not recommended.<br />
Benchmark Results are highly dependent upon workload, specific application requirements, and systems design<br />
and implementation. Relative system performance will vary because of these and other factors. Therefore, TPC-E<br />
should not be used as a substitute for specific customer application benchmarking when critical capacity planning<br />
and/or product evaluation decisions are contemplated.<br />
Benchmark Sponsors are permitted various possible implementation designs, insofar as they adhere to the model<br />
described and pictorially illustrated in this specification. A Full Disclosure Report (FDR) of the implementation<br />
details, as specified in Clause 9.1, must be made available along with the reported Results.<br />
Fujitsu July 2012. TPC-E Full Disclosure Report -12-
Clause 1: Overview<br />
Order and Titles<br />
The order and titles of sections in the Report and Supporting Files must correspond with the order and titles of<br />
sections from the TPC-E Standard Specification (i.e., this document). The intent is to make it as easy as possible<br />
for readers to compare and contrast material in different Reports (9.1.1.1).<br />
The order and titles in this report correspond to those in the TPC-E specification.<br />
Executive Summary Statement<br />
The TPC Executive Summary Statement must be included near the beginning of the Report (9.2).<br />
The Executive summary has been included near the beginning of this FDR.<br />
Benchmark Sponsor<br />
A statement identifying the benchmark sponsor(s) and other participating companies must be provided (9.3.1.1).<br />
Fujitsu is the sponsor of this TPC Benchmark E result.<br />
Fujitsu July 2012. TPC-E Full Disclosure Report -13-
Configuration Diagram<br />
Diagrams of both measured and Priced Configurations must be reported in the Report, accompanied by a<br />
description of the differences (9.3.1.2).<br />
The measured and priced configurations are shown in the following figures. There are differences between both<br />
configurations at additional storage used for database setup and backup in the measured configuration. This<br />
storage is not used during measurement and not required for pricing.<br />
Figure 1-1: Priced Configuration<br />
Tier A<br />
PRIMERGY RX200 S7<br />
1x Intel Xeon E5-2660 2.20 GHz<br />
16 GB Memory<br />
1x 250 GB 7.2k rpm SATA Drive<br />
2x onboard LAN 1 Gb/s<br />
1x Dual Port LAN 1 Gb/s<br />
Tier B<br />
PRIMERGY RX300 S7<br />
2x Intel Xeon E5-2690 2.90 GHz<br />
512 GB Memory<br />
8x 146 GB 15k rpm SAS Drives<br />
2x onboard LAN 1 Gb/s<br />
5x SAS RAID Controller<br />
Storage<br />
1x PRIMECENTER Rack<br />
4x ETERNUS JX40<br />
60x 200 GB SSD Drives<br />
2x 1 TB 7.2k rpm SATA Drives<br />
Fujitsu July 2012. TPC-E Full Disclosure Report -14-
Figure 1-2: Measured Configuration<br />
Tier A<br />
PRIMERGY RX200 S7<br />
1x Intel Xeon E5-2660 2.20 GHz<br />
16 GB Memory<br />
1x 250 GB 7.2k rpm SATA Drive<br />
2x onboard LAN 1 Gb/s<br />
1x Dual Port LAN 1 Gb/s<br />
Tier B<br />
PRIMERGY RX300 S7<br />
2x Intel Xeon E5-2690 2.90 GHz<br />
512 GB Memory<br />
8x 146 GB 15k rpm SAS Drives<br />
2x onboard LAN 1 Gb/s<br />
5x SAS RAID Controller<br />
Storage<br />
1x PRIMECENTER Rack<br />
4x ETERNUS JX40<br />
60x 200 GB SSD Drives<br />
2x 1 TB 7.2k rpm SATA Drives<br />
14x FibreCat SX40<br />
120x 146 GB 15k rpm SAS Drives<br />
48x 73 GB 15k rpm SAS Drives<br />
Hardware Configuration<br />
A description of the steps taken to configure all the hardware must be reported in the Report (9.3.1.4).<br />
Driver<br />
The driver system is not part of the System Under Test (SUT) and priced configuration. This system was<br />
connected with Tier A system, using onboard LAN with 2 x 1 Gb/s Ethernet. There are two LAN segments for<br />
these connections.<br />
Tier A<br />
The Tier A server is a Fujitsu PRIMERGY RX200 S7 with one Intel Xeon E5-2660 Eight-Core Processor and 16<br />
GB of memory. One SATA 250 GB 7.2k rpm disk drive is connected to the onboard controller. One 1 Gb/s dual<br />
port Ethernet LAN card is plugged in the PCI-E slot. Each of the two ports is directly connected with one of the 1<br />
Gb/s Ethernet onboard LAN ports of Tier B using a LAN crossover cable. There are two LAN segments for these<br />
connections. The two onboard 1 Gb/s LAN ports are used for driver connection.<br />
Fujitsu July 2012. TPC-E Full Disclosure Report -15-
Tier B<br />
The Tier B or database server is a Fujitsu PRIMERGY RX300 S7 with two Intel Xeon E5-2690 Eight-Core<br />
Processors and 512 GB memory. All of the eight onboard 2.5” disk bays are used with 8x SAS 146 GB 15k rpm<br />
disk drives and RAID controller SAS 6G 1GB (D3116). Two drives are configured with RAID1 for OS and<br />
database. Six drives are configured with RAID10 for database log. Four RAID controllers SAS 6G 8Port ex 1GB<br />
are used to connect the external disk drives to the server. The controller cache of all 5 RAID controllers is<br />
configured with Write Through. The two onboard 1 Gb/s Ethernet LAN ports are connected to the Tier A system<br />
as described above.<br />
Storage<br />
4 Fujitsu ETERNUS JX40 are used, each with 15x 200GB SSD 2.5” RAID5. One of these Fujitsu ETERNUS JX40<br />
is used with additional 2x SATA 1TB 7.2k rpm HDD 2.5” RAID 1. The enclosures are connected to the controllers<br />
SAS 6G 8Port ex 1GB. For details see table 2-2 Disk Configuration. The disk configuration can be done with the<br />
ServerView RAID Manager, which is shipped on ServerStart DVD together with the Server.<br />
Software Configuration<br />
A description of the steps taken to configure all the software must be reported in the Report (9.3.1.5).<br />
The default installation of the operating system was executed on Tier A and B as well as the installation of the<br />
database SW on Tier B and the database client connectivity on Tier A. Information about changes to the software,<br />
settings and BenchCraft can be found in the SupportingFiles directory Introduction - Software.<br />
SQL Server 2012 has been updated with cumulative update package 1. For details and how to obtain the SW see<br />
http://support.microsoft.com/kb/2679368.<br />
Fujitsu July 2012. TPC-E Full Disclosure Report -16-
Clause 2: Database Design, Scaling and Population<br />
Database Creation<br />
A description of the steps taken to create the database for the Reported Throughput must be reported in the<br />
Report (9.3.2).<br />
The physical organization of tables and indices, within the database, must be reported in the Report. (9.3.2.1)<br />
The database has been created for 940,000 customers. The SQL Server scripts and setup command files are<br />
included in the SupportingFiles\Clause2 folder. Two file groups are used for the tables and indices. The<br />
distribution is shown in table 2-1.<br />
Partitioning<br />
While few restrictions are placed upon horizontal or vertical partitioning of tables and rows in the TPC-E<br />
benchmark (see Clause 2.3.3), any such partitioning must be reported in the Report.(9.3.2.2)<br />
There is no partitioning implemented in this configuration.<br />
Replication and Duplicated Attributes<br />
Replication of tables, if used, must be reported in the Report (9.3.2.3).<br />
Additional and/or duplicated attributes in any table must be reported in the Report along with a statement on the<br />
impact on performance (9.3.2.4).<br />
There is no replication implemented in this configuration.<br />
No duplications or additional attributes were used.<br />
Fujitsu July 2012. TPC-E Full Disclosure Report -17-
Cardinality of Tables<br />
The cardinality (e.g. the number of rows) of each table, as it existed after database load (see Clause 2.6), must be<br />
reported in the Report (9.3.2.5).<br />
The database was configured for 940,000 customers. The cardinality of the tables after database load is as<br />
shown in the following table 2-1.<br />
Table 2-1: Table Cardinality and File Groups<br />
Table<br />
Cardinality after<br />
database load<br />
File<br />
Group<br />
ACCOUNT_PERMISSION 6673826 1<br />
ADDRESS 1410004 1<br />
BROKER 9400 1<br />
CASH_TRANSACTION 14943737411 2<br />
CHARGE 15 1<br />
COMMISSION_RATE 240 1<br />
COMPANY 470000 1<br />
COMPANY_COMPETITOR 1410000 1<br />
CUSTOMER 940000 1<br />
CUSTOMER_ACCOUNT 4700000 1<br />
CUSTOMER_TAXRATE 1880000 1<br />
DAILY_MARKET 840289500 1<br />
EXCHANGE 4 1<br />
FINANCIAL 9400000 1<br />
HOLDING 831690350 2<br />
HOLDING_HISTORY 21768468686 2<br />
HOLDING_SUMMARY 46752556 2<br />
INDUSTRY 102 1<br />
LAST_TRADE 643900 1<br />
NEWS_ITEM 940000 1<br />
NEWS_XREF 940000 1<br />
SECTOR 12 1<br />
SECURITY 643900 1<br />
SETTLEMENT 16243200000 2<br />
STATUS_TYPE 5 1<br />
TAXRATE 320 1<br />
TRADE 16243200000 2<br />
TRADE_HISTORY 38983684215 2<br />
TRADE_REQUEST 0 2<br />
TRADE_TYPE 5 1<br />
WATCH_ITEM 94014652 1<br />
WATCH_LIST 940000 1<br />
ZIP_CODE 14741 1<br />
Fujitsu July 2012. TPC-E Full Disclosure Report -18-
Distribution of Tables, Partitions and Logs<br />
The distribution of tables, partitions and logs across all media must be explicitly depicted for the measured and<br />
Priced Configurations (9.3.2.6).<br />
Table 2-2: Disk Configuration<br />
HBA - Port Disk Drives Partition Size Use<br />
Crtl 0 0 – onboard 2x146GB 15k rpm C:\<br />
SAS, RAID1<br />
136 GB OS, DB<br />
1 – onboard 6x146GB 15k rpm L:\<br />
SAS, RAID10<br />
409 GB DB Log<br />
Crtl 1 Port 0 2 – JX40 15x200GB SSD, RAID5 C:\jp\tpce011<br />
C:\jp\tpce012<br />
C:\jp\tpce021<br />
C:\jp\tpce022<br />
C:\jp\tpce031<br />
C:\jp\tpce032<br />
21.5 GB<br />
846.4GB<br />
21.5 GB<br />
846.4GB<br />
21.5 GB<br />
846.5GB<br />
Filegroup1<br />
Filegroup2<br />
Filegroup1<br />
Filegroup2<br />
Filegroup1<br />
Filegroup2<br />
Crtl 1 Port 1 3 – SX40 12x146GB, 15k rpm C:\jp\help01<br />
DB setup<br />
1498 GB<br />
SAS, RAID5<br />
Backup<br />
4 – SX40 12x146GB, 15k rpm C:\jp\help02<br />
DB setup<br />
1498 GB<br />
SAS, RAID5<br />
Backup<br />
5 – SX40 12x146GB, 15k rpm C:\jp\help03<br />
1498 GB<br />
DB setup<br />
SAS, RAID5<br />
Crtl 2 Port 0 6 – JX40 15x200GB SSD, RAID5 C:\jp\tpce041<br />
C:\jp\tpce042<br />
C:\jp\tpce051<br />
C:\jp\tpce052<br />
C:\jp\tpce061<br />
C:\jp\tpce062<br />
Crtl 2 Port 1 7 – SX40 12x146GB, 15k rpm<br />
SAS, RAID5<br />
C:\jp\help04<br />
8 – SX40 12x146GB, 15k rpm C:\jp\help05<br />
SAS, RAID5<br />
9 – SX40 24x73GB, 15k rpm C:\jp\help06<br />
SAS, RAID5<br />
Crtl 3 Port 0 10 – JX40 15x200GB SSD, RAID5 C:\jp\tpce071<br />
C:\jp\tpce072<br />
C:\jp\tpce081<br />
C:\jp\tpce082<br />
C:\jp\tpce091<br />
C:\jp\tpce092<br />
Crtl 3 Port 1 11 – SX40 12x146GB, 15k rpm<br />
SAS, RAID5<br />
12 – SX40 12x146GB, 15k rpm<br />
SAS, RAID5<br />
13 – SX40 12x146GB, 15k rpm<br />
SAS, RAID5<br />
Crtl 4 Port 0 14 – JX40 15x200GB SSD, RAID5<br />
18 – SX40 2x1TB 7.2k rpm SATA,<br />
RAID1<br />
Crtl 4 Port 1 15 – SX40 12x146GB, 15k rpm<br />
SAS, RAID5<br />
16 – SX40 12x146GB, 15k rpm<br />
SAS, RAID5<br />
17 – SX40 24x73GB, 15k rpm<br />
SAS, RAID5<br />
C:\jp\help07<br />
C:\jp\help08<br />
C:\jp\help09<br />
C:\jp\tpce101<br />
C:\jp\tpce102<br />
C:\jp\tpce111<br />
C:\jp\tpce112<br />
C:\jp\tpce121<br />
C:\jp\tpce122<br />
C:\jp\addon<br />
C:\jp\help10<br />
C:\jp\help11<br />
C:\jp\help12<br />
21.5 GB<br />
846.4GB<br />
21.5 GB<br />
846.4GB<br />
21.5 GB<br />
846.5GB<br />
1498 GB<br />
1498 GB<br />
1560 GB<br />
21.5 GB<br />
846.4GB<br />
21.5 GB<br />
846.4GB<br />
21.5 GB<br />
846.5GB<br />
1498 GB<br />
1498 GB<br />
1498 GB<br />
21.5 GB<br />
846.4GB<br />
21.5 GB<br />
846.4GB<br />
21.5 GB<br />
846.5GB<br />
931.0GB<br />
1498 GB<br />
1498 GB<br />
1560 GB<br />
Backup<br />
Filegroup1<br />
Filegroup2<br />
Filegroup1<br />
Filegroup2<br />
Filegroup1<br />
Filegroup2<br />
DB setup<br />
Backup<br />
DB setup<br />
Backup<br />
DB setup<br />
Backup<br />
Filegroup1<br />
Filegroup2<br />
Filegroup1<br />
Filegroup2<br />
Filegroup1<br />
Filegroup2<br />
DB setup<br />
Backup<br />
DB setup<br />
Backup<br />
DB setup<br />
Backup<br />
Filegroup1<br />
Filegroup2<br />
Filegroup1<br />
Filegroup2<br />
Filegroup1<br />
Filegroup2<br />
DB addon<br />
DB setup<br />
Backup<br />
DB setup<br />
Backup<br />
DB setup<br />
Backup<br />
Fujitsu July 2012. TPC-E Full Disclosure Report -19-
Database Interface, Data Model and Load Methodology<br />
A statement must be provided in the Report that describes:<br />
The Database Interface (e.g., embedded, call level) and access language (e.g., SQL, COBOL read/write) used to<br />
implement the TPC-E Transactions. If more than one interface / access language is used to implement TPC-E,<br />
each interface / access language must be described and a list of which interface /access language is used with<br />
which Transaction type must be reported.<br />
The data model implemented by the DBMS (e.g., relational, network, hierarchical) (9.3.2.7).<br />
The methodology used to load the database must be reported in the Report (9.3.2.8).<br />
Microsoft SQL Server 2012 Enterprise Edition is a relational database. The interface used was Microsoft SQL<br />
Server stored procedures accessed with Remote Procedure Calls embedded in C++ code using the Microsoft<br />
ODBC interface.<br />
The methodology used to load the database is described in Clause2 of the SupportingFiles directory.<br />
Fujitsu July 2012. TPC-E Full Disclosure Report -20-
Clause 3: Transactions<br />
Vendor-Supplied Code<br />
A statement that vendor-supplied code is functionally equivalent to Pseudo-code in the specification (see Clause<br />
3.2.1.6) must be reported in the Report (9.3.3.1).<br />
The vendor supplied code is functionally equivalent to the pseudo-code.<br />
Database Footprint Requirements<br />
A statement that the database footprint requirements (as described in Clause 3.3) were met must be reported in<br />
the Report (9.3.3.2).<br />
Database footprint requirements were met as described in the specification.<br />
Fujitsu July 2012. TPC-E Full Disclosure Report -21-
Clause 4: SUT, Driver and Network<br />
Network Configuration<br />
The Network configurations of both the measured and Priced Configurations must be described and reported in<br />
the Report. This includes the mandatory Network between the Driver and Tier A (see Clause 4.2.2) and any<br />
optional Database Server interface networks (9.3.4.2):<br />
Figures 1-1 and 1-2 show the configuration of the measured and priced configurations. Both are identical in case<br />
of the network configuration. Tier B system PRIMERGY RX300 S7 has an onboard Ethernet controller with two<br />
1Gb/s ports. Tier A system PRIMERGY RX200 S7 has an onboard Ethernet controller with two 1Gb/s ports used<br />
for driver system connection. Tier A system was extended with one dual-port 1Gb/s Ethernet controller card.<br />
These two ports were directly connected with the two onboard ports of Tier B using different LAN segments.<br />
Fujitsu July 2012. TPC-E Full Disclosure Report -22-
Clause 5: EGen<br />
EGen Version<br />
The version of EGen used in the benchmark must be reported (9.3.5.1).<br />
The EGen version used was 1.12.0.<br />
EGen Code<br />
A statement that all required TPC-provided EGen code was used in the benchmark must be reported (9.3.5.2).<br />
All the required TPC-provided code was used in the benchmark.<br />
EGen Modifications<br />
If the Test Sponsor modified EGen, a statement EGen has been modified must be reported in the Report. All<br />
formal waivers from the TPC documenting the allowed changes to EGen must also be reported in the Report (see<br />
Clause 5.3.7.1). If any of the changes to EGen do not have a formal waiver that must also be reported (9.3.5.3).<br />
If the Test Sponsor extended EGenLoader (as described in Appendix A.6), the use of the extended EGenLoader<br />
and<br />
the audit of the extension code by an Auditor must be reported (9.3.5.4).<br />
There were no modifications to the EGen. EGenLoader was not extended for this benchmark.<br />
Fujitsu July 2012. TPC-E Full Disclosure Report -23-
Clause 6: Performance Metrics and Response time<br />
EGen Driver<br />
The number of EGenDriverMEE and EGenDriverCE instances used in the benchmark must be reported in the<br />
Report (see Clause 6.2.5) (9.3.1.1).<br />
One Tier A system was used and configured to drive 16 EGenDriverMEE and 16 EGenDriverCE instances.<br />
Measured Throughput<br />
The Measured Throughput must be reported in the Report (see Clause 6.7.1.2) (9.3.6.2).<br />
The measured throughput was 1,871.81 tpsE.<br />
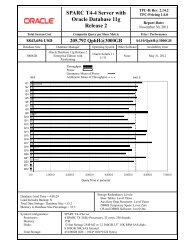
Test Run Graph<br />
A Test Run Graph of throughput versus elapsed wall clock time must be reported in the Report for the Trade-<br />
Result Transaction (see Clause 6.7.2) (9.3.6.3).<br />
Figure 6-1: Test Run Graph<br />
Start Steady State Start Measurement tpsE End Measurement End Steady State<br />
tpsE<br />
2000<br />
1800<br />
1600<br />
Begin Steady State<br />
Start Measurement<br />
End Steady State<br />
1400<br />
1200<br />
Measurement Interval<br />
1000<br />
End Measurement<br />
800<br />
600<br />
400<br />
200<br />
0<br />
0 30 60 90 120 150<br />
Elapsed Time (Minute)<br />
Fujitsu July 2012. TPC-E Full Disclosure Report -24-
Steady State<br />
The method used to determine that the SUT had reached a Steady State prior to commencing the Measurement<br />
Interval must be reported in the Report (9.3.6.4).<br />
During the run the tpsE throughput was observed to determine steady state. After the run steady state was<br />
confirmed by:<br />
1. Looked at the Test Run Graph and verified that tpsE was steady prior to commencing the Measurement<br />
Interval.<br />
2. Calculated 60 minute average tpsE during the Steady State moving the time window 10 minutes each<br />
time. Then confirmed that the minimum 60 minute average tpsE was not less than 98% of the Reported<br />
Throughput, and that the maximum 60 minute average tpsE was not greater than 102% of the Reported<br />
Throughput.<br />
3. Calculated 10 minute average tpsE during the Steady State moving the window 1 minute each time. Then<br />
confirmed that the minimum 10 minute average tpsE was not less than 80% of the Reported Throughput,<br />
and that the maximum 10 minute average tpsE was not greater than 120% of the Reported Throughput.<br />
4. Two completed full checkpoints.<br />
Work Performed During Steady State<br />
A description of how the work normally performed during a Test Run, actually occurred during the Measurement<br />
Interval must be reported in the Report (for example checkpointing, writing Undo/Redo Log records, etc.) (9.3.6.5).<br />
The Microsoft SQL Server recovery interval parameter was set to the maximum allowable value to perform<br />
checkpoint at specific intervals. Checkpoints were automatically issued at specified intervals (448 seconds) and<br />
specified duration (435 seconds). SQL Server was started with trace flag 3502, which caused it to log the<br />
occurrence of the checkpoints. This information was used to verify that the checkpoints occurred at the<br />
appropriate times and duration during steady state.<br />
Fujitsu July 2012. TPC-E Full Disclosure Report -25-
Transaction Input Parameter Averages<br />
The recorded averages over the Measurement Interval for each of the Transaction input parameters specified by<br />
clause 6.4.1 must be reported (9.3.6.6).<br />
Table 6-2: Transaction Input Parameter Averages.<br />
Transaction Parameter Range Min Range Max Value Check<br />
Customer<br />
Position<br />
By Tax ID 48.00% 52.00% 50.03% Ok<br />
Get History 48.00% 52.00% 50.00% Ok<br />
Overall<br />
Ok<br />
Market Watch By Watch List 57.00% 63.00% 60.01% Ok<br />
By Customer Account 33.00% 37.00% 34.99% Ok<br />
By Industry 4.50% 5.50% 5.01% Ok<br />
Overall<br />
Ok<br />
Security Detail Access LOB 0.90% 1.10% 1.00% Ok<br />
Overall<br />
Ok<br />
Trade Lookup Frame 1 28.50% 31.50% 29.99% Ok<br />
Frame 2 28.50% 31.50% 30.01% Ok<br />
Frame 3 28.50% 31.50% 30.00% Ok<br />
Frame 4 9.50% 10.50% 10.00% Ok<br />
Overall<br />
Ok<br />
Trade Update Frame 1 31.00% 35.00% 32.98% Ok<br />
Frame 2 31.00% 35.00% 33.00% Ok<br />
Frame 3 32.00% 36.00% 34.02% Ok<br />
Overall<br />
Ok<br />
Trade Order By Non-Owner 9.50% 10.50% 9.99% Ok<br />
By Company Name 38.00% 42.00% 39.99% Ok<br />
Buy On Margin 7.50% 8.50% 8.01% Ok<br />
Rollback 0.94% 1.04% 0.99% Ok<br />
LIFO 33.00% 37.00% 34.97% Ok<br />
Trade Qty 100 24.00% 26.00% 25.01% Ok<br />
Trade Qty 200 24.00% 26.00% 24.99% Ok<br />
Trade Qty 400 24.00% 26.00% 25.00% Ok<br />
Trade Qty 800 24.00% 26.00% 25.01% Ok<br />
Market Buy 29.70% 30.30% 30.00% Ok<br />
Market Sell 29.70% 30.30% 30.02% Ok<br />
Limit Buy 19.80% 20.20% 20.00% Ok<br />
Limit Sell 9.90% 10.10% 9.99% Ok<br />
Stop Loss 9.90% 10.10% 9.98% Ok<br />
Overall<br />
Ok<br />
Fujitsu July 2012. TPC-E Full Disclosure Report -26-
Clause 7: Transaction and System Properties<br />
ACID Tests<br />
The results of the ACID tests must be reported in the Report along with a description of how the ACID<br />
requirements were met, and how the ACID tests were run (9.3.7.1).<br />
The TPC Benchmark E Standard Specification defines a set of transaction processing system properties that a<br />
system under test (SUT) must support during the execution of the benchmark. Those properties are Atomicity,<br />
Consistency, Isolation and Durability (ACID). This section quotes the specification definition of each of those<br />
properties and describes the tests done as specified and monitored by the auditor, to demonstrate compliance.<br />
See also file MSTPCE ACID Procedures.pdf in the SupportingFiles directory.<br />
Redundancy Level and Data Accessibility<br />
The Test Sponsor must report in the Report the Redundancy Level (see Clause 7.5.7.1) and describe the Data<br />
Accessibility test(s) used to demonstrate compliance (9.3.7.2).<br />
A Data Accessibility Graph for each run demonstrating a Redundancy Level must be reported in the Report (see<br />
Clause 7.5.7.2) (9.3.7.3).<br />
Redundancy Level 1 was used for the storage system. To prove Redundancy Level 1, the following steps were<br />
successfully performed on a database data and log disk. The test for Redundancy Level 1 is the test for<br />
Permanent Irrecoverable Failure of any single Durable Medium. The different steps and the various states of the<br />
two disks are reported by ServerView RAID and written to the system event (see SupportingFiles).<br />
1. Determine the current number of completed trades in the database by counting the rows in<br />
SETTLEMENT.<br />
2. Start submitting Transactions and ramp up to the Durability Throughput Requirements (as defined in<br />
Clause 7.5.3) and satisfy those requirements for at least 5 minutes.<br />
3. Induce the failure described for the redundancy level being demonstrated. In this case fail a disk in a<br />
database data array. Since RAID5 is used, the transactions continue for at least 5 minutes.<br />
4. Induce the failure described for the redundancy level being demonstrated. In this case fail a disk in the<br />
database log array. Since RAID10 is used, the transactions continue for at least 5 minutes.<br />
5. Begin the necessary recovery process, by replacing the failed drives in the database data array and start<br />
the rebuild process.<br />
6. Begin the necessary recovery process, by replacing the failed drives in the database log array and start<br />
the rebuild.<br />
7. Continue running the Driver for at least 20 minutes with throughput above 95% of reported throughput.<br />
8. Terminate the run gracefully from the Driver.<br />
9. Wait until rebuild process has finished.<br />
10. Determine the current number of completed trades in the database by counting the rows in<br />
SETTLEMENT.<br />
11. Run the evaluation of Trade-Result Transactions executed and compare it with the difference of the<br />
SETTLEMENT rows counted.<br />
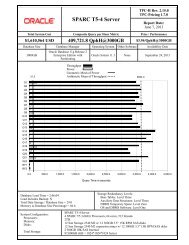
The Graph in Figure 7-1 show the measured throughput versus time and the different test stated.<br />
Fujitsu July 2012. TPC-E Full Disclosure Report -27-
Figure 7-1: Redundancy Level and Data Accessibility Graph<br />
2000<br />
Data Access Time Graph<br />
tpsE<br />
1750<br />
1500<br />
1250<br />
1000<br />
750<br />
tpsE<br />
Fail Data Disk<br />
Fail Log Disk<br />
Replace Data Disk<br />
Replace Log Disk<br />
Data Disk Rebuilt<br />
Log Disk Rebuilt<br />
95% of reported throughput<br />
500<br />
250<br />
0<br />
0:00 0:20 0:40 1:00 1:20 1:40 2:00 2:20 2:40<br />
Test Time in hh:mm<br />
Business Recovery<br />
The Test Sponsor must describe in the Report the test(s) used to demonstrate Business Recovery (9.3.4.7).<br />
The Business Recovery Time must be reported on the Executive Summary Statement and in the Report. If the<br />
failures described in Clauses 7.5.2.2, 7.5.2.3 and 7.5.2.4 were not combined into one Durability test (usually<br />
powering off the Database Server during the run), then the Business Recovery Time for the failure described for<br />
instantaneous interruption is the Business Recovery Time that must be reported in the Executive Summary<br />
Statement. All the Business Recovery Times for each test requiring Business Recovery must be reported in the<br />
Report (9.3.7.6).<br />
9.3.7.6 The Business Recovery Time Graph (see Clause 7.5.7.4) must be reported in the Report for all Business<br />
Recovery tests (9.3.7.7).<br />
The tests for “Instantaneous interrupt,” “Failure of all or part of memory,” and “Loss of external power to the SUT”<br />
were combined by power off Tier A and B.<br />
1. Determine the current number of completed trades in the database by counting the rows in<br />
SETTLEMENT.<br />
2. Start submitting transactions and ramp up to the Durability Throughput Requirements (as defined in<br />
Clause 7.5.3) and satisfy those requirements for at least 20 minutes.<br />
3. Induce the failures by power off Tier B.<br />
4. On the driver side the number of MEE connections is captured and after transaction failures is noted by<br />
the drivers, terminate the run and collect the data for Pre-Failure Run.<br />
5. Re-power and restart Tier B.<br />
6. When restarting the database on Tier B, it automatically starts the recovery and records timestamps. The<br />
Database Recovery Time was 00:03:41 (hh:mm.ss).<br />
Fujitsu July 2012. TPC-E Full Disclosure Report -28-
7. After recovery has completed Trade-Cleanup has been executed. A new run started again submitting<br />
transactions and ramp up to the Durability Throughput Requirements (as defined in Clause 7.5.3) and<br />
satisfy those requirements for at least 20 minutes. The Application Recovery Time was 00:09:48<br />
(hh:mm:ss).<br />
8. Terminate the run gracefully from the Driver and collect the data for Post-Failure Run.<br />
9. Verify that there are no errors in the Post-Failure run and check the consistency of the database as<br />
specified in Clause 7.3.1.1.<br />
10. Determine the current number of completed trades in the database by counting the rows in<br />
SETTLEMENT.<br />
11. Run the evaluation of Trade-Result Transactions executed in both runs and compare it with the difference<br />
of the SETTLEMENT rows counted. The difference must be less than or equal to the maximum number of<br />
Transactions which can be simultaneously in-flight from the Driver to the SUT.<br />
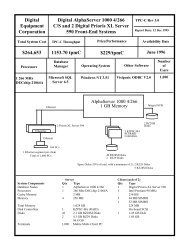
The Business Recovery Time (per Clause 7.5.7 Step15) was 00:13:29 (hh:mm:ss).<br />
The Graph in Figure 7-2 shows the measured throughput versus time and the Business Recovery.<br />
Figure 7-2: Business Recovery Graph<br />
tpsE<br />
2000<br />
Business Recovery Time Graph<br />
1750<br />
1500<br />
1250<br />
1000<br />
750<br />
Pre-Failure Run<br />
Post-Failure Run<br />
95% of Reported Throughput<br />
End Database Recovery<br />
Start Application Recovery<br />
End Application Recovery<br />
End 20 Min Sustainable<br />
500<br />
250<br />
0<br />
0:00 0:20 0:40 1:00<br />
Test Time hh:mm<br />
Fujitsu July 2012. TPC-E Full Disclosure Report -29-
Clause 8: Pricing Related Items<br />
60-Day Space<br />
Details of the 60-Day Space computations along with proof that the database is configured to sustain a Business<br />
Day of growth must be reported (9.3.8.1).<br />
Table 8-1: Space Requirements<br />
TPC-E Disk Space Requirements<br />
Customers Used 940,000<br />
Performance 1,871.81 TpsE settlements after 8 hours (Busines Day) 53,908,128<br />
initinal size grow size<br />
Table Initial Rows Data (KB) Index size (KB) Extra 5% (KB) Total + 5% (KB) After run (KB) Growth (KB)<br />
ACCOUNT_PERMISSION 6673826 367472 2344 18491 388307 369888 72<br />
ADDRESS 1410004 81336 624 4098 86058 81984 24<br />
BROKER 9400 688 936 81 1705 1624 0<br />
CASH_TRANSACTION 14944061103 1542170856 3255472 77271316 1622697644 1548633584 3207256<br />
CHARGE 15 8 8 1 17 16 0<br />
COMMISSION_RATE 240 16 16 2 34 32 0<br />
COMPANY 470000 99912 30472 6519 136903 130392 8<br />
COMPANY_COMPETITOR 1410000 37824 34784 3630 76238 72608 0<br />
CUSTOMER 940000 154040 46312 10018 210370 200384 32<br />
CUSTOMER_ACCOUNT 4700000 425904 105064 530968 0<br />
CUSTOMER_TAXRATE 1880000 39208 624 1992 41824 39944 112<br />
DAILY_MARKET 840289500 39235224 114136 1967468 41316828 39350544 1184<br />
EXCHANGE 4 8 8 1 17 16 0<br />
FINANCIAL 9400000 1059264 3376 53132 1115772 1062888 248<br />
HOLDING 831699467 55454864 37835384 4664512 97954760 94382680 1092432<br />
HOLDING_HISTORY 21768942726 791597560 528842832 66022020 1386462412 1324131688 3691296<br />
HOLDING_SUMMARY 46752539 2037552 7968 102276 2147796 2045520 0<br />
INDUSTRY 102 8 24 2 34 32 0<br />
LAST_TRADE 643900 39984 624 2030 42638 40608 0<br />
NEWS_ITEM 940000 101913232 1608 101914944 104<br />
NEWS_XREF 940000 23424 624 1202 25250 24048 0<br />
SECTOR 12 8 24 2 34 32 0<br />
SECURITY 643900 88648 25160 5690 119498 113816 8<br />
SETTLEMENT 16243551789 774577248 1633496 38810537 815021281 778004520 1793776<br />
STATUS_TYPE 5 8 8 1 17 16 0<br />
TAXRATE 320 24 16 2 42 56 16<br />
TRADE 16243616122 1937887832 1080820088 150935396 3169643316 3024447416 5739496<br />
TRADE_HISTORY 38984682856 1172514192 3058232 58778621 1234351045 1178777176 3204752<br />
TRADE_REQUEST 0 0 0 0 0 285112 285112<br />
TRADE_TYPE 5 8 1032 52 1092 1040 0<br />
WATCH_ITEM 94014652 2620504 9904 131520 2761928 2630624 216<br />
WATCH_LIST 940000 23408 21816 2261 47485 45224 0<br />
ZIP_CODE 14741 488 96 29 613 584 0<br />
Initial Database Size Settlements 18,414,845<br />
7,888,969 (MB) Grown Database Size<br />
7,704 (GB) 7,907,539 (MB)<br />
DB filegroups partition size (MB) file size (MB) alloc total (MB) loaded (MB) loaded +5% (MB) after run (MB) Business Day (MB)<br />
4 2,663,360 10,602,000 10,653,440 7,888,969 8,283,417 7,907,539 7,943,332<br />
Number of disks 60<br />
Disk Capacity (MB) 190,240<br />
RAID5 Overhead 7%<br />
Initial Grow ing Space (MB) 7,745,795 Total Space (MB) 10,653,440<br />
Final Grow ing Space (MB) 7,764,363 Number of disks 2 Initial Log Size (MB) 25,259 Log units 1<br />
Delta (MB) 18,568 Disk Capacity (MB) 953,344 Final Log Size (MB) 145,835 Disks per unit 6<br />
Data Space per Trade (MB) 0.001008 RAID1 Overhead 50% Log Grow th (MB) 120,576 Disk Capacity (MB) 139,488<br />
1 Day Data Grow th (MB) 54,358 Total Space (MB) 953,344 Log Space per Trade (MB) 0.006548 RAID10 Overhead 50.0%<br />
60 Day Space (MB) 11,150,441 Total Space (MB) 11,606,784 1 Day Log Space (MB) 352,976 Log Space (MB) 418,464<br />
Fujitsu July 2012. TPC-E Full Disclosure Report -30-
Attestation Letter<br />
The Auditor’s Attestation Letter, which indicates compliance, must be included in the Report (9.3.8.2).<br />
Fujitsu July 2012. TPC-E Full Disclosure Report -31-
Fujitsu July 2012. TPC-E Full Disclosure Report -32-
Clause 9: Supporting Files<br />
Supporting Files Index table<br />
An index for all files required by Clause 9.4 Supporting Files must be provided in the Report. The Supporting Files<br />
index is presented in a tabular format where the columns specify the following:<br />
• The first column denotes the clause in the TPC Specification<br />
• The second column provides a short description of the file contents<br />
• The third column contains the path name for the file starting at the SupportingFiles directory.<br />
If there are no Supporting Files provided then the description column must indicate that there is no supporting file<br />
and the path name column must be left blank (9.3.9.1).<br />
Clause Description Path Filename<br />
overview SupportingFiles SupportingFiles.doc<br />
Introduction System<br />
Configuration<br />
SupportingFiles/Introduction/<br />
SysInfo_TierA.txt<br />
SysInfo_TierB.txt<br />
Disk<br />
Configuration<br />
SupportingFiles/Introduction/Hardware/ DiskConfiguration.doc<br />
flatfilelocations.txt<br />
makehelpdirff.cmd<br />
Readme.txt<br />
Parameter<br />
OS Tunables<br />
Database Setup<br />
Startup Scripts<br />
Tier A<br />
SupportingFiles/Introduction/Software/<br />
SupportingFiles/Introduction/Software/<br />
Fujitsu July 2012. TPC-E Full Disclosure Report -33-<br />
tempdb12.sql<br />
CountOperations.reg<br />
MemoryManagement.reg<br />
MSTPCE Database Setup Reference.doc<br />
SQL_IP.reg<br />
SQL_LargePages.req<br />
SQL_Nodes.reg<br />
SQL_Server_Configuration.ver<br />
TierA_SQL2012_client_connection_all.reg<br />
TierA_W32Time.reg<br />
start_all_RX300.cmd<br />
start_CE1_RX300S7.cmd<br />
…<br />
start_CE16_RX300S7.cmd<br />
start_MEE1_RX300S7.cmd<br />
…<br />
start_MEE16_RX300S2.cmd<br />
Startup Scripts SupportingFiles/Introduction/Software/ SqlstartSQL2012.cmd<br />
Tier B<br />
Clause 2 Create Database SupportingFiles/Clause2 Backup_Database.sql<br />
Check_tempdb.sql<br />
Checkpoint_TPCE_Database.SQL<br />
Count_Customers.sql<br />
Create_Database.sql<br />
Create_DM_Audit_Table.sql<br />
Create_TID_Ranges_Table.sql<br />
Create_Timer_Table.sql<br />
Create_TL_TU_Warnings_Table.sql<br />
Create_TPCE_VERSIONS_Table.sql<br />
Database_Options_1.sql<br />
Database_Options_2.sql<br />
Drop_and_Create_TPCE_INFO.sql<br />
End_Load_Timer.sql<br />
Get_Next_T_ID.sql<br />
Install_Load_Timer_Proc.sql<br />
Load_TPCE_Info.sql<br />
Output_TPCE_VERSIONS_Table.SQL<br />
Remove_Database.sql<br />
Restore_Database.sql<br />
SQL_Server_Configuration.sql<br />
tempdb12.sql<br />
TPCE_Setup.cmd<br />
Trade_Cleanup.cmd<br />
Trade_Cleanup.sql<br />
Version.sql<br />
Create Database<br />
output<br />
SupportingFiles/Clause2/DB_setup<br />
940000Customers_Load_Timer.log<br />
Backup_Database.log
Index Creation<br />
Scripts<br />
SupportingFiles/Clause2/DDL<br />
Fujitsu July 2012. TPC-E Full Disclosure Report -34-<br />
BrokerVolume.log<br />
Build_Steps1.log<br />
Build_Steps2.log<br />
BulkInsert_1.out<br />
…<br />
BulkInsert_32.out<br />
Check_Constraints_Fixed.log<br />
Check_Constraints_Growing.log<br />
Check_Constraints_Scaling.log<br />
Convert_NI_ITEM_Data.log<br />
Create_DB_Audit_Tables.log<br />
Create_DM_Audit_Tables.log<br />
Create_Indexes_Fixed_Tables.log<br />
Create_Indexes_Growing_Tables.log<br />
Create_Indexes_Scaling_Tables.log<br />
Create_TID_Ranges_Table.log<br />
Create_TL_TU_Warnings_Table.log<br />
Create_TPCE_VERSIONS_Table.log<br />
CreateDB.log<br />
CustomerPosition.log<br />
Database_Options_1.log<br />
Database_Options_2.log<br />
DataMaintenance.log<br />
DB_Check.log<br />
DB_FK_Constraints.log<br />
DB_Primary_Key_Check.log<br />
DB_RI_Check.log<br />
DB_Tables.log<br />
Drop_DB_Audit_Tables.log<br />
Drop_Fixed_Tables.log<br />
Drop_FK_Constraints.log<br />
Drop_Growing_Tables.log<br />
Drop_Scaling_Tables.log<br />
EGenLoaderFrom1To29000.log<br />
EGenLoaderFrom29001To59000.log<br />
….<br />
EGenLoaderFrom911001To940000.log<br />
ERRORLOG<br />
FK_Constraints.log<br />
Get_Next_T_ID.log<br />
Insert_Duplicates_Tests.log<br />
Load_Timer.log<br />
Load_Timer_Proc.log<br />
Load_TPCE_Info.log<br />
MarketFeed.log<br />
MarketWatch.log<br />
Referential_Integrity_Tests.log<br />
Remove_Addon_Files.sql<br />
RemoveDB.log<br />
SecurityDetail.log<br />
spfiles.ver<br />
spfiles_setup.ver<br />
splog.ver<br />
spused.ver<br />
spused_setup.ver<br />
SQL_Server_Configuration.log<br />
Tables_Fixed.log<br />
Tables_Growing.log<br />
Tables_Scaling.log<br />
TPCE_VERSIONS.log<br />
TradeLookup.log<br />
TradeOrder.log<br />
TradeResult.log<br />
TradeStatus.log<br />
TradeUpdate.log<br />
Version.log<br />
BulkInsert_.sql<br />
Convert_NI_ITEM_Data.SQL<br />
Create_Check_Constraints_Fixed.sql<br />
Create_Check_Constraints_Growing.sql<br />
Create_Check_Constraints_Scaling.sql<br />
Create_FK_Constraints.sql<br />
Create_Indexes_Fixed.sql<br />
Create_Indexes_Growing.sql<br />
Create_Indexes_Scaling.sql
Clause3<br />
Database Audit<br />
Scripts<br />
Database Space<br />
Scripts<br />
Transaction<br />
Frames<br />
SupportingFiles/Clause2/Audit_Scripts/<br />
Database<br />
SupportingFiles/Clause2/Audit_Scripts/<br />
Space<br />
SupportingFiles/Clause3<br />
Create_Tables_Fixed.sql<br />
Create_Tables_Growing.sql<br />
Create_Tables_Scaling.sql<br />
Create_Tables_Scaling_Flat.sql<br />
Create_TPCE_Types.sql<br />
Drop_FK_Constraints.sql<br />
Drop_Tables_Fixed.sql<br />
Drop_Tables_Growing.sql<br />
Drop_Tables_Scaling.sql<br />
Create_DB_Audit_Tables.SQL<br />
DB_Check.sql<br />
DB_FK_Constraints.sql<br />
DB_Primary_Key_Check.SQL<br />
DB_Tables.sql<br />
Drop_DB_Audit_Tables.SQL<br />
Insert_Duplicates_Tests.sql<br />
Referential_Integrity_Tests.sql<br />
SPFiles.sql<br />
SPLog.sql<br />
SPUsed.sql<br />
BrokerVolume.sql<br />
CustomerPosition.sql<br />
DataMaintenance.sql<br />
MarketFeed.sql<br />
MarketWatch.sql<br />
SecurityDetail.sql<br />
TradeLookup.sql<br />
TradeOrder.sql<br />
TradeResult.sql<br />
TradeStatus.sql<br />
TradeUpdate.sql<br />
BaseServer SupportingFiles/Clause3/BaseServer BaseServer.cpp<br />
BaseServer.h<br />
BaseServer.vcproj<br />
BaseServer.vcxproj<br />
stdafx.cpp<br />
stdafx.h<br />
SUTServersLocals.h<br />
SUT_CE_Server<br />
SUT_MEE_Serv<br />
er<br />
TransactionsSP<br />
SupportingFiles/Clause3/SUT_CE_Serv<br />
er<br />
SupportingFiles/Clause3/SUT_MEE_Se<br />
rver<br />
SupportingFiles/Clause3/TransactionsS<br />
P<br />
Release\SUT_CE_Server.exe<br />
CEServer.cpp<br />
CEServer.h<br />
CEServerMain.cpp<br />
PortDefinitions.h<br />
stdafx.cpp<br />
stdafx.h<br />
SUT_CE_Server.vcproj<br />
SUT_CE_Server.vcxproj<br />
SUTServer.sln<br />
SUTStructs.h<br />
Release\SUT_MEE_Server.exe<br />
MEEServer.cpp<br />
MEEServer.h<br />
MEEServerMain.cpp<br />
stdafx.cpp<br />
stdafx.h<br />
SUT_MEE_Server.vcproj<br />
SUT_MEE_Server.vcxproj<br />
BrokerVolumeDB_SP.cpp<br />
BrokerVolumeDB_SP.h<br />
CheckpointDB_SP.cpp<br />
CheckpointDB_SP.h<br />
CustomerPositionDB_SP.cpp<br />
CustomerPositionDB_SP.h<br />
DataMaintenanceDB_SP.cpp<br />
DataMaintenanceDB_SP.h<br />
MarketFeedDB_SP.cpp<br />
MarketFeedDB_SP.h<br />
MarketWatchDB_SP.cpp<br />
MarketWatchDB_SP.h<br />
SecurityDetailDB_SP.cpp<br />
SecurityDetailDB_SP.h<br />
stdafx.cpp<br />
stdafx.h<br />
TradeLookupDB_SP.cpp<br />
Fujitsu July 2012. TPC-E Full Disclosure Report -35-
Clause4<br />
TradeLookupDB_SP.h<br />
TradeOrderDB_SP.cpp<br />
TradeOrderDB_SP.h<br />
TradeResultDB_SP.cpp<br />
TradeResultDB_SP.h<br />
TradeStatusDB_SP.cpp<br />
TradeStatusDB_SP.h<br />
TradeUpdateDB_SP.cpp<br />
TradeUpdateDB_SP.h<br />
TransactionsSP.vcproj<br />
TransactionsSP.vcxproj<br />
TxnHarnessDBBase.cpp<br />
TxnHarnessDBBase.h<br />
TxnHarnessDBConn.cpp<br />
TxnHarnessDBConn.h<br />
TxnHarness SupportingFiles/Clause3/TxnHarnes TxnHarness.vcproj<br />
TxnHarness.vcxproj<br />
TxnHarness_stdafx.cpp<br />
TxnHarness_stdafx.h<br />
TxnHarnessSendToMarket.cpp<br />
TxnHarnessSendToMarket.h<br />
Clause5<br />
EGen Driver<br />
Configuration<br />
EGenLoader<br />
Parameter<br />
SupportingFiles/Clause5<br />
SupportingFiles/Clause5<br />
Fujitsu July 2012. TPC-E Full Disclosure Report -36-<br />
RX300S7_940KCus_16x19p_spiderc_RTE01.xml<br />
BuildSteps1.log<br />
BuildSteps2.log<br />
EGenLoaderFrom1To29000.log<br />
EGenLoaderFrom29001To59000.log<br />
….<br />
EGenLoaderFrom911001To940000.log<br />
TxnReportE-MI.xls<br />
EGenLogger SupportingFiles/Clause5<br />
Output<br />
Clause6 EGenValidate SupportingFiles/Clause6 EGenValidate.txt<br />
Clause7 ACID SupportingFiles/Clause7 MSTPCE ACID Procedures.docx<br />
ACID<br />
SupportingFiles/Clause7/AcidProcs AcidProc.cmd<br />
Procedures<br />
AcidProc.out<br />
ACID Scripts<br />
SupportingFiles/Clause7/AcidProcs/Scri<br />
pts<br />
Remove_AcidProcs.cmd<br />
AcidProc.vbs<br />
CustomerPosition_Iso3.sql<br />
CustomerPosition_Iso4.sql<br />
Remove_AcidProcs.vbs<br />
TradeOrder_C.sql<br />
TradeOrder_Iso1_1.sql<br />
TradeOrder_Iso1_2.sql<br />
TradeOrder_Iso2.sql<br />
TradeOrder_Iso3.sql<br />
TradeOrder_Iso4.sql<br />
TradeOrder_RB.sql<br />
TradeResult_Iso1_1.sql<br />
TradeResult_Iso1_2.sql<br />
TradeResult_Iso2_1.sql<br />
TradeResult_Iso2_2.sql<br />
TradeResult_Iso3.sql<br />
TradeResult_Iso4.sql<br />
Atomicity SupportingFiles/Clause7/Atomicity Atomicity.cmd<br />
Atomicity_C.out<br />
Atomicity_RB.out<br />
SupportingFiles/Clause7/Atomicity/Scri<br />
pts<br />
atom.vbs<br />
Atomicity_C.sql<br />
Atomicity_RB.sql<br />
Consistency SupportingFiles/Clause7/Consistency Consistency.cmd<br />
Durability<br />
Business<br />
Recovery<br />
SupportingFiles/Clause7/Consistency/S<br />
cripts<br />
SupportingFiles/Clause7/Durability/Busi<br />
nessRecovery<br />
Consistency.out<br />
Consistency.sql<br />
Consistency.vbs<br />
BR_BenchCraft_Config.xml<br />
BR_Consistency.out<br />
BR_Count_Settlement1.ver<br />
BR_Count_Settlement2.ver<br />
BR_ERRORLOG1.txt<br />
BR_ERRORLOG2a.txt<br />
BR_ERRORLOG2b.txt<br />
BR_SystemEvents_TierB.txt
Clause8<br />
Durability Data<br />
Accessibility<br />
SupportingFiles/Clause7/Durability/Data<br />
Accessibility<br />
BusinessRecov_Part1_step60.xlt<br />
BusinessRecov_Part1_TxnReportE_20.xls<br />
BusinessRecov_Part1_TxnReportE_all.xls<br />
BusinessRecov_Part2_step60.xlt<br />
BusinessRecov_Part2_TxnReportE_20.xls<br />
BusinessRecov_Part2_TxnReportE_all.xls<br />
BusinessRecov_TimeGraph.xls<br />
DA_BenchCraft_Config.xml<br />
DA_Count_Settlement1.ver<br />
DA_Count_Settlement2.ver<br />
DA_ERRORLOG.txt<br />
DataAccess_TimeGraph.xls<br />
DataAccess_TxnReportE_5min1.xls<br />
DataAccess_TxnReportE_5min2.xls<br />
DataAccess_TxnReportE_20min.xls<br />
DataAccess_TxnReportE_all.xls<br />
SystemEvents_Application.txt<br />
Isolation SupportingFiles/Clause7/Isolation Isolation1_S1.rpt<br />
Isolation1_S2.rpt<br />
Isolation1_S3.rpt<br />
Isolation1_S4.rpt<br />
Isolation2_S1.rpt<br />
Isolation2_S2.rpt<br />
Isolation2_S3.rpt<br />
Isolation2_S4.rpt<br />
Isolation3_S1.rpt<br />
Isolation3_S2.rpt<br />
Isolation3_S3.rpt<br />
Isolation4_S1.rpt<br />
Isolation4_S2.rpt<br />
Isolation4_S3.rpt<br />
60-Day Space<br />
Calculations<br />
SupportingFiles/Clause7/Isolation/Script<br />
s<br />
SupportingFiles/Clause8<br />
Isolation1_S1.sql<br />
Isolation1_S2.sql<br />
Isolation1_S3.sql<br />
Isolation1_S4.sql<br />
Isolation2_S1.sql<br />
Isolation2_S2.sql<br />
Isolation2_S3.sql<br />
Isolation2_S4.sql<br />
Isolation3_S1.sql<br />
Isolation3_S2.sql<br />
Isolation3_S3.sql<br />
Isolation4_S1.sql<br />
Isolation4_S2.sql<br />
Isolation4_S3.sql<br />
tpce_space.xls<br />
Fujitsu July 2012. TPC-E Full Disclosure Report -37-
Appendix: Third Party Price Quotations<br />
Microsoft Corporation<br />
One Microsoft Way<br />
Redmond, WA 98052-6399<br />
Tel 425 882 8080<br />
Fax 425 936 7329<br />
http://www.microsoft.com/<br />
Microsoft<br />
June 20, 2012<br />
Fujitsu<br />
Detlev Seidel<br />
Heinz-Nixdorf-Ring 1<br />
Paderborn, Germany 33106<br />
Here is the information you requested regarding pricing for several Microsoft products to be<br />
used in conjunction with your TPC-E benchmark testing.<br />
All pricing shown is in US Dollars ($).<br />
Part<br />
Number<br />
Description Unit Price Quantity Price<br />
7JQ-00256<br />
SQL Server 2012 Enterprise Edition<br />
2 Core License<br />
$ 13,472.50 8 $ 107,780.00<br />
P72-04217<br />
Windows Server 2008 R2 Enterprise Edition<br />
Server License with 25 CALs<br />
Open Program - Level C<br />
Unit Price reflects a 43% discount from the<br />
retail unit price of $3,999.<br />
$ 2,280 1 $ 2,280<br />
P73-04165<br />
Windows Server 2008 Standard Edition<br />
Server License with 5 CALs<br />
Open Program - Level C<br />
Unit Price reflects a 29% discount from the<br />
retail unit price of $999.<br />
$ 711.00 1 $ 711.00<br />
N/A<br />
Microsoft Problem Resolution Services<br />
Professional Support<br />
(1 Incident).<br />
$ 259.00 1 $ 259.00<br />
SQL Server 2012 Enterprise Edition, Windows Server 2008 R2 Enterprise Edition, and<br />
Windows Server 2008 R2 Standard Edition are currently orderable and available through<br />
Microsoft's normal distribution channels. A list of Microsoft's resellers can be found in the<br />
Microsoft Product Information Center at http://pinpoint.microsoft.com/en-US/home.<br />
Defect support is included in the purchase price. Additional support is available from<br />
Microsoft PSS on an incident by incident basis at $259.00 call.<br />
This quote is valid for the next 90 days.<br />
Reference ID: TPCE_qhtplylDTLKTVUKfhjjJjhiJiniHjif85757.DOC.<br />
Fujitsu July 2012. TPC-E Full Disclosure Report -38-
Appendix B: TPC-Energy Disclosure Report<br />
TPC-Energy Clause 2-related items (Methodology)<br />
The minimum ambient temperature must be disclosed. (7.3.2.1)<br />
The Minimum Temperature reported by EMS :<br />
20.13 Degrees Celsius<br />
The characteristics of the external electric power source must be disclosed. In particular, the voltage, frequency in<br />
Hertz, and phase information must be reported. (7.3.2.2)<br />
The external electric power source has the following characteristics: 230V, 50Hz, single phase<br />
A statement is required that assures that nothing was done to alter the air-pressure in the measurement<br />
environment. (7.3.2.3)<br />
Nothing was done to alter the air-pressure in the measurement environment<br />
A description of where the temperature was measured and how it was determined that this was representative of<br />
the lowest ambient temperature is required. (7.3.2.4)<br />
The temperature was measured for several air inlets located on different components of SUT and the lowest<br />
temperature is reported.<br />
If a method of cooling other than circulation of ambient air is employed in the REC, a statement describing this<br />
method must be included. (7.3.2.5)<br />
No other method of cooling was used<br />
7.3.2.6 To be compliant with licenses associated with EMS, the following statement must be included in every<br />
FDR which contains a TPC-Energy Metric: (7.3.2.6)<br />
The power and temperature characteristics of the MEC were measured using TPC’s Energy Measurement<br />
Software (EMS). This includes the EMS-PTD, a modified version of the SPEC PTDaemon, which is provided<br />
under license from the Standard Performance Evaluation Corporation (SPEC).<br />
TPC-Energy Clause 3-related items (Metrics)<br />
Primary Metric. (7.3.3.1)<br />
1) The normalized work derived from the Performance Metric (as described in Clause 3.2.1) must be disclosed<br />
2) The computation for total energy used (REC Energy Consumption) for each measurement segment that<br />
contributes to a Performance Metric must be disclosed. If the energy of the entire Priced Configuration is not<br />
derived from direct measurements, the methods for deriving the energy for components which were not<br />
measured must be disclosed (See Clause 7.3.3.4)<br />
3) The duration of each measurement that produces a Performance Metric must be disclosed.<br />
4) The average power requirement for each measurement that produces one of these metrics<br />
5) The TPC-Energy Primary Metric must be disclosed, including the calculation that is used to derive it.<br />
Fujitsu July 2012. TPC-E Full Disclosure Report -39-
PMU-1 = Tier B<br />
(Database Server)<br />
Device: HIOKI 3334<br />
Calibrated: 10-May-12<br />
Measurement Interval<br />
Meter<br />
Delta<br />
PMU Energy<br />
Average (watt) 591.23 % of Reading 0.20% Reading Delta 1.1825 Accuracy Factor 0.20%<br />
Total (watt-sec) 4,256,862.46 % of Range 0.00% Range Delta 0.0000 Adjusted (watt-sec) 4,265,376.18<br />
Duration (sec) 7,200 Range (watt) 900.00 Total Delta 1.1825 Avg Power (watt) 592.41<br />
PMU-2 = Tier A (Application Server)<br />
Device: HIOKI 3334<br />
Calibrated: 10-May-12<br />
Measurement Interval Meter Delta PMU Energy<br />
Average (watt) 100.59 % of Reading 0.10% Reading Delta 0.10 Accuracy Factor 0.40%<br />
Total (watt-sec) 724,275.39 % of Range 0.10% Range Delta 0.30 Adjusted (watt-sec) 727,159.75<br />
Duration (sec) 7,200 Range (watt) 300.00 Total Delta 0.40 Avg Power (watt) 100.99<br />
PMU-3 = Storage<br />
Device: HIOKI 3334<br />
Calibrated: 10-May-12<br />
Measurement Interval Meter Delta PMU Energy<br />
Average (watt) 577.26 % of Reading 0.20% Reading Delta 1.15 Accuracy Factor 0.20%<br />
Total (watt-sec) 4,156,285.59 % of Range 0.00% Range Delta 0.00 Adjusted (watt-sec) 4,164,598.16<br />
Duration (sec) 7,200 Range (watt) 900.00 Total Delta 1.15 Avg Power (watt) 578.42<br />
PMU-4 = Monitor (Nameplate) (Misc)<br />
PMU Energy<br />
Average (watt) 17.00<br />
Duration (sec) 7,200.00<br />
Total Energy (watt-sec) 122,400.00<br />
Avg REC Energy (watt) 1,288.82<br />
Total REC Energy (watt-sec) 9,279,534<br />
Run Duration (sec) 7,200<br />
Reported tpsE 1,871.81<br />
Total Transactions 13,477,032.00<br />
Energy (watts/tpsE) 0.69<br />
Total REC Energy Consumption =<br />
9,279,534 watt-seconds<br />
SUT Total Work = Run Duration * Reported tpsE<br />
SUT Total Work =<br />
13,477,032 transactions<br />
9,279,534 watt-seconds / 13,477,032 transactions = 0.69 watts/tpsE<br />
Secondary Metrics At Reported Performance. (7.3.3.2)<br />
If the TPC-Energy Secondary Metrics are reported, the components of the REC which are included in each<br />
subsystem must be identified. This can be achieved with separate lists to be included in the FDR or with a specific<br />
designation in the price spreadsheet. Every component in the REC that consumes energy must be included in<br />
exactly one subsystem.<br />
For each defined subsystem, the calculations defined for the TPC-Energy Secondary Metrics in Clause 3.3 must<br />
be reported, using the Performance Metric of the entire SUT and the energy consumption for each REC<br />
subsystem.<br />
Secondary Metrics<br />
Additional Numerical Quantities<br />
Full Load Full Load Idle<br />
Idle<br />
watts/tpsE Avg Watts % of REC Avg Watts % of REC<br />
Database Server *)<br />
0.32 592.41 45.97% 239.56 28.39%<br />
Storage *)<br />
0.31 578.42 44.88% 544.80 64.56%<br />
Application Server *)<br />
0.05 100.99 7.84% 59.12 7.01%<br />
Miscellaneous *)<br />
0.01 17.00 1.32% 0.40 0.05%<br />
Total REC<br />
0.69 1,288.82 100.00% 843.88 100.00%<br />
*)See pricing for list of components<br />
Fujitsu July 2012. TPC-E Full Disclosure Report -40-
Database Server<br />
Storage<br />
Application Server<br />
Miscellaneous<br />
4,265,376.18 watt-seconds/ 13,477,032 transactions = 0.32 watts/tpsE<br />
4,164,598.16 watt-seconds/ 13,477,032 transactions = 0.31 watts/tpsE<br />
727,159.75 watt-seconds/ 13,477,032 transactions = 0.05 watts/tpsE<br />
122,400.00 watt-seconds/ 13,477,032 transactions = 0.01 watts/tpsE<br />
Idle Power reporting. (7.3.3.3)<br />
1) The Idle Power measurement/calculation for the REC must be reported as numerical quantities.<br />
2) If TPC-Energy Secondary Metrics are reported, then the Idle Power measurement/calculation for each<br />
subsystem must also be reported as numerical quantities.<br />
3) The length of time between the conclusion of the performance measurement and the start of the idle<br />
measurement must be reported.<br />
4) The duration of the idle measurement must be reported<br />
5) A statement is required that assures that the system is in a state that is ready to run the Application(s) of the<br />
benchmark for the duration of the idle measurement.<br />
PMU-1 = Tier B (Database Server)<br />
Device: HIOKI 3334<br />
Calibrated: 10-May-12<br />
Idle Interval<br />
Meter Delta PMU Energy<br />
Average (watt) 238.42 % of Reading 0.10% Reading Delta 0.2384 Accuracy Factor 0.48%<br />
Total (watt-sec) 143,059.19 % of Range 0.10% Range Delta 0.9000 Adjusted (watt-sec) 143,742.28<br />
Duration (sec) 600 Range (watt) 900.00 Total Delta 1.1384 Avg Power (watt) 239.56<br />
PMU-2 = Tier A (Application Server)<br />
Device: HIOKI 3334<br />
Calibrated: 10-May-12<br />
Idle Interval Meter Delta PMU Energy<br />
Average (watt) 58.76 % of Reading 0.10% Reading Delta 0.06 Accuracy Factor 0.61%<br />
Total (watt-sec) 35,257.16 % of Range 0.10% Range Delta 0.30 Adjusted (watt-sec) 35,472.42<br />
Duration (sec) 600 Range (watt) 300.00 Total Delta 0.36 Avg Power (watt) 59.12<br />
PMU-3 = Storage<br />
Device: HIOKI 3334<br />
Calibrated: 10-May-12<br />
Idle Interval<br />
Meter Delta PMU Energy<br />
Average (watt) 543.71 % of Reading 0.20% Reading Delta 1.09 Accuracy Factor 0.20%<br />
Total (watt-sec) 326,220.78 % of Range 0.00% Range Delta 0.00 Adjusted (watt-sec) 326,873.22<br />
Duration (sec) 600 Range (watt) 900.00 Total Delta 1.09 Avg Power (watt) 544.80<br />
PMU-4 = Monitor (Nameplate) (Misc)<br />
PMU Energy<br />
Average (watt) 0.40<br />
Idle Power (watt) 843.88<br />
Idle power measurement for REC = 843.88 Watts<br />
The Idle measurement was started 7 minutes after all data processing was completed.<br />
Idle measurement duration was 600 seconds<br />
The system was in a state that was ready to run the applications of the benchmark for the duration of the idle<br />
measurement. This was verified by executing one transaction after the idle measurement interval was completed.<br />
The transaction time was compared to the allowed 90 th percentile and found to meet the required specification.<br />
Disclosure requirements when only part of the REC is measured for power. (7.3.3.4)<br />
The monitor power consumption in the PMU-4 was calculated using the Nameplate<br />
Disclosure requirements when component substitution is used. (7.3.3.5)<br />
Fujitsu July 2012. TPC-E Full Disclosure Report -41-
The Priced Configuration was identical to the Measured Configuration<br />
TPC-Energy Clause 4-related items (Drivers/Controller)<br />
A statement indicating the version of EMS used must be included in the FDR, including a statement that no<br />
alterations of this code were made for the benchmark, except as specified by Clause 7.3.4.3. This includes levels<br />
for the EMS-PTD Manager, EMS-PTD, EMS Report Generator, and EMS-controller. (7.3.4.1)<br />
The TPC Energy Management System V1.4.2 was used<br />
Input parameters for the EMS software must be disclosed. (7.3.4.2)<br />
See supporting files<br />
Any changes in the EMS components must be documented. Documentation must include a description of the<br />
issue, the reason the change was necessary for disclosure of the Result, and the changes made to resolve it. Any<br />
change to TPC-Provided Code must be included with the submission as a Supporting File. (7.3.4.3)<br />
No changes to EMS components were made<br />
TPC-Energy Clause 6-related items (Instrumentation)<br />
For each separate energy measurement (each subset measurement for each distinct measurement period), the<br />
following must be reported:<br />
1) Analyzer used (make, model)<br />
2) Date of certification of the analyzer (NIST or equivalent)<br />
3) Range settings for Amperage, Voltage, and other settings for the measurement period<br />
4) Specifications of any additional probes used in the energy measurement<br />
5) The accuracy percentages used in the calculations and the source of those percentages. (7.3.6.1)<br />
Accuracy percentages are taken from the HIOKI Instruction Manual 3334 3334-01 AC/DC POWER HiTESTER<br />
The make and model of the temperature sensor and/or probe must be disclosed. (7.3.6.2)<br />
Digi WatchportH<br />
Make<br />
Model<br />
Serial<br />
Number<br />
Calibration<br />
date<br />
The accuracy percentage for the temperature sensor and/or probe and the source of this information must be<br />
disclosed. (7.3.6.3)<br />
Temperature accuracy from Manufacturer’s Datasheet:<br />
+/- 0.5° C at -10° C to 85° C<br />
Power Analyzer Specifications and Settings<br />
Range<br />
Settings<br />
Current [A]<br />
Range<br />
Settings<br />
Voltage[V]<br />
Full Load<br />
% of reading % of range % of reading % of range<br />
PMU1 - Database Server HIOKI 3334 90604934 10-May-12 3 300 0.20% 0.00% 0.10% 0.10%<br />
PMU2 - Application Server HIOKI 3334 90604933 10-May-12 1 300 0.10% 0.10% 0.10% 0.10%<br />
PMU3 - Storage HIOKI 3334 90604932 10-May-12 3 300 0.20% 0.00% 0.20% 0.00%<br />
Idle<br />
Fujitsu July 2012. TPC-E Full Disclosure Report -42-
TPC-Energy Clause 8-related items<br />
Fujitsu July 2012. TPC-E Full Disclosure Report -43-
Fujitsu July 2012. TPC-E Full Disclosure Report -44-
Supporting Files Index (7.4.4)<br />
Clause Description Path<br />
7.4.1 Energy<br />
Measurement<br />
Logfiles<br />
7.4.2 Energy<br />
Measurement<br />
Controller Files<br />
7.4.3 Energy<br />
Measurement<br />
Configuration<br />
Files<br />
Clause7.4.1\ptdmanager-logs\A-Power-logresults-001.xml<br />
Clause7.4.1\ptdmanager-logs\B-Power-logresults-001.xml<br />
Clause7.4.1\ptdmanager-logs\S-Power-logresults-001.xml<br />
Clause7.4.1\ptdmanager-logs\A-Temperature-logresults-001.xml<br />
Clause7.4.1\ptdmanager-logs\B-Temperature-logresults-001.xml<br />
Clause7.4.1\ptdmanager-logs\S-Temperature-logresults-001.xml<br />
Clause7.4.1\RUN-REPORTS\rgen-A-Power.txt<br />
Clause7.4.1\RUN-REPORTS\rgen-B-Power.txt<br />
Clause7.4.1\RUN-REPORTS\rgen-S-Power.txt<br />
Clause7.4.1\RUN-REPORTS\rgen-A-Temperature.txt<br />
Clause7.4.1\RUN-REPORTS\rgen-B-Temperature.txt<br />
Clause7.4.1\RUN-REPORTS\rgen-S-Temperature.txt<br />
Clause7.4.1\IDLE-REPORTS\rgen-A-Power.txt<br />
Clause7.4.1\IDLE-REPORTS\rgen-B-Power.txt<br />
Clause7.4.1\IDLE-REPORTS\rgen-S-Power.txt<br />
Clause7.4.1\IDLE-REPORTS\rgen-A-Temperature.txt<br />
Clause7.4.1\IDLE-REPORTS\rgen-B-Temperature.txt<br />
Clause7.4.1\IDLE-REPORTS\rgen-S-Temperature.txt<br />
Clause7.4.1\RX300S7_TPC-E-Energy-Calculation.xlsx<br />
Clause7.4.2\emsc.log<br />
Clause7.4.2\emsc_commands.ems<br />
Clause7.4.3\A-Power-ptd.cmd<br />
Clause7.4.3\B-Power-ptd.cmd<br />
Clause7.4.3\S-Power-ptd.cmd<br />
Clause7.4.3\A-Temperature-ptd.cmd<br />
Clause7.4.3\B-Temperature-ptd.cmd<br />
Clause7.4.3\S-Temperature-ptd.cmd<br />
Clause7.4.3\A-Power-ptdm.cmd<br />
Clause7.4.3\B-Power-ptdm.cmd<br />
Clause7.4.3\S-Power-ptdm.cmd<br />
Clause7.4.3\A-Temperature-ptdm.cmd<br />
Clause7.4.3\B-Temperature-ptdm.cmd<br />
Clause7.4.3\S-Temperature-ptdm.cmd<br />
Fujitsu July 2012. TPC-E Full Disclosure Report -45-