The Power and Promise of Girls' Education - Save the Children
The Power and Promise of Girls' Education - Save the Children
The Power and Promise of Girls' Education - Save the Children

You also want an ePaper? Increase the reach of your titles
YUMPU automatically turns print PDFs into web optimized ePapers that Google loves.
decisions for herself, go out in public unaccompanied, or<br />
participate in activities with boys her own age. In some<br />
cultures, violence or “honor killings” occur when girls<br />
are believed to have shamed <strong>the</strong>ir families by socializing<br />
with males outside <strong>of</strong> <strong>the</strong> family.<br />
Poverty does not have to be a barrier to<br />
educating girls<br />
All <strong>of</strong> <strong>the</strong>se factors may be exacerbated by poverty, but<br />
poverty alone is not an excuse for a nation failing to<br />
educate its girls. A number <strong>of</strong> relatively poor countries<br />
are doing an admirable job <strong>of</strong> getting girls into school,<br />
while o<strong>the</strong>r countries with greater resources are not<br />
doing nearly as well.<br />
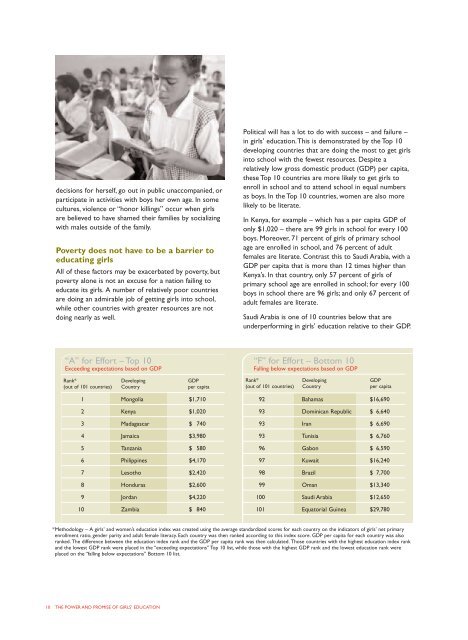
Political will has a lot to do with success – <strong>and</strong> failure –<br />
in girls’ education.This is demonstrated by <strong>the</strong> Top 10<br />
developing countries that are doing <strong>the</strong> most to get girls<br />
into school with <strong>the</strong> fewest resources. Despite a<br />
relatively low gross domestic product (GDP) per capita,<br />
<strong>the</strong>se Top 10 countries are more likely to get girls to<br />
enroll in school <strong>and</strong> to attend school in equal numbers<br />
as boys. In <strong>the</strong> Top 10 countries, women are also more<br />
likely to be literate.<br />
In Kenya, for example – which has a per capita GDP <strong>of</strong><br />
only $1,020 – <strong>the</strong>re are 99 girls in school for every 100<br />
boys. Moreover, 71 percent <strong>of</strong> girls <strong>of</strong> primary school<br />
age are enrolled in school, <strong>and</strong> 76 percent <strong>of</strong> adult<br />
females are literate. Contrast this to Saudi Arabia, with a<br />
GDP per capita that is more than 12 times higher than<br />
Kenya’s. In that country, only 57 percent <strong>of</strong> girls <strong>of</strong><br />
primary school age are enrolled in school; for every 100<br />
boys in school <strong>the</strong>re are 96 girls; <strong>and</strong> only 67 percent <strong>of</strong><br />
adult females are literate.<br />
Saudi Arabia is one <strong>of</strong> 10 countries below that are<br />
underperforming in girls’ education relative to <strong>the</strong>ir GDP.<br />
“A” for Effort – Top 10 “F” for Effort – Bottom 10<br />
Exceeding expectations based on GDP<br />
Falling below expectations based on GDP<br />
Rank* Developing GDP<br />
(out <strong>of</strong> 101 countries) Country per capita<br />
1 Mongolia $1,710<br />
2 Kenya $1,020<br />
3 Madagascar $ 740<br />
4 Jamaica $3,980<br />
5 Tanzania $ 580<br />
6 Philippines $4,170<br />
7 Lesotho $2,420<br />
8 Honduras $2,600<br />
9 Jordan $4,220<br />
10 Zambia $ 840<br />
Rank* Developing GDP<br />
(out <strong>of</strong> 101 countries) Country per capita<br />
92 Bahamas $16,690<br />
93 Dominican Republic $ 6,640<br />
93 Iran $ 6,690<br />
93 Tunisia $ 6,760<br />
96 Gabon $ 6,590<br />
97 Kuwait $16,240<br />
98 Brazil $ 7,700<br />
99 Oman $13,340<br />
100 Saudi Arabia $12,650<br />
101 Equatorial Guinea $29,780<br />
*Methodology – A girls’ <strong>and</strong> women’s education index was created using <strong>the</strong> average st<strong>and</strong>ardized scores for each country on <strong>the</strong> indicators <strong>of</strong> girls’ net primary<br />
enrollment ratio, gender parity <strong>and</strong> adult female literacy. Each country was <strong>the</strong>n ranked according to this index score. GDP per capita for each country was also<br />
ranked. <strong>The</strong> difference between <strong>the</strong> education index rank <strong>and</strong> <strong>the</strong> GDP per capita rank was <strong>the</strong>n calculated. Those countries with <strong>the</strong> highest education index rank<br />
<strong>and</strong> <strong>the</strong> lowest GDP rank were placed in <strong>the</strong> “exceeding expectations” Top 10 list, while those with <strong>the</strong> highest GDP rank <strong>and</strong> <strong>the</strong> lowest education rank were<br />
placed on <strong>the</strong> “falling below expectations” Bottom 10 list.<br />
10<br />
THE POWER AND PROMISE OF GIRLS’ EDUCATION

![View full document [PDF 3.39 MB] - PreventionWeb](https://img.yumpu.com/27308954/1/190x245/view-full-document-pdf-339-mb-preventionweb.jpg?quality=85)