Intellectual Capital Management in Malaysian Public Listed
Intellectual Capital Management in Malaysian Public Listed
Intellectual Capital Management in Malaysian Public Listed

You also want an ePaper? Increase the reach of your titles
YUMPU automatically turns print PDFs into web optimized ePapers that Google loves.
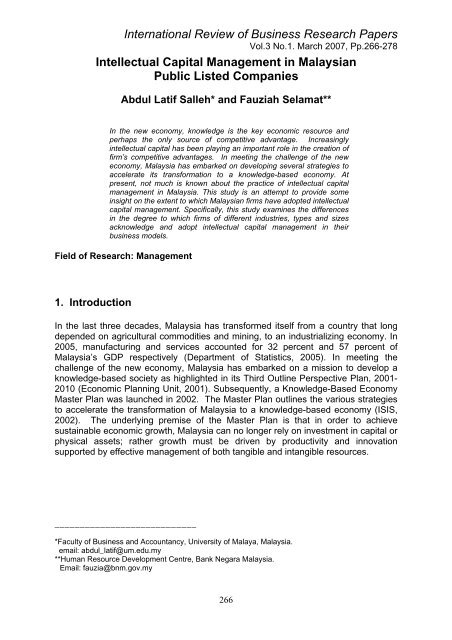
International Review of Bus<strong>in</strong>ess Research Papers<br />
Vol.3 No.1. March 2007, Pp.266-278<br />
<strong>Intellectual</strong> <strong>Capital</strong> <strong>Management</strong> <strong>in</strong> <strong>Malaysian</strong><br />
<strong>Public</strong> <strong>Listed</strong> Companies<br />
Abdul Latif Salleh* and Fauziah Selamat**<br />
In the new economy, knowledge is the key economic resource and<br />
perhaps the only source of competitive advantage. Increas<strong>in</strong>gly<br />
<strong>in</strong>tellectual capital has been play<strong>in</strong>g an important role <strong>in</strong> the creation of<br />
firm’s competitive advantages. In meet<strong>in</strong>g the challenge of the new<br />
economy, Malaysia has embarked on develop<strong>in</strong>g several strategies to<br />
accelerate its transformation to a knowledge-based economy. At<br />
present, not much is known about the practice of <strong>in</strong>tellectual capital<br />
management <strong>in</strong> Malaysia. This study is an attempt to provide some<br />
<strong>in</strong>sight on the extent to which <strong>Malaysian</strong> firms have adopted <strong>in</strong>tellectual<br />
capital management. Specifically, this study exam<strong>in</strong>es the differences<br />
<strong>in</strong> the degree to which firms of different <strong>in</strong>dustries, types and sizes<br />
acknowledge and adopt <strong>in</strong>tellectual capital management <strong>in</strong> their<br />
bus<strong>in</strong>ess models.<br />
Field of Research: <strong>Management</strong><br />
1. Introduction<br />
In the last three decades, Malaysia has transformed itself from a country that long<br />
depended on agricultural commodities and m<strong>in</strong><strong>in</strong>g, to an <strong>in</strong>dustrializ<strong>in</strong>g economy. In<br />
2005, manufactur<strong>in</strong>g and services accounted for 32 percent and 57 percent of<br />
Malaysia’s GDP respectively (Department of Statistics, 2005). In meet<strong>in</strong>g the<br />
challenge of the new economy, Malaysia has embarked on a mission to develop a<br />
knowledge-based society as highlighted <strong>in</strong> its Third Outl<strong>in</strong>e Perspective Plan, 2001-<br />
2010 (Economic Plann<strong>in</strong>g Unit, 2001). Subsequently, a Knowledge-Based Economy<br />
Master Plan was launched <strong>in</strong> 2002. The Master Plan outl<strong>in</strong>es the various strategies<br />
to accelerate the transformation of Malaysia to a knowledge-based economy (ISIS,<br />
2002). The underly<strong>in</strong>g premise of the Master Plan is that <strong>in</strong> order to achieve<br />
susta<strong>in</strong>able economic growth, Malaysia can no longer rely on <strong>in</strong>vestment <strong>in</strong> capital or<br />
physical assets; rather growth must be driven by productivity and <strong>in</strong>novation<br />
supported by effective management of both tangible and <strong>in</strong>tangible resources.<br />
____________________________<br />
*Faculty of Bus<strong>in</strong>ess and Accountancy, University of Malaya, Malaysia.<br />
email: abdul_latif@um.edu.my<br />
**Human Resource Development Centre, Bank Negara Malaysia.<br />
Email: fauzia@bnm.gov.my<br />
266
Salleh & Selamat<br />
Drucker (1995) contends that <strong>in</strong> the new economy, knowledge is the key economic<br />
resource and the dom<strong>in</strong>ant – and perhaps even the only - source of competitive<br />
advantage. In contrast to the traditional <strong>in</strong>put-driven economy where firms focus on<br />
manag<strong>in</strong>g tangible assets, the key to organizational success <strong>in</strong> the emerg<strong>in</strong>g<br />
knowledge-economy is to effectively manage the “<strong>in</strong>visible balance sheet”, which<br />
comprises the <strong>in</strong>tangible knowledge and assets of the organization. In the<br />
knowledge-based economy, firm’s core assets are their <strong>in</strong>tellectual capitals made up<br />
of the comb<strong>in</strong>ed knowledge of human, structural and relational resources. Thus,<br />
<strong>in</strong>creas<strong>in</strong>gly <strong>in</strong>tellectual capital has taken the centre stage <strong>in</strong> firm’s efforts to create<br />
competitive advantages (Kaplan and Norton, 2004), and has been proposed as an<br />
essential factor contribut<strong>in</strong>g to organizational survival, and the ma<strong>in</strong>tenance of<br />
competitive strength, and <strong>in</strong> enhanc<strong>in</strong>g firm performance (Leana and Van Buren,<br />
1999). One of the strong evidences of this <strong>in</strong>tellectual capital phenomenon is the gap<br />
between book and market values, which has been widen<strong>in</strong>g over time. The grow<strong>in</strong>g<br />
discrepancy between market value and book value of a corporation is said to be<br />
largely attributed to <strong>in</strong>tellectual capital - the <strong>in</strong>tangibles of the bus<strong>in</strong>ess that underp<strong>in</strong><br />
its future growth (Lowell, 1997).<br />
In Malaysia, it is acknowledged that the number of knowledge workers and new<br />
knowledge-based opportunities are expected to <strong>in</strong>crease <strong>in</strong> the near future and this<br />
new phenomenon will force firms to further develop and manage their <strong>in</strong>tellectual<br />
capital effectively (Naquiyudd<strong>in</strong> and Heong, 1992). However, presently not much is<br />
known as to the extent to which firms <strong>in</strong> Malaysia have adopted <strong>in</strong>tellectual capital<br />
management. Thus, this exploratory study seeks to exam<strong>in</strong>e some of the issues<br />
relat<strong>in</strong>g to <strong>in</strong>tellectual capital management <strong>in</strong> Malaysia.<br />
2. <strong>Intellectual</strong> <strong>Capital</strong><br />
The <strong>in</strong>terest <strong>in</strong> <strong>Intellectual</strong> capital as a bus<strong>in</strong>ess management tool is seem<strong>in</strong>gly <strong>in</strong> its<br />
embryonic stage of development (Juma and Pa<strong>in</strong>e, 2004; Bontis, 2001). For<br />
bus<strong>in</strong>ess practitioners, the first acknowledgement of <strong>in</strong>tellectual capital came with<br />
Skandia’s release of the world’s first <strong>in</strong>tellectual capital annual report <strong>in</strong> 1995<br />
(Edv<strong>in</strong>sson and Malone, 1997). Among academics, <strong>in</strong>tellectual capital has been<br />
researched for a slightly longer period, and traceable to ideas and studies on social<br />
and human capital (Leana and Van Buren, 1999).<br />
S<strong>in</strong>ce the beg<strong>in</strong>n<strong>in</strong>g of <strong>in</strong>tellectual capital research <strong>in</strong> the early 1980s, several<br />
def<strong>in</strong>itions of <strong>in</strong>tellectual capital have emerged (Itami 1987, Brook<strong>in</strong>g 1996, and<br />
Stewart 199). Itami def<strong>in</strong>es <strong>in</strong>tellectual capital to <strong>in</strong>clude particular technology,<br />
customer <strong>in</strong>formation, brand name, reputation and corporate culture, which is<br />
<strong>in</strong>valuable to firm’s competitive power. Stewart views <strong>in</strong>tellectual capital as<br />
knowledge, <strong>in</strong>formation, <strong>in</strong>tellectual property and experience that can be used to<br />
create wealth. Brook<strong>in</strong>g def<strong>in</strong>es <strong>in</strong>tellectual capital as the comb<strong>in</strong>ed <strong>in</strong>tangible assets<br />
which enable the company to function and sees an enterprise as the sum of its<br />
tangible assets and <strong>in</strong>tangible assets as expressed <strong>in</strong> the follow<strong>in</strong>g formula:<br />
Enterprise = Tangible Assets + <strong>Intellectual</strong> <strong>Capital</strong><br />
267
Salleh & Selamat<br />
Tak<strong>in</strong>g it further, Edv<strong>in</strong>sson (1997) equates <strong>in</strong>tellectual capital with the sum of<br />
human capital, structural capital and customer capital, i.e.<br />
<strong>Intellectual</strong> <strong>Capital</strong> = Human <strong>Capital</strong> + Structural <strong>Capital</strong> + Customer <strong>Capital</strong><br />
From a resource-based perspective, firms ga<strong>in</strong> competitive advantage and superior<br />
performance through the acquisition, hold<strong>in</strong>g and subsequent use of strategic assets<br />
(Wernerfelt, 1984). A firm is expected to be able to strike an optimal balance<br />
between the employments of its tangible resources i.e. physical and f<strong>in</strong>ancial<br />
resources; and <strong>in</strong>tangible resources like people, technology and relationships.<br />
The <strong>in</strong>creas<strong>in</strong>g gap between firms’ market and book value over the years has drawn<br />
further attention to explor<strong>in</strong>g the <strong>in</strong>visible value omitted from f<strong>in</strong>ancial statements.<br />
Lev (2001) discovered that over the period of 1977 and 2001, the market-to-book<br />
value ratios of US Standard and Poors (S&P) 500 corporations <strong>in</strong>creased from<br />
slightly over 1 to over 5, imply<strong>in</strong>g that about 80 percent of corporate market value<br />
has not been reflected <strong>in</strong> f<strong>in</strong>ancial report<strong>in</strong>g. He concluded that the limitation of<br />
f<strong>in</strong>ancial statements <strong>in</strong> expla<strong>in</strong><strong>in</strong>g firm’s value underl<strong>in</strong>es the fact that the source of<br />
economic value is no longer the production of material goods, but the creation of<br />
<strong>in</strong>tellectual capital.<br />
3. Dimensions of <strong>Intellectual</strong> <strong>Capital</strong><br />
As deliberated above, <strong>in</strong>tellectual capital researchers have proposed numerous<br />
def<strong>in</strong>itions of <strong>in</strong>tellectual capital. While Stewart (1997) def<strong>in</strong>es <strong>in</strong>tellectual capital <strong>in</strong><br />
the general term as <strong>in</strong>tellectual material i.e. knowledge <strong>in</strong>formation, <strong>in</strong>tellectual<br />
property and experience that can be used to create wealth, Lynn (1998) def<strong>in</strong>es<br />
<strong>in</strong>tellectual capital as the wealth of ideas and the ability to <strong>in</strong>novate, both be<strong>in</strong>g<br />
factors that determ<strong>in</strong>e the future of the organization. From bus<strong>in</strong>ess practitioner’s<br />
perspective, Edv<strong>in</strong>sson (1997) expla<strong>in</strong>s <strong>in</strong>tellectual capital as applied experience,<br />
organizational technology, customer relationships and professional skills that provide<br />
a firm with a competitive advantage.<br />
There are several <strong>in</strong>dicators specified by various researchers <strong>in</strong> their attempt to<br />
measure <strong>in</strong>tellectual capital. For example, Edv<strong>in</strong>sson and Malone (1997) used the<br />
‘Navigator’ model that focus on f<strong>in</strong>ancial, customer, process, renewal and<br />
development, and human capital to measure <strong>in</strong>tellectual capital. Accord<strong>in</strong>g to this<br />
model, the hidden factors of human and structural capital when added together<br />
comprise <strong>in</strong>tellectual capital. For his part, Bontis (1998) conducted an exploratory<br />
study that developed measures and models of <strong>in</strong>tellectual capital through survey<br />
questionnaires. He used 53 items to measure <strong>in</strong>tellectual capital <strong>in</strong> which 20 items<br />
measure human capital, 16 items measure structural capital and 17 items measure<br />
customer capital.<br />
Def<strong>in</strong>itions and conceptualizations of <strong>in</strong>tellectual capital are not significantly different<br />
among the researchers. Many <strong>in</strong>tellectual capital models have similar constructs and<br />
measures that are merely labelled differently. For <strong>in</strong>stance, human capital<br />
(Edv<strong>in</strong>sson and Malone, 1997) is termed human-centred assets by Brook<strong>in</strong>g (1996)<br />
and competence of personnel by Sveiby (1997). Based on the concepts and<br />
268
Salleh & Selamat<br />
variables developed by various researchers, this study conceptualizes <strong>in</strong>tellectual<br />
capital <strong>in</strong>to 3 essential components as depicted <strong>in</strong> Figure 1.<br />
<strong>Intellectual</strong><br />
<strong>Capital</strong><br />
Human <strong>Capital</strong> Structural capital Customer <strong>Capital</strong><br />
Essence Human Intellect Organizational<br />
Rout<strong>in</strong>es<br />
Scope Internal with<strong>in</strong><br />
employee node<br />
(Adapted from Bontis, 1998)<br />
3.1 Human <strong>Capital</strong><br />
Internal<br />
organizational l<strong>in</strong>ks<br />
Figure 1: Conceptualization of <strong>Intellectual</strong> <strong>Capital</strong><br />
Market Relationships<br />
External<br />
organizational l<strong>in</strong>ks<br />
Accord<strong>in</strong>g to Roos and Roos (1997), employees generate <strong>in</strong>tellectual capital through<br />
their competence, attitude and their <strong>in</strong>tellectual agility. He elaborates that<br />
competence <strong>in</strong>cludes skills and education, while attitude covers the behavioural<br />
component of the employees work. In addition, <strong>in</strong>tellectual agility enables an<br />
employee to change practices and to th<strong>in</strong>k of <strong>in</strong>novative solutions to problems. For<br />
Hudson (1993), human capital is a comb<strong>in</strong>ation of genetic <strong>in</strong>heritance, education,<br />
experience and attitudes about life and bus<strong>in</strong>ess. Lynn (1998) measures human<br />
capital as the raw <strong>in</strong>telligence, skills and expertise of the human actors <strong>in</strong> the<br />
organizations, while Bontis (1998) def<strong>in</strong>es human capital as the organization’s<br />
members’ <strong>in</strong>dividual tacit knowledge. Tacit knowledge refers to skills that exist <strong>in</strong>side<br />
the employees but cannot be articulated, that are necessary for them to perform their<br />
functions. From the resource-based perspective, Wright (1994), as cited by Bontis<br />
(1998), argues that human capital helps susta<strong>in</strong> competitive advantage when<br />
employees “add value, be<strong>in</strong>g unique and rare, imperfectly imitable and not<br />
substitutable with another resource by compet<strong>in</strong>g firms”.<br />
3.2 Structural <strong>Capital</strong><br />
Bollen, Vergauwen and Schnieders (2005) identify structural capital as mechanisms<br />
and structures, which help to support employees. It comprises all non-human<br />
storehouses of knowledge <strong>in</strong> organizations <strong>in</strong>clud<strong>in</strong>g the databases, organizational<br />
charts, process manuals, strategies, rout<strong>in</strong>es and anyth<strong>in</strong>g whose value to the<br />
company is higher than its material value. Roos and Roos (1997) describe structural<br />
capital as what rema<strong>in</strong>s <strong>in</strong> the company when employees go home for the night. In<br />
contrast to human capital, structural capital can be owned by the organization and<br />
therefore can be traded. Bontis (1998) contends that the structural capital deals with<br />
the mechanisms and structures of the organization that can help support employees<br />
<strong>in</strong> their quest for optimum <strong>in</strong>tellectual performance and therefore overall bus<strong>in</strong>ess<br />
performance. Accord<strong>in</strong>g to him, an <strong>in</strong>dividual can have a high level of <strong>in</strong>tellect, but if<br />
the organization has poor systems and procedures by which to track his or her<br />
actions, the overall <strong>in</strong>tellectual capital will not reach its fullest potential. An<br />
organization with strong structural capital will have a supportive culture that allows<br />
269
Salleh & Selamat<br />
<strong>in</strong>dividual to try th<strong>in</strong>gs, to fail, to learn and to try aga<strong>in</strong>. If the culture unduly penalizes<br />
failure, its success will be m<strong>in</strong>imal.<br />
3.3 Customer <strong>Capital</strong><br />
Customer capital is def<strong>in</strong>ed as the knowledge embedded <strong>in</strong> the market<strong>in</strong>g channels<br />
and customer relationships that an organization develops through the course of<br />
conduct<strong>in</strong>g bus<strong>in</strong>ess (Bontis, 1998). In a more recent study, Bontis (2001) have<br />
broadened the category to <strong>in</strong>clude relational capital which <strong>in</strong> effect encompasses the<br />
knowledge embedded <strong>in</strong> all the relationships an organization develops whether it<br />
<strong>in</strong>volves the customers, competitors, suppliers, trade associations or the<br />
government. Yet another researcher, Belkaoui (2003) refers to customer capital as<br />
the firms’ value of its franchise, its ongo<strong>in</strong>g relationships with the people or<br />
organizations to which it sells like market share, customer retention and defection<br />
rates; and per customer profitability.<br />
4. Research Methods<br />
The study is premised on the practice of <strong>in</strong>tellectual capital management as<br />
conceptualized and described <strong>in</strong> Fig.1 and several pert<strong>in</strong>ent characteristics of<br />
bus<strong>in</strong>ess firms. The data for this study is obta<strong>in</strong>ed through survey questionnaire.<br />
Cross-sectional data of respondents from <strong>Malaysian</strong> services and manufactur<strong>in</strong>g<br />
<strong>in</strong>dustries is subjected to quantitative analysis to describe the practice of <strong>in</strong>tellectual<br />
capital management. The sampl<strong>in</strong>g frame for this study was drawn from 449<br />
organizations listed on the ma<strong>in</strong> board of Bursa Malaysia (<strong>Malaysian</strong> Bourse) under<br />
Consumer Products, Industrial Products, Trad<strong>in</strong>g/Services, F<strong>in</strong>ance and Technology<br />
counters. Sample organizations were selected based on available <strong>in</strong>formation of<br />
contact persons and e-mail/mail addresses (of organizations’ top management team)<br />
obta<strong>in</strong>ed from the companies’ annual reports <strong>in</strong> Bursa Malaysia. Subsequently, 200<br />
survey questionnaires were mailed/e-mailed to respondents whose positions ranged<br />
from General Managers to Manag<strong>in</strong>g Directors.<br />
This study formulates several tentative Hypothesiss that purport to describe the<br />
differences <strong>in</strong> the degree to which <strong>Malaysian</strong> firms <strong>in</strong> different <strong>in</strong>dustries, types and<br />
sizes acknowledge and adopt <strong>in</strong>tellectual capital <strong>in</strong> their bus<strong>in</strong>ess models.<br />
Theoretically, <strong>in</strong>tellectual capital is described as the difference between market value<br />
and book value of a firm (Edv<strong>in</strong>sson and Malone, 1997). Thus, it may be expected<br />
that the higher the gap between market and book value the higher the degree of<br />
adoption of <strong>in</strong>tellectual capital management. Marr (2005) states that <strong>in</strong>tellectual<br />
capital will <strong>in</strong>creas<strong>in</strong>gly become a major component of the total capital of firms as<br />
firms move from manufactur<strong>in</strong>g and <strong>in</strong>dustrial activities toward service and more<br />
knowledge-based activities. A study done by Juma and Pa<strong>in</strong>e (2004) found that<br />
organizational size plays a large role <strong>in</strong> <strong>in</strong>fluenc<strong>in</strong>g the level of <strong>in</strong>tellectual capital <strong>in</strong><br />
an organization.<br />
Specific characteristics of <strong>Malaysian</strong> firms merit a closer look at possible<br />
relationships. The proliferation of foreign firms of different national orig<strong>in</strong>s <strong>in</strong> Malaysia<br />
justifies an assessment as to the possible differences <strong>in</strong> the practice of <strong>in</strong>tellectual<br />
270
Salleh & Selamat<br />
capital management between local and foreign-affiliated firms, and between foreign<br />
firms of different national orig<strong>in</strong>s. In the <strong>Malaysian</strong> context too, there is an acute<br />
<strong>in</strong>terest to discover potential differences between local firms of different types of<br />
ownership. Specifically, the answer may be sought as to the differences between<br />
government-led companies and the private firms, as well as between Bumiputraowned<br />
(generally Malay-owned) and non-Bumiputra companies.<br />
Several hypotheses can thus be formulated:<br />
Hypothesis 1: The degree of adoption of <strong>in</strong>tellectual capital management is higher<br />
among firms <strong>in</strong> services <strong>in</strong>dustry than firms <strong>in</strong> manufactur<strong>in</strong>g <strong>in</strong>dustry<br />
Hypothesis 2: The degree of adoption of <strong>in</strong>tellectual capital management is<br />
higher among foreign-affiliated firms than local firms<br />
Hypothesis 3: Among local firms, there are significant differences <strong>in</strong> the degree of<br />
adoption of <strong>in</strong>tellectual capital management between firms of different types of<br />
ownership<br />
Hypothesis 4: Among foreign-affiliated firms, there are significant differences <strong>in</strong> the<br />
degree of adoption of <strong>in</strong>tellectual capital management between firms of different<br />
national orig<strong>in</strong>s<br />
Hypothesis 5: There are significant differences <strong>in</strong> the degree of adoption of<br />
<strong>in</strong>tellectual capital management between firms of different sizes<br />
Hypothesis 6: The higher the gap between book value and market value, the higher<br />
the degree of adoption of <strong>in</strong>tellectual capital management<br />
This study adopts the <strong>in</strong>strument developed by Bontis (1998). The multi-item<br />
<strong>in</strong>strument uses 5-po<strong>in</strong>t Likert scale and comprises statements that measure the 3<br />
dimensions of <strong>in</strong>tellectual capital: Human <strong>Capital</strong> (HC), Structural <strong>Capital</strong> (SC) and<br />
Customer <strong>Capital</strong> (CC). Altogether, there are 52 statements (19 to measure HC, 16<br />
to measure SC and 17 to measure CC). These measures have been proven to be<br />
valid and reliable. Nevertheless, some of the statements have been modified to suit<br />
the <strong>Malaysian</strong> bus<strong>in</strong>ess environment and culture.<br />
5. Results<br />
5.1 Sample Characteristics and Measure of Scale Reliabilities<br />
From a total of 200 questionnaires sent to sample organizations, data from 62<br />
respondents were usable. The respondents of the survey were those whose<br />
positions range from Manager to Executive Director with 3 to 31 years of work<strong>in</strong>g<br />
experience <strong>in</strong> the respond<strong>in</strong>g organizations. The profiles of the respond<strong>in</strong>g<br />
organizations are shown <strong>in</strong> Table 1. Table 2 summarizes scale items and measure<br />
of scale reliabilities.<br />
271
Salleh & Selamat<br />
Table 1: Profiles of Respond<strong>in</strong>g Organizations<br />
Frequency<br />
Percent<br />
Industry<br />
Services<br />
Manufactur<strong>in</strong>g<br />
Total<br />
Organization Type<br />
Local-based company:<br />
Bumiputra-controlled<br />
Non-bumiputra controlled<br />
Government-l<strong>in</strong>ked company<br />
Others<br />
Sub-Total<br />
Foreign-affiliated company:<br />
Japanese<br />
European<br />
USA<br />
Others<br />
Sub-Total<br />
Total<br />
Size: Book Value<br />
RM60 million - RM250 million<br />
RM251 million – RM500 million<br />
RM501 million – RM1,000 million<br />
> RM1,000 million<br />
Total<br />
Market Value m<strong>in</strong>us Book Value<br />
Positive Gap<br />
Negative Gap<br />
Total<br />
39<br />
23<br />
62<br />
17<br />
20<br />
15<br />
0<br />
52<br />
4<br />
4<br />
0<br />
2<br />
10<br />
62<br />
21<br />
10<br />
24<br />
7<br />
62<br />
56<br />
6<br />
62<br />
62.9<br />
37.1<br />
100.0<br />
27.4<br />
32.2<br />
24.2<br />
0.0<br />
83.8<br />
6.5<br />
6.5<br />
0.0<br />
3.2<br />
16.2<br />
100.0<br />
33.9<br />
16.1<br />
38.7<br />
11.3<br />
100.0<br />
90.3<br />
9.7<br />
100.0<br />
272
Salleh & Selamat<br />
Table 2: Summary of Items and Measure of Reliabilities<br />
Variables No. of Items Cronbach’s<br />
Alpha<br />
Human <strong>Capital</strong><br />
Structural <strong>Capital</strong><br />
Customer <strong>Capital</strong><br />
19<br />
16<br />
17<br />
0.9113<br />
0.8693<br />
0.9118<br />
5.2 Organizational Profiles and <strong>Intellectual</strong> <strong>Capital</strong><br />
Table 3 shows the mean scores and the standard deviations for human capital,<br />
structural capital, and customer capital.<br />
Table 3: Mean Score and Standard Deviation of Variables<br />
Variables<br />
Human <strong>Capital</strong><br />
Structural <strong>Capital</strong><br />
Customer <strong>Capital</strong><br />
Mean<br />
3.71<br />
3.62<br />
3.83<br />
Standard<br />
Deviation<br />
0.40<br />
0.40<br />
0.39<br />
<strong>Intellectual</strong> <strong>Capital</strong> 3.72 0.40<br />
One-way ANOVA tests performed to analyze differences <strong>in</strong> the degree to which firms<br />
<strong>in</strong> different categories acknowledge and adopt <strong>in</strong>tellectual capital management <strong>in</strong><br />
their bus<strong>in</strong>ess models, give the results as summarised <strong>in</strong> Table 4.<br />
5.2.1 Industry and <strong>Intellectual</strong> <strong>Capital</strong><br />
The test result shows that there are no significant differences <strong>in</strong> the mean scores for<br />
each category of <strong>in</strong>dependent variables (human capital, structural capital and<br />
customer capital) between the 2 types of <strong>in</strong>dustries; services and manufactur<strong>in</strong>g<br />
<strong>in</strong>dustries.<br />
5.2.2. Organization Type and <strong>Intellectual</strong> <strong>Capital</strong><br />
There are no significant differences <strong>in</strong> the mean scores for each category of<br />
<strong>in</strong>dependent variables (human capital, structural capital and customer capital)<br />
between local-based companies and foreign-affiliated companies.<br />
However, comparison among different categories of local-based companies<br />
<strong>in</strong>dicates significant differences <strong>in</strong> the mean scores of the 3 components of<br />
273
Salleh & Selamat<br />
<strong>in</strong>tellectual capital. It shows a statistical difference <strong>in</strong> the distribution of <strong>in</strong>tellectual<br />
capital adoption <strong>in</strong> the organizations bus<strong>in</strong>ess models across Bumiputra-controlled,<br />
non-Bumiputra controlled and government-l<strong>in</strong>ked companies. <strong>Intellectual</strong> capital is<br />
perceived to be highest <strong>in</strong> the non-Bumiputra controlled companies. They have the<br />
highest mean score <strong>in</strong> the human capital (3.987), structural capital (3.863) and<br />
customer capital (3.959) compared to Bumiputra-controlled companies and<br />
government-l<strong>in</strong>ked companies.<br />
Among different categories of foreign-affiliated companies, there is statistical<br />
difference between Japanese-affiliated, European-affiliated and other foreignaffiliated<br />
companies. Human capital was highest <strong>in</strong> the European-affiliated<br />
companies (3.763) compared to Japanese-affiliated (3.079) and others (3.637).<br />
However, structural and customer capital were highest <strong>in</strong> other foreign affiliatedcompanies<br />
(<strong>in</strong> this case were S<strong>in</strong>gapore-affiliated companies (3.875 and 4.059<br />
respectively).<br />
5.2.3 Organization Size and <strong>Intellectual</strong> <strong>Capital</strong><br />
The one-way ANOVA result shows that there are no significant differences <strong>in</strong> the<br />
mean scores of human capital, structural capital and customer capital variables<br />
among organizations of different sizes as measured by book-value.<br />
5.2.4 Market - Book Value Gap and <strong>Intellectual</strong> <strong>Capital</strong><br />
The test result shows that there are significant differences <strong>in</strong> the mean scores of the<br />
3 variables (human capital, structural capital and customer capital) between the<br />
companies with positive gap (of market value and book value) and companies with<br />
negative gap. Based on the mean scores, <strong>in</strong>tellectual capital was higher <strong>in</strong><br />
companies with positive gap of market value and book value.<br />
274
Salleh & Selamat<br />
Table 4: Adoption of <strong>Intellectual</strong> <strong>Capital</strong> by Organization Profiles<br />
Variables<br />
(1) Industry Type<br />
Services<br />
Manufactur<strong>in</strong>g<br />
F-value<br />
p-<br />
value<br />
Human<br />
<strong>Capital</strong><br />
Structural<br />
<strong>Capital</strong><br />
Customer<br />
<strong>Capital</strong><br />
Variables<br />
Human<br />
<strong>Capital</strong><br />
Structural<br />
<strong>Capital</strong><br />
Customer<br />
<strong>Capital</strong><br />
Variables<br />
Human<br />
<strong>Capital</strong><br />
Structural<br />
<strong>Capital</strong><br />
Customer<br />
<strong>Capital</strong><br />
Mean Std Dev Mean Std Dev<br />
3.780 .296 3.588 .517 3.474 .067<br />
3.660 .379 3.541 .421 1.325 .254<br />
3.815 .332 3.862 .479 .212 .647<br />
(2) Organization Type<br />
Local-based<br />
Foreign-affiliated<br />
Mean Std Dev Mean Std Dev<br />
F-value<br />
p-<br />
value<br />
3.752 .391 3.484 .384 3.950 .054<br />
3.635 .414 3.519 .280 .715 .401<br />
3.822 .422 3.882 .130 .196 .659<br />
(2a) Categories with<strong>in</strong> Local-based Companies<br />
Bumiputra<br />
Mean<br />
Std<br />
Dev<br />
Non-<br />
Bumiputra<br />
Std<br />
Mean<br />
Dev<br />
Governmentl<strong>in</strong>ked<br />
Std<br />
Mean<br />
Dev<br />
F-value<br />
p-<br />
value<br />
3.789 .200 3.987 .278 3.414 .484 10.947** .000<br />
3.728 .436 3.863 .381 3.358 .308 5.571** .007<br />
3.827 .405 3.959 .411 3.522 .307 6.566** .003<br />
** Significant at<br />
p
Salleh & Selamat<br />
Variables<br />
Human<br />
<strong>Capital</strong><br />
Structural<br />
<strong>Capital</strong><br />
Customer<br />
<strong>Capital</strong><br />
Variables<br />
Human<br />
<strong>Capital</strong><br />
Structural<br />
<strong>Capital</strong><br />
Customer<br />
<strong>Capital</strong><br />
Variables<br />
Human<br />
<strong>Capital</strong><br />
Structural<br />
<strong>Capital</strong><br />
Customer<br />
<strong>Capital</strong><br />
(2b) Categories with<strong>in</strong> Foreign-affiliated Companies<br />
Japanese European Others<br />
Std<br />
Std<br />
Mean<br />
Mean<br />
Mean<br />
Dev<br />
Dev<br />
Std<br />
Dev<br />
F-value<br />
p-<br />
value<br />
3.079 .273 3.763 .053 3.637 .000 16.483** .002<br />
3.219 .036 3.641 .094 3.875 .000 77.835** .000<br />
3.794 .034 3.882 .136 4.059 .000 5.559** .036<br />
(3) Size: Book Value<br />
RM60m - RM251m -<br />
RM250m RM500m<br />
Mean Std<br />
Dev<br />
Mean Std<br />
Dev<br />
RM501m –<br />
RM1,000m<br />
Mean<br />
Std<br />
Dev<br />
>RM1,000m<br />
Mean<br />
Std<br />
Dev<br />
F-value<br />
p-<br />
value<br />
3.554 .434 3.790 .532 3.782 .429 3.832 .255 2.018 .104<br />
3.477 .367 3.766 .366 3.682 .252 3.742 .473 1.757 .150<br />
3.717 .370 4.147 .442 3.770 .225 3.886 .426 2.165 .084<br />
(4) Market Value m<strong>in</strong>us Book Value<br />
Positive Gap<br />
Negative Gap<br />
Mean Std Dev Mean Std Dev<br />
F-value<br />
p-<br />
value<br />
3.741 .419 3.542 .227 7.114** .004<br />
3.679 .386 3.288 .270 9.325** .003<br />
3.899 .374 3.482 .269 11.227** .001<br />
** Significant at p
Salleh & Selamat<br />
Bumiputra controlled companies are found to have highest adoption of <strong>in</strong>tellectual<br />
capital followed by Bumiputra-controlled and government-l<strong>in</strong>ked companies. For<br />
foreign-affiliated companies, European-affiliated companies tend to adopt higher<br />
human capital and S<strong>in</strong>gapore-affiliated companies tend to adopt higher structural<br />
and customer capital than their Japanese counterparts. The results also show that<br />
companies with positive gap, as opposed to those with negative gap, tend to be<br />
higher <strong>in</strong> the degree of adoption of <strong>in</strong>tellectual capital. Generally, the f<strong>in</strong>d<strong>in</strong>gs of this<br />
study suggest that bus<strong>in</strong>ess firms <strong>in</strong> Malaysia do practice <strong>in</strong>tellectual capital<br />
management. This is particularly encourag<strong>in</strong>g <strong>in</strong> the light of <strong>Malaysian</strong> government’s<br />
effort to build <strong>in</strong>tellectual capital <strong>in</strong> Malaysia.<br />
References<br />
Belkaoui, A.R. 2003. “<strong>Intellectual</strong> <strong>Capital</strong> and Firm Performance of US Mult<strong>in</strong>ational<br />
Firms”, Journal of <strong>Intellectual</strong> <strong>Capital</strong>, 4, 2, pp 215-226<br />
Bollen, L., Vergauwen, P. and Schnieders, S. 2005. “L<strong>in</strong>k<strong>in</strong>g <strong>Intellectual</strong> <strong>Capital</strong> and<br />
<strong>Intellectual</strong> Property to Company Performance”, <strong>Management</strong> Decision, 43, 9, pp<br />
1161-1185<br />
Bontis, N. 1998. “<strong>Intellectual</strong> <strong>Capital</strong>: An Exploratory Study that Develops Measures<br />
and Models”, <strong>Management</strong> Decision, 36, 2, pp 63-76<br />
Bontis, N. 2001. “Assess<strong>in</strong>g Knowledge Assets: A Review of the Models Used to<br />
Measure <strong>Intellectual</strong> <strong>Capital</strong>”, International Journal of <strong>Management</strong> Review, 3, 1, pp<br />
41-60<br />
Brook<strong>in</strong>g, A. 1996. <strong>Intellectual</strong> <strong>Capital</strong>: Core Assets for Third Millennium,<br />
International Thomson Bus<strong>in</strong>ess Press: London<br />
Brook<strong>in</strong>g, A. 1997. “The <strong>Management</strong> of <strong>Intellectual</strong> <strong>Capital</strong>”, Long Range Plann<strong>in</strong>g,<br />
30, 3, pp 364-365<br />
Department of Statistics Malaysia. 2005. Available at www.statistics.gov.my<br />
Drucker, P. 1995. “The Information Executives Truly Need”, Harvard Bus<strong>in</strong>ess<br />
Review, January-February, pp 54-62<br />
Economic Plann<strong>in</strong>g Unit. 2001. The Third Outl<strong>in</strong>e Perspective Plan (2001-2010),<br />
Prime M<strong>in</strong>ister’s Department, Putrajaya, Malaysia<br />
Edv<strong>in</strong>sson, L. 1997. “Develop<strong>in</strong>g <strong>Intellectual</strong> <strong>Capital</strong> at Skandia”, Long Range<br />
Plann<strong>in</strong>g, 20, 3, pp 366-373<br />
Edv<strong>in</strong>sson, L. and Malone, M. 1997. “<strong>Intellectual</strong> <strong>Capital</strong>: Realiz<strong>in</strong>g Your Company’s<br />
True Value by F<strong>in</strong>d<strong>in</strong>g Its Hidden Bra<strong>in</strong>power”, Harper Bus<strong>in</strong>ess, New York<br />
Hudson, W. 1993. <strong>Intellectual</strong> <strong>Capital</strong>: How to Build It, Enhance It, Use It, John Wiley<br />
& Sons: New York<br />
277
Salleh & Selamat<br />
ISIS. 2002. Knowledge-Based Economy Master Plan, Institute of Strategic and<br />
International Studies, Kuala Lumpur, Malaysia<br />
Itami, H. 1987. Mobiliz<strong>in</strong>g Invisible Assets, Harvard University Press: London<br />
Juma, N. and Payne, G.T. 2004. “<strong>Intellectual</strong> <strong>Capital</strong> and Performance of New<br />
Venture High-Tech Firms”, International Journal of Innovation <strong>Management</strong>, 8, 3, pp<br />
297-318<br />
Kaplan, R.S. and Norton, D.P. 2004. “Strategy Maps: Convert<strong>in</strong>g Intangible Assets<br />
<strong>in</strong>to Tangible Outcomes”, Harvard Bus<strong>in</strong>ess School Press, Boston, MA<br />
Leana, D.R. and Van Buren, H.J. 1999. “Organizational Social <strong>Capital</strong> and<br />
Employment Practices”, Academy of <strong>Management</strong> Review, 24, 2, pp 538-555<br />
Lev, B. 2001. Intangibles: <strong>Management</strong> and Report<strong>in</strong>g, Brook<strong>in</strong>gs Institution Press,<br />
Wash<strong>in</strong>gton DC<br />
Lowell, L.B. 1997. “Stocks Overvalued? Not <strong>in</strong> the New Economy”, The Wall Street<br />
Journal, pp A24<br />
Lynn, B.E. 1998. “Performance Evaluation <strong>in</strong> the New Economy: Br<strong>in</strong>g<strong>in</strong>g the<br />
Measurement and Evaluation of <strong>Intellectual</strong> <strong>Capital</strong> <strong>in</strong>to the <strong>Management</strong> Plann<strong>in</strong>g<br />
and Control System”, International Journal of Technology <strong>Management</strong>, 16, 1<br />
Marr, B. 2005. Perspective on <strong>Intellectual</strong> <strong>Capital</strong>: Multidiscipl<strong>in</strong>ary Insights <strong>in</strong>to<br />
<strong>Management</strong>, Measurement and Report<strong>in</strong>g, Elsevier Butterworth- He<strong>in</strong>emann<br />
Naquiyudd<strong>in</strong>, T.N.C.P. and Heong, L.H. 1992. <strong>Malaysian</strong> Entrepreneurs, <strong>Malaysian</strong><br />
Institute of <strong>Management</strong>, Kuala Lumpur<br />
Perez, J.R. and de Pablos, P.O. 2003 “Knowledge <strong>Management</strong> and Organizational<br />
Competitiveness: A Framework for Human <strong>Capital</strong> Analysis”, Journal of Knowledge<br />
<strong>Management</strong>, 7, 3, pp 82-91<br />
Roos, G. and Roos, J. 1997. “Measur<strong>in</strong>g Your Company’s <strong>Intellectual</strong> Performance”,<br />
Long Range Plann<strong>in</strong>g, 30, 3, pp 413-426.<br />
Stewart, T.A. 1997. <strong>Intellectual</strong> <strong>Capital</strong>: The New Wealth of Organizations,<br />
Doubleday Dell Publish<strong>in</strong>g Group: New York.<br />
Sveiby, K.E. 1997. The New Organizational Wealth: Manag<strong>in</strong>g and Measur<strong>in</strong>g<br />
Knowledge-Based Assets, Berret-Koehler Publishers, Inc: San Francisco.<br />
Wernefelt, B. 1984. “A Resource-Based View of the Firm”, Strategic <strong>Management</strong><br />
Journal, 5, 2, pp 171-180.<br />
278