2010 Competitiveness Report - Export-Import Bank of the United ...
2010 Competitiveness Report - Export-Import Bank of the United ...
2010 Competitiveness Report - Export-Import Bank of the United ...

Create successful ePaper yourself
Turn your PDF publications into a flip-book with our unique Google optimized e-Paper software.
Chapter 4: Major Program Structures<br />
Section B: Project Finance<br />
Introduction<br />
Project Finance (PF) is defined as <strong>the</strong> financing <strong>of</strong> projects whose creditworthiness<br />
depends on <strong>the</strong> project’s cash flow for repayment. With such a structure, <strong>the</strong> lender<br />
cannot access <strong>the</strong> assets or revenue <strong>of</strong> <strong>the</strong> project sponsor to repay <strong>the</strong> debt and only has<br />
recourse to <strong>the</strong> assets and revenue generated by <strong>the</strong> borrower (i.e. <strong>the</strong> project being<br />
financed). PF structures usually cover large, long-term infrastructure and industrial<br />
projects.<br />
In <strong>2010</strong>, total global PF debt issuances again declined to $188 billion after suffering a<br />
decline in 2009 as a result <strong>of</strong> <strong>the</strong> 2008 financial crisis. The fur<strong>the</strong>r decline in global PF<br />
activity in <strong>2010</strong> can be attributed to <strong>the</strong> 1-2 year lagging effect <strong>the</strong> 2008 financial crisis<br />
had on <strong>the</strong> suppliers <strong>of</strong> large projects within <strong>the</strong> industry. The major ECAs supported 25<br />
project finance deals in <strong>2010</strong>, signifying an increase from <strong>the</strong> 2009 figure <strong>of</strong> 21 total<br />
ECA supported PF deals. However, preliminary information indicates <strong>the</strong> total dollar<br />
amount <strong>of</strong> <strong>2010</strong> ECA-supported PF transactions was only roughly $10.2 billion, a<br />
decrease from <strong>the</strong> $11.1 billion portfolio <strong>of</strong> PF business that received ECA support in<br />
2009.<br />
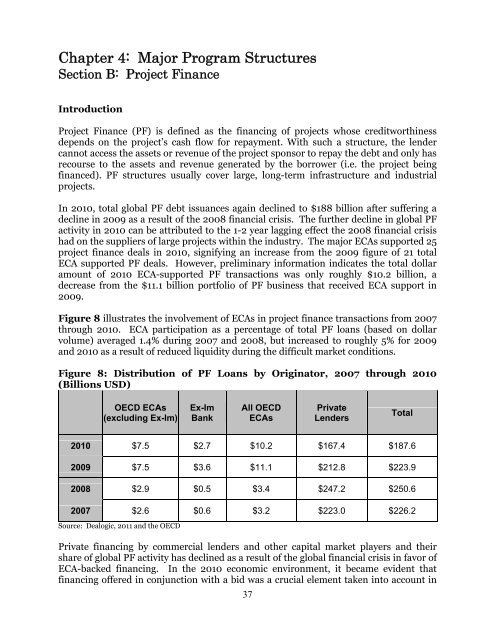
Figure 8 illustrates <strong>the</strong> involvement <strong>of</strong> ECAs in project finance transactions from 2007<br />
through <strong>2010</strong>. ECA participation as a percentage <strong>of</strong> total PF loans (based on dollar<br />
volume) averaged 1.4% during 2007 and 2008, but increased to roughly 5% for 2009<br />
and <strong>2010</strong> as a result <strong>of</strong> reduced liquidity during <strong>the</strong> difficult market conditions.<br />
Figure 8: Distribution <strong>of</strong> PF Loans by Originator, 2007 through <strong>2010</strong><br />
(Billions USD)<br />
OECD ECAs<br />
(excluding Ex-Im)<br />
Ex-Im<br />
<strong>Bank</strong><br />
All OECD<br />
ECAs<br />
Private<br />
Lenders<br />
Total<br />
<strong>2010</strong> $7.5 $2.7 $10.2 $167.4 $187.6<br />
2009 $7.5 $3.6 $11.1 $212.8 $223.9<br />
2008 $2.9 $0.5 $3.4 $247.2 $250.6<br />
2007 $2.6 $0.6 $3.2 $223.0 $226.2<br />
Source: Dealogic, 2011 and <strong>the</strong> OECD<br />
Private financing by commercial lenders and o<strong>the</strong>r capital market players and <strong>the</strong>ir<br />
share <strong>of</strong> global PF activity has declined as a result <strong>of</strong> <strong>the</strong> global financial crisis in favor <strong>of</strong><br />
ECA-backed financing. In <strong>the</strong> <strong>2010</strong> economic environment, it became evident that<br />
financing <strong>of</strong>fered in conjunction with a bid was a crucial element taken into account in<br />
37