Student Activity 4: Height versus Arm Span
Student Activity 4: Height versus Arm Span
Student Activity 4: Height versus Arm Span

You also want an ePaper? Increase the reach of your titles
YUMPU automatically turns print PDFs into web optimized ePapers that Google loves.
II. Linear Functions 2.1 Out for a Stretch: <strong>Student</strong> <strong>Activity</strong> 4<br />
<strong>Student</strong> <strong>Activity</strong> 4: <strong>Height</strong> <strong>versus</strong> <strong>Arm</strong> <strong>Span</strong><br />
Overview:<br />
Objective:<br />
Terms:<br />
Materials:<br />
<strong>Student</strong>s investigate the relationship between the height of person and the<br />
person’s arm span.<br />
Algebra I TEKS<br />
(b.1.B) The student gathers and records data, or uses data sets, to determine<br />
functional (systematic) relationships between quantities.<br />
(b.1.E) The student interprets and makes inferences from functional<br />
relationships.<br />
(c.1.A) The student determines whether or not given situations can be<br />
represented by linear functions.<br />
(c.1.C) The student translates among and uses algebraic, tabular, graphical, or<br />
verbal descriptions of linear functions.<br />
(c.2.B) The student interprets the meaning of slope and intercepts in<br />
situations using data, symbolic representations, or graphs.<br />
(b.2.D) In solving problems, the student collects and organizes data, makes and<br />
interprets scatter plots and models, predicts, and makes decisions and critical<br />
judgments.<br />
(c.2.G) The student relates direct variation to linear functions and solve problems<br />
involving proportional change.<br />
rate, slope, arm span, proportional relationship<br />
metric measuring tape or meter stick(s), graphing calculators<br />
Procedures: <strong>Student</strong>s should be seated at tables in groups of 3 – 4.<br />
<strong>Activity</strong>: <strong>Height</strong> <strong>versus</strong> <strong>Arm</strong> <strong>Span</strong><br />
Briefly describe and/or demonstrate the experiment.<br />
1. Stress how important it is for students to predict the results of the<br />
experiment before they perform the experiment. Encourage students to<br />
think about and anticipate the results of the experiment before they begin<br />
collecting data.<br />
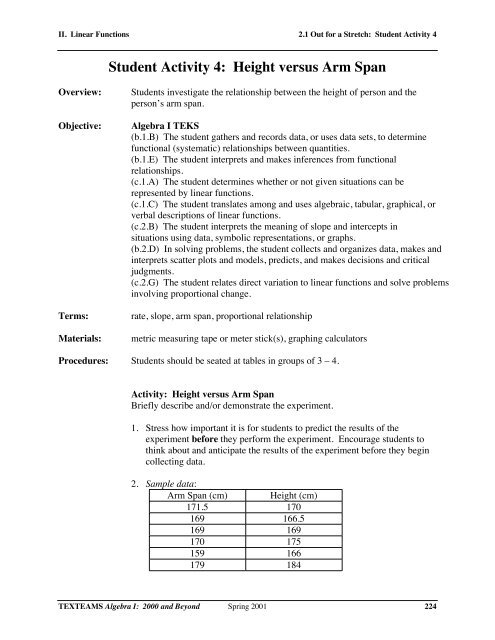
2. Sample data:<br />
<strong>Arm</strong> <strong>Span</strong> (cm) <strong>Height</strong> (cm)<br />
171.5 170<br />
169 166.5<br />
169 169<br />
170 175<br />
159 166<br />
179 184<br />
TEXTEAMS Algebra I: 2000 and Beyond Spring 2001 224
II. Linear Functions 2.1 Out for a Stretch: <strong>Student</strong> <strong>Activity</strong> 4<br />
3. Sample data:<br />
4. For our sample data, an estimated rate of change is 1 centimeters per 1<br />
centimeter.<br />
5. For our sample data, we could reason that the y-intercept is the theoretical<br />
height of a person with no arm span, therefore the y-intercept is zero.<br />
6. For our sample data, a trend line is y = 0+<br />
1 x.<br />
7.<br />
8. The units of slope are centimeters of height per centimeters of arm span.<br />
Since the units (centimeters) are the same,<br />
cm<br />
= 1 and therefore, the slope is this case is dimensionless. To illustrate,<br />
cm<br />
consider if the measurements would have been made in inches, feet,<br />
cubits, or pencil lengths. The units of slope would be the same,<br />
unit of measure<br />
unit of measure = 1.<br />
9. The real world meaning of the y-intercept is that for a theoretical person<br />
with no arm span, the person would have no height.<br />
10. y = 1( 137)=<br />
137. <strong>Student</strong>s could solve using a table, tracing on the graph,<br />
and evaluating on the home screen. See the other student activities for<br />
examples of solution methods.<br />
11. 1x = 214. <strong>Student</strong>s could solve using a table where y = x, using a table<br />
where y = x and y = 214, tracing on the graph, finding the intersection of<br />
y = x and y = 214, and using guess and check on the home screen. See<br />
the other student activities for examples of solution methods.<br />
12. The longer your arm span is, the taller you are.<br />
13. Neither variable is the independent or dependent variable. There is not a<br />
dependent relationship inherent in this situation. The two relationships<br />
(arm span, height) and (height, arm span) are inverse relations.<br />
14. The ratios should be somewhat constant and approximately equal to 1.<br />
15. The average of the ratio y should be very close to the slope of the trend<br />
x<br />
line, approximately 1.<br />
16. If y x<br />
= k , then k is the constant of proportionality.<br />
TEXTEAMS Algebra I: 2000 and Beyond Spring 2001 225
II. Linear Functions 2.1 Out for a Stretch: <strong>Student</strong> <strong>Activity</strong> 4<br />
Answers to Sample Assessment:<br />
1 – 2. The points in the scatter plot for Group A all lie below the line y = x.<br />
This means the people measured by Group A have longer arm spans than<br />
their heights. However, the points in the scatter plot for Group B all lie<br />
above the line y = x. This means the people measured by Group B are<br />
taller than their arm spans.<br />
Also, noting the different windows, the points in the scatter plot for Group<br />
A must have generally higher coordinates than those for Group B. The<br />
folks measured by A are taller than those measured by Group B.<br />
3. The points should have relatively high coordinates and lie below the line<br />
y = x.<br />
Summary:<br />
By collecting data and finding a trend line, students investigate the<br />
relationship between the height of a person and the person’s arm span.<br />
<strong>Student</strong>s use real data to further their conceptualization of the linear function,<br />
specifically of the form y = mx, a proportional relation.<br />
TEXTEAMS Algebra I: 2000 and Beyond Spring 2001 226
II. Linear Functions 2.1 Out for a Stretch: <strong>Student</strong> <strong>Activity</strong> 4<br />
<strong>Student</strong> <strong>Activity</strong> 4: <strong>Height</strong> <strong>versus</strong> <strong>Arm</strong> <strong>Span</strong><br />
What is the relationship between the height of a person and the length<br />
of the person’s arm span?<br />
Measure the height and arm span of students.<br />
1. Sketch a graph predicting the relationship between the height<br />
of the person and the person’s arm span:<br />
TEXTEAMS Algebra I: 2000 and Beyond Spring 2001 227
II. Linear Functions 2.1 Out for a Stretch: <strong>Student</strong> <strong>Activity</strong> 4<br />
2. Data Collection<br />
<strong>Arm</strong> <strong>Span</strong><br />
(cm)<br />
<strong>Height</strong><br />
(cm)<br />
3. Make a scatter plot using a graphing calculator. Sketch below.<br />
TEXTEAMS Algebra I: 2000 and Beyond Spring 2001 228
II. Linear Functions 2.1 Out for a Stretch: <strong>Student</strong> <strong>Activity</strong> 4<br />
4. Use first differences to estimate a rate of change.<br />
5. Estimate the y-intercept (starting point.)<br />
6. Find a trend line for the data using the estimated rate and y-<br />
intercept.<br />
7. Graph your trend line over the scatter plot and adjust the<br />
parameters y-intercept and rate of change, if necessary, for<br />
a better fit.<br />
8. What are the units of slope for the trend line?<br />
9. What is the meaning of the y-intercept in the trend line?<br />
10. Use the trend line to determine how tall a person is with an<br />
arm span of 137 cm. Write an equation and solve in at least<br />
three ways.<br />
TEXTEAMS Algebra I: 2000 and Beyond Spring 2001 229
II. Linear Functions 2.1 Out for a Stretch: <strong>Student</strong> <strong>Activity</strong> 4<br />
11 . Use your trend line to determine what arm span a 214 cm<br />
tall person would have? Write an equation and solve in at<br />
least four ways.<br />
12. Make a general statement about the relationship between the<br />
height of a person and the person’s arm span.<br />
13. Which is the independent variable and which is the<br />
dependent variable in this problem situation?<br />
A linear relationship that contains the origin is called a<br />
proportional relationship and is in the form y= mx.<br />
14. In the table, find the average of the ratios, y x .<br />
15. Compare the average ratio y above to the slope in your<br />
x<br />
trend line. What do you find?<br />
16. If y x<br />
= k, what is k called?<br />
TEXTEAMS Algebra I: 2000 and Beyond Spring 2001 230
II. Linear Functions 2.1 Out for a Stretch: <strong>Student</strong> <strong>Activity</strong> 4<br />
Sample Assessment<br />
Two groups collected data for height <strong>versus</strong> arm span. Their<br />
scatter plots in relation to the line y= x are shown below.<br />
Group A<br />
Group B<br />
1. Name one difference between the people measured by Group<br />
A and the people measured by Group B.<br />
2. Name another difference between the people measured by<br />
Group A and the people measured by Group B.<br />
3. What would a graph look like of mostly tall people whose<br />
arm spans tended to be greater than their heights? Sketch the<br />
graph and include the line y= x.<br />
TEXTEAMS Algebra I: 2000 and Beyond Spring 2001 231