Are Small Community Water Systems More at Risk than Other ...
Are Small Community Water Systems More at Risk than Other ...
Are Small Community Water Systems More at Risk than Other ...

You also want an ePaper? Increase the reach of your titles
YUMPU automatically turns print PDFs into web optimized ePapers that Google loves.
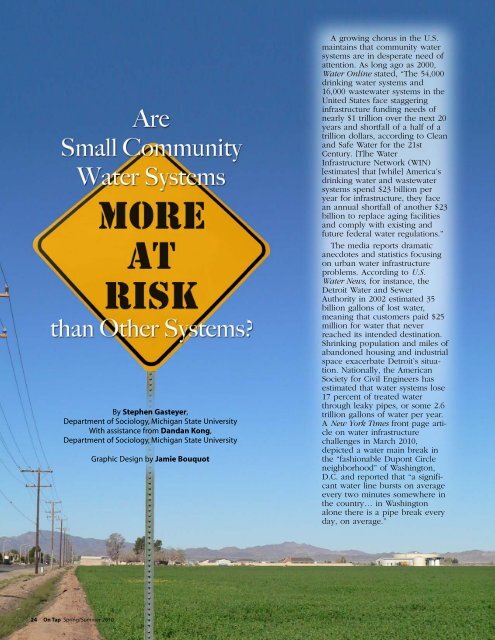
<strong>Are</strong> <strong>Small</strong> <strong>Community</strong><br />
<strong>W<strong>at</strong>er</strong> <strong>Systems</strong> <strong>More</strong><br />
<strong>at</strong> <strong>Risk</strong> <strong>than</strong> <strong>Other</strong><br />
<strong>Systems</strong>?<br />
By Stephen Gasteyer,<br />
Department of Sociology, Michigan St<strong>at</strong>e University<br />
With assistance from Dandan Kong,<br />
Department of Sociology, Michigan St<strong>at</strong>e University<br />
Graphic Design by Jamie Bouquot<br />
A growing chorus in the U.S.<br />
maintains th<strong>at</strong> community w<strong>at</strong>er<br />
systems are in desper<strong>at</strong>e need of<br />
<strong>at</strong>tention. As long ago as 2000,<br />
<strong>W<strong>at</strong>er</strong> Online st<strong>at</strong>ed, “The 54,000<br />
drinking w<strong>at</strong>er systems and<br />
16,000 wastew<strong>at</strong>er systems in the<br />
United St<strong>at</strong>es face staggering<br />
infrastructure funding needs of<br />
nearly $1 trillion over the next 20<br />
years and shortfall of a half of a<br />
trillion dollars, according to Clean<br />
and Safe <strong>W<strong>at</strong>er</strong> for the 21st<br />
Century. [T]he <strong>W<strong>at</strong>er</strong><br />
Infrastructure Network (WIN)<br />
[estim<strong>at</strong>es] th<strong>at</strong> [while] America’s<br />
drinking w<strong>at</strong>er and wastew<strong>at</strong>er<br />
systems spend $23 billion per<br />
year for infrastructure, they face<br />
an annual shortfall of another $23<br />
billion to replace aging facilities<br />
and comply with existing and<br />
future federal w<strong>at</strong>er regul<strong>at</strong>ions.”<br />
The media reports dram<strong>at</strong>ic<br />
anecdotes and st<strong>at</strong>istics focusing<br />
on urban w<strong>at</strong>er infrastructure<br />
problems. According to U.S.<br />
<strong>W<strong>at</strong>er</strong> News, for instance, the<br />
Detroit <strong>W<strong>at</strong>er</strong> and Sewer<br />
Authority in 2002 estim<strong>at</strong>ed 35<br />
billion gallons of lost w<strong>at</strong>er,<br />
meaning th<strong>at</strong> customers paid $25<br />
million for w<strong>at</strong>er th<strong>at</strong> never<br />
reached its intended destin<strong>at</strong>ion.<br />
Shrinking popul<strong>at</strong>ion and miles of<br />
abandoned housing and industrial<br />
space exacerb<strong>at</strong>e Detroit’s situ<strong>at</strong>ion.<br />
N<strong>at</strong>ionally, the American<br />
Society for Civil Engineers has<br />
estim<strong>at</strong>ed th<strong>at</strong> w<strong>at</strong>er systems lose<br />
17 percent of tre<strong>at</strong>ed w<strong>at</strong>er<br />
through leaky pipes, or some 2.6<br />
trillion gallons of w<strong>at</strong>er per year.<br />
A New York Times front page article<br />
on w<strong>at</strong>er infrastructure<br />
challenges in March 2010,<br />
depicted a w<strong>at</strong>er main break in<br />
the “fashionable Dupont Circle<br />
neighborhood” of Washington,<br />
D.C. and reported th<strong>at</strong> “a significant<br />
w<strong>at</strong>er line bursts on average<br />
every two minutes somewhere in<br />
the country… in Washington<br />
alone there is a pipe break every<br />
day, on average.”<br />
24 On Tap Spring/Summer 2010
<strong>Small</strong> <strong>Systems</strong> Also Face<br />
Challenges<br />
Infrastructure problems are not<br />
just big city problems. A w<strong>at</strong>er<br />
oper<strong>at</strong>or in a smaller Michigan<br />
community recently told me, “At<br />
this point we don’t even try to<br />
replace old pipes because there<br />
isn’t the money; we have our<br />
hands full just fixing the breaks.”<br />
<strong>Small</strong> community w<strong>at</strong>er systems<br />
may well be in more dire straits<br />
<strong>than</strong> larger systems. Discussions<br />
with small community w<strong>at</strong>er<br />
oper<strong>at</strong>ors and consultants point<br />
to several system<strong>at</strong>ic disadvantages<br />
and challenges. <strong>Small</strong><br />
systems lack the economies of<br />
scale of larger systems and thus<br />
are unable to cover the costs of<br />
tre<strong>at</strong>ment upgrades and infrastructure<br />
repairs and replacements<br />
through marginal r<strong>at</strong>e increases<br />
spread over many customers.<br />
Because of this, small community<br />
systems are more challenged<br />
in meeting maximum contaminant<br />
level requirements, such as the<br />
more stringent arsenic standards<br />
implemented in the last decade, or<br />
other regul<strong>at</strong>ory burdens. Beyond<br />
the number of r<strong>at</strong>e payers, small<br />
communities have fewer financial<br />
options. Low popul<strong>at</strong>ion is often<br />
accompanied by lack of commercial<br />
revenue streams for many<br />
small communities, meaning th<strong>at</strong><br />
they are unable to obtain good<br />
bond r<strong>at</strong>ings to finance w<strong>at</strong>er<br />
infrastructure projects.<br />
This situ<strong>at</strong>ion has deterior<strong>at</strong>ed<br />
in the last two decades with the<br />
steady decline of rural manufacturing.<br />
The dilapid<strong>at</strong>ed downtown<br />
has become iconic for small<br />
towns in many parts of the country.<br />
Those who work with small<br />
community systems note th<strong>at</strong><br />
small community w<strong>at</strong>er oper<strong>at</strong>ors<br />
are often underpaid, and lack the<br />
necessary skills to address new<br />
demands from regul<strong>at</strong>ory changes<br />
and emerging w<strong>at</strong>er tre<strong>at</strong>ment<br />
and distribution challenges.<br />
Further, small community w<strong>at</strong>er<br />
boards are often lambasted as<br />
lacking the interest and skills to<br />
properly manage their systems,<br />
and often simply try to minimize<br />
w<strong>at</strong>er r<strong>at</strong>es <strong>at</strong> the expense of<br />
long-term viability.<br />
Further, new industries th<strong>at</strong> are<br />
held out as a promise for revitaliz<strong>at</strong>ion<br />
of small communities,<br />
such as biofuel or bioenergy processing<br />
plants, may bring new<br />
challenges for small community<br />
systems. These industries frequently<br />
have high w<strong>at</strong>er use and<br />
effluent tre<strong>at</strong>ment demands.<br />
Without proper planning, these<br />
<strong>at</strong>tributes could lead to unforeseen<br />
expenses for communities,<br />
both in terms of new infrastructure<br />
and tre<strong>at</strong>ment capacity and<br />
the need to upgrade the skill<br />
level of w<strong>at</strong>er oper<strong>at</strong>ors—all<br />
problem<strong>at</strong>ic given the list of<br />
problems mentioned above.<br />
Illinois Survey Yields<br />
Interesting Results<br />
While there is broad agreement<br />
th<strong>at</strong> these issues exist among<br />
community consultants and small<br />
system w<strong>at</strong>er oper<strong>at</strong>ors themselves,<br />
very few st<strong>at</strong>istics exist to<br />
verify or refute these assertions.<br />
With funding from the Midwest<br />
Technical Assistance Center and<br />
the U.S. Department of<br />
Agriculture, we conducted a survey<br />
of w<strong>at</strong>er oper<strong>at</strong>ors in 2007.<br />
The survey was sent to all registered<br />
supervising oper<strong>at</strong>ors<br />
(1,184) for community w<strong>at</strong>er systems<br />
in the st<strong>at</strong>e of Illinois.<br />
A total of 474 oper<strong>at</strong>ors<br />
responded to the survey, and 471<br />
returned surveys sufficiently valid<br />
for inclusion in our analysis (a<br />
response r<strong>at</strong>e of approxim<strong>at</strong>ely 40<br />
percent). Oper<strong>at</strong>ors were asked<br />
to give background on their<br />
w<strong>at</strong>er systems and communities,<br />
including: community popul<strong>at</strong>ion,<br />
system size, source of w<strong>at</strong>er, system<br />
ownership, w<strong>at</strong>er system<br />
health, w<strong>at</strong>er system capacity, as<br />
well as their level of oper<strong>at</strong>or<br />
training, amount of time dedic<strong>at</strong>ed,<br />
and the salary they<br />
received. Illinois provides a good<br />
benchmark: According to the U.S.<br />
Census, the st<strong>at</strong>e falls in the<br />
median on most of the critical<br />
demographic variables (age distribution,<br />
household income,<br />
educ<strong>at</strong>ional <strong>at</strong>tainment, etc.),<br />
making it an ideal for gauging<br />
n<strong>at</strong>ional trends.<br />
The distribution of responses is<br />
comparable to the community<br />
w<strong>at</strong>er system size distribution for<br />
Illinois. It is notable th<strong>at</strong> the<br />
returned surveys over-represent<br />
the smallest c<strong>at</strong>egories of w<strong>at</strong>er<br />
systems, and under-represent<br />
mid-sized systems (those between<br />
10,000 and 100,000). Because<br />
there are only nine community<br />
w<strong>at</strong>er systems for communities of<br />
more <strong>than</strong> 100,000, it is not surprising<br />
th<strong>at</strong> we received only a<br />
couple of responses from oper<strong>at</strong>ors<br />
<strong>at</strong> Illinois’ largest utilities.<br />
The distribution of w<strong>at</strong>er system<br />
size is rel<strong>at</strong>ively similar to the<br />
n<strong>at</strong>ional distribution. (See Table 1<br />
for comparison.)<br />
The differences on key questions<br />
are summarized in Table 2.<br />
Analysis of the survey responses<br />
indic<strong>at</strong>es th<strong>at</strong> size m<strong>at</strong>ters: but<br />
much more so in terms of longterm<br />
capacity <strong>than</strong> for many of<br />
the indic<strong>at</strong>ors th<strong>at</strong> we often associ<strong>at</strong>e<br />
with day-to-day system<br />
capacity. For example, when we<br />
asked how oper<strong>at</strong>ors felt about<br />
their w<strong>at</strong>er systems, both those<br />
from systems of less <strong>than</strong> 500 and<br />
those with more <strong>than</strong> 10,000 connections<br />
were most likely to say<br />
their w<strong>at</strong>er systems were in good<br />
shape. It may well be th<strong>at</strong> the<br />
oper<strong>at</strong>ors of the smallest systems<br />
simply didn’t recognize looming<br />
problems. But there is no way to<br />
know th<strong>at</strong> from this d<strong>at</strong>a.<br />
Likewise, there was no discernable<br />
p<strong>at</strong>tern when we asked<br />
oper<strong>at</strong>ors to opine about whether<br />
w<strong>at</strong>er r<strong>at</strong>es covered costs. In all<br />
size c<strong>at</strong>egories of less <strong>than</strong><br />
www.nesc.wvu.edu 25
10,000, approxim<strong>at</strong>ely 20 percent<br />
felt th<strong>at</strong> r<strong>at</strong>es did not cover costs,<br />
and 25 percent of those representing<br />
systems of more <strong>than</strong><br />
10,000 felt the same way. Again,<br />
it is possible to interpret this as a<br />
sign of low capacity, as small systems<br />
may simply not have<br />
understood the extent to which<br />
their system was in difficult financial<br />
straits. This could explain<br />
some of the other responses.<br />
When we asked for more<br />
objective indic<strong>at</strong>ors of capacity, a<br />
more definite p<strong>at</strong>tern emerged.<br />
<strong>Systems</strong> of gre<strong>at</strong>er <strong>than</strong> 10,000<br />
connections were significantly<br />
less likely to have been cited<br />
with viol<strong>at</strong>ions in the last two<br />
years. <strong>Systems</strong> of fewer <strong>than</strong> 500<br />
hookups were significantly more<br />
likely <strong>than</strong> systems in all other<br />
size c<strong>at</strong>egories to have had w<strong>at</strong>er<br />
quality viol<strong>at</strong>ions over the last<br />
two years. <strong>Systems</strong> of less <strong>than</strong><br />
500 connections were also the<br />
most likely not to have raised<br />
their r<strong>at</strong>es in the last three years.<br />
The only question where we<br />
find a reverse trend is in the area<br />
of management. When we asked<br />
whether the community w<strong>at</strong>er<br />
system board or committee met<br />
on a regular basis, as a key indic<strong>at</strong>or<br />
of management capacity,<br />
small system oper<strong>at</strong>ors actually<br />
ranked their systems better <strong>than</strong><br />
oper<strong>at</strong>ors from all other size c<strong>at</strong>egories<br />
– with only 18 percent,<br />
versus 25 percent for systems of<br />
gre<strong>at</strong>er <strong>than</strong> 10,000 hookups saying<br />
th<strong>at</strong> the w<strong>at</strong>er board did not<br />
meet regularly. This does not say<br />
anything about actual board<br />
deliber<strong>at</strong>ions or decisions, but it<br />
does <strong>at</strong> least indic<strong>at</strong>e th<strong>at</strong> someone<br />
on the board felt the position<br />
was important enough to warrant<br />
regular meetings.<br />
On the other hand, small systems<br />
were in a much more<br />
precarious situ<strong>at</strong>ion regarding the<br />
human aspects of oper<strong>at</strong>ional<br />
capacity. Analysis indic<strong>at</strong>es a consistent<br />
inverse rel<strong>at</strong>ionship<br />
between w<strong>at</strong>er system size and<br />
indic<strong>at</strong>ors of oper<strong>at</strong>or capacity.<br />
Oper<strong>at</strong>ors from small systems<br />
were, on average, older, less<br />
trained, and more poorly paid<br />
<strong>than</strong> those representing larger<br />
systems. While it is not surprising,<br />
it is somewh<strong>at</strong> alarming th<strong>at</strong> 85<br />
percent of oper<strong>at</strong>ors of very small<br />
systems made less <strong>than</strong> $40,000<br />
annually, and 65 percent of these<br />
oper<strong>at</strong>ors were older <strong>than</strong> 50<br />
years of age <strong>at</strong> the time of the<br />
survey. This bodes poorly for the<br />
ability to hire new oper<strong>at</strong>ors as<br />
Baby Boomers retire.<br />
Challenges Ahead<br />
The upshot is th<strong>at</strong> many of the<br />
assertions of those working with<br />
small community w<strong>at</strong>er systems<br />
were confirmed by the results of<br />
this survey. <strong>Small</strong> systems are,<br />
indeed, more likely to be in viol<strong>at</strong>ion<br />
of w<strong>at</strong>er regul<strong>at</strong>ions, and<br />
more likely not to be raising r<strong>at</strong>es<br />
on an annual basis to avoid wh<strong>at</strong><br />
has been called “r<strong>at</strong>e shock”<br />
when w<strong>at</strong>er systems try to<br />
address long term problems.<br />
One of the most important<br />
findings is th<strong>at</strong> the w<strong>at</strong>er industry-wide<br />
workforce crisis may<br />
well be more severe in small systems.<br />
Indeed, small systems in<br />
Illinois have both the oldest and<br />
lowest paid w<strong>at</strong>er oper<strong>at</strong>ors. It<br />
may be th<strong>at</strong> the key to sustainably<br />
TABLE 1: DISTRIBUTION OF WATER SYSTEMS BY SIZE<br />
Respondent<br />
Frequency<br />
Respondent Percent Illinois Percent U.S. Percent<br />
Fewer <strong>than</strong> 500<br />
connections<br />
501 to 3,300<br />
connections<br />
3,301 to 10,000<br />
connections<br />
10,001 to 100,000<br />
connections<br />
188 39.9 36 56<br />
196 41.6 39.1 27<br />
66 14.2 12.6 9<br />
21 4.2 12 7<br />
>100,000 2 0.4 0.5 1<br />
Total 471 100 100.1 99<br />
26 On Tap Spring/Summer 2010
TABLE 2: WATER CAPACITY BY SYSTEM SIZE<br />
Percent of<br />
Respondents th<strong>at</strong>:<br />
R<strong>at</strong>e Their <strong>W<strong>at</strong>er</strong><br />
System as Not<br />
Healthy<br />
Say <strong>W<strong>at</strong>er</strong> <strong>Systems</strong><br />
Cited for Viol<strong>at</strong>ions<br />
in Last 2 Years*<br />
Say R<strong>at</strong>es Have Not<br />
Been Raised in the<br />
Last Three Years*<br />
10,001<br />
27.4 33.8 36.6 38.5 25<br />
31.7 22.1 19 26.2 5<br />
41.8 31.8 36.8 29.7 15<br />
Say R<strong>at</strong>es Do Not<br />
Cover Costs<br />
22.3 19.7 20.3 23.4 25<br />
Report Average<br />
Oper<strong>at</strong>or Pay<br />
< $40,000**<br />
Report Average<br />
Oper<strong>at</strong>or Age<br />
>50 **<br />
Report <strong>W<strong>at</strong>er</strong> Board<br />
Does Not Meet<br />
Regularly<br />
85.1 52.3 29.3 4.9 0<br />
65.8 56.3 55 53.8 55<br />
18.6 22.9 20.9 22.6 25<br />
* Indic<strong>at</strong>es th<strong>at</strong> this rel<strong>at</strong>ionship was significant with a P value of .05.<br />
** Indic<strong>at</strong>es th<strong>at</strong> the st<strong>at</strong>istical difference was significant with a P-value of .01 or below.<br />
providing safe w<strong>at</strong>er throughout<br />
the st<strong>at</strong>e—and in other parts of<br />
the country—will be in helping<br />
those community w<strong>at</strong>er boards<br />
th<strong>at</strong> meet on a regular basis to<br />
understand the importance of<br />
investing in human capital, in the<br />
form of oper<strong>at</strong>ors, as well as<br />
physical infrastructure.<br />
Acknowledgements: Thanks to the<br />
Midwest Technical Assistance Center,<br />
the H<strong>at</strong>ch Fund of the U.S. Department<br />
of Agriculture, and the University of<br />
Illinois Agricultural Experiment St<strong>at</strong>ion<br />
and the Michigan St<strong>at</strong>e University<br />
Department of Sociology Startup Fund<br />
for providing the resources to carry out<br />
and analyze these findings. The authors<br />
extend a special <strong>than</strong>ks to Anne Silvis<br />
and Steve Wilson for their assistance in<br />
moving this project forward.<br />
References<br />
American <strong>W<strong>at</strong>er</strong> Works Associ<strong>at</strong>ion.<br />
2004. Avoiding R<strong>at</strong>e Shock: Making<br />
the Case for <strong>W<strong>at</strong>er</strong> R<strong>at</strong>es. Denver:<br />
AWWA.<br />
Duhigg, Charles. 2010. “Toxic <strong>W<strong>at</strong>er</strong>s:<br />
Saving U.S. <strong>W<strong>at</strong>er</strong> and Sewer<br />
<strong>Systems</strong> Would be Costly.” New<br />
York Times, p. A1 (March 14).<br />
Hollands, Bruce. 2010. “The<br />
Underground Infrastructure Crisis:<br />
Rebuilding <strong>W<strong>at</strong>er</strong> and Sewer<br />
<strong>Systems</strong> without a Flood of Red<br />
Ink.” Issue Brief #176, (January 18)<br />
Accessed <strong>at</strong>: www.ntu.org/newsand-issues/transport<strong>at</strong>ioninfrastructure/ntuib176undergroun<br />
dinfrastructurecrisis.pdf.<br />
<strong>W<strong>at</strong>er</strong> Online. 2000. “America’s Drinking<br />
<strong>W<strong>at</strong>er</strong>, Wastew<strong>at</strong>er <strong>Systems</strong> in Desper<strong>at</strong>e<br />
Need of Funding.” (April 20).<br />
Formerly the<br />
Director of Policy<br />
Development and<br />
Applied Research<br />
with the Rural<br />
<strong>Community</strong> Assistance<br />
Partnership, Stephen<br />
Gasteyer is an assistant<br />
professor in the Sociology<br />
Department <strong>at</strong> Michigan<br />
St<strong>at</strong>e University (MSU).<br />
Dandan Kong is<br />
a gradu<strong>at</strong>e student<br />
in the MSU<br />
Sociology Department,<br />
research rural community<br />
environmental issues.<br />
www.nesc.wvu.edu 27