Air-FTG® for Regional Scale Mapping Bell Geospace Air ... - Dmec.ca
Air-FTG® for Regional Scale Mapping Bell Geospace Air ... - Dmec.ca
Air-FTG® for Regional Scale Mapping Bell Geospace Air ... - Dmec.ca

Create successful ePaper yourself
Turn your PDF publications into a flip-book with our unique Google optimized e-Paper software.
<strong>Air</strong>-FTG ® <strong>for</strong> <strong>Regional</strong> <strong>S<strong>ca</strong>le</strong> <strong>Mapping</strong><br />
James Mataragio 1 , James Brewster 1 , Colm Murphy 2 , John Mims 1<br />
1.<strong>Bell</strong> <strong>Geospace</strong> Inc., Houston, Texas, US 2. <strong>Bell</strong> <strong>Geospace</strong> Ltd, Aberdeen, UK<br />
Fundamental Subject Matter<br />
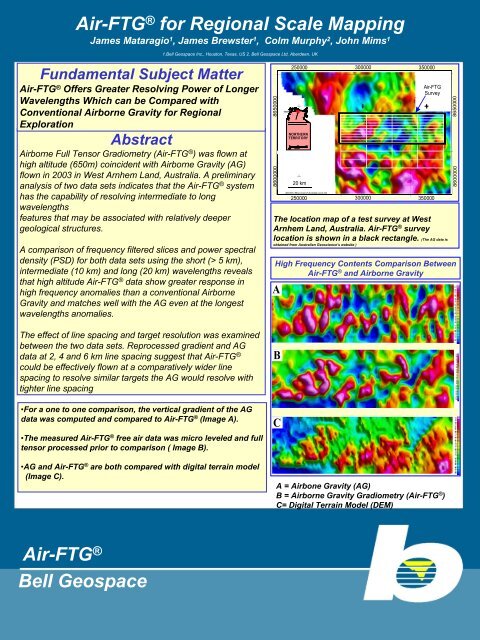
<strong>Air</strong>-FTG ® Offers Greater Resolving Power of Longer<br />
Wavelengths Which <strong>ca</strong>n be Compared with<br />
Conventional <strong>Air</strong>borne Gravity <strong>for</strong> <strong>Regional</strong><br />
Exploration<br />
Abstract<br />
<strong>Air</strong>borne Full Tensor Gradiometry (<strong>Air</strong>-FTG ® ) was flown at<br />
high altitude (650m) coincident with <strong>Air</strong>borne Gravity (AG)<br />
flown in 2003 in West Arnhem Land, Australia. A preliminary<br />
analysis of two data sets indi<strong>ca</strong>tes that the <strong>Air</strong>-FTG ® system<br />
has the <strong>ca</strong>pability of resolving intermediate to long<br />
wavelengths<br />
features that may be associated with relatively deeper<br />
geologi<strong>ca</strong>l structures.<br />
A comparison of frequency filtered slices and power spectral<br />
density (PSD) <strong>for</strong> both data sets using the short (> 5 km),<br />
intermediate (10 km) and long (20 km) wavelengths reveals<br />
that high altitude <strong>Air</strong>-FTG ® data show greater response in<br />
high frequency anomalies than a conventional <strong>Air</strong>borne<br />
Gravity and matches well with the AG even at the longest<br />
wavelengths anomalies.<br />
8650000<br />
8600000<br />
250000<br />
NORTHERN<br />
TERRITORY<br />
20 km<br />
300000<br />
350000<br />
<strong>Air</strong>-FTG<br />
Survey<br />
250000 300000 350000<br />
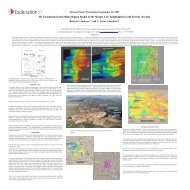
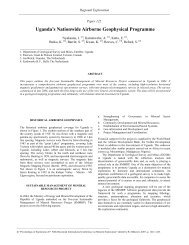
The lo<strong>ca</strong>tion map of a test survey at West<br />
Arnhem Land, Australia. <strong>Air</strong>-FTG ® survey<br />
lo<strong>ca</strong>tion is shown in a black rectangle. (The AG data is<br />
obtained from Australian Geoscience’s website )<br />
High Frequency Contents Comparison Between<br />
<strong>Air</strong>-FTG ® and <strong>Air</strong>borne Gravity<br />
A<br />
8650000<br />
8600000<br />
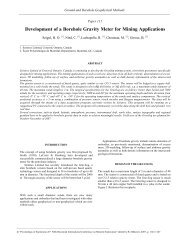
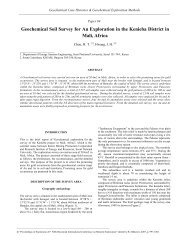
The effect of line spacing and target resolution was examined<br />
between the two data sets. Reprocessed gradient and AG<br />
data at 2, 4 and 6 km line spacing suggest that <strong>Air</strong>-FTG ®<br />
could be effectively flown at a comparatively wider line<br />
spacing to resolve similar targets the AG would resolve with<br />
tighter line spacing<br />
•For a one to one comparison, the verti<strong>ca</strong>l gradient of the AG<br />
data was computed and compared to <strong>Air</strong>-FTG ® (Image A).<br />
•The measured <strong>Air</strong>-FTG ® free air data was micro leveled and full<br />
tensor processed prior to comparison ( Image B).<br />
•AG and <strong>Air</strong>-FTG ® are both compared with digital terrain model<br />
(Image C).<br />
B<br />
C<br />
A = <strong>Air</strong>bone Gravity (AG)<br />
B = <strong>Air</strong>borne Gravity Gradiometry (<strong>Air</strong>-FTG ® )<br />
C= Digital Terrain Model (DEM)<br />
<strong>Air</strong>-FTG ®<br />
<strong>Bell</strong> <strong>Geospace</strong>
<strong>Air</strong>-FTG ® <strong>for</strong> <strong>Regional</strong> <strong>S<strong>ca</strong>le</strong> <strong>Mapping</strong><br />
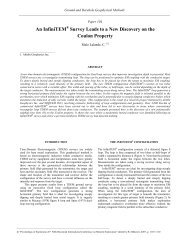
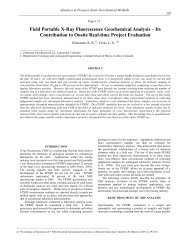
Frequency Content Analysis Between <strong>Air</strong>-FTG ® and <strong>Air</strong>borne<br />
Gravity<br />
A<br />
<strong>Air</strong>-FTG<br />
D<br />
st<br />
GT1A 1 VD<br />
Short<br />
Wavelengths<br />
B<br />
5km cutoff wavelength<br />
E<br />
Medium<br />
Wavelengths<br />
C<br />
10km cutoff wavelength<br />
F<br />
Long<br />
Wavelengths<br />
20km cutoff waveleng th<br />
• At short wavelength two data sets correlate well. However, resolution<br />
variations exist, <strong>Air</strong>-FTG ® resolves targets with much details compared to AG<br />
(A and D)<br />
•At medium wavelength both data sets resolve similar linear gravity highs and<br />
lows features trending NE-SW (B and E).<br />
•At long wavelength both data compare fairly well, both measuring regional<br />
structures<br />
<strong>Air</strong>-FTG ®<br />
<strong>Bell</strong> <strong>Geospace</strong>
<strong>Air</strong>-FTG ® <strong>for</strong> <strong>Regional</strong> <strong>S<strong>ca</strong>le</strong> <strong>Mapping</strong><br />
James Mataragio, James Brewster, Colm Murphy, John Mims<br />
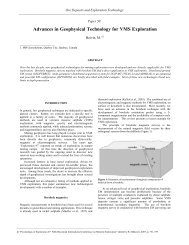
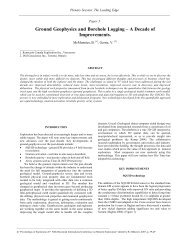
Line Spacing and Power Spectral Density Comparison<br />
Between <strong>Air</strong>-FTG ® and <strong>Air</strong>borne Gravity<br />
10000<br />
Power Spectral Density<br />
A<br />
<strong>Air</strong>-FTG<br />
Line Spacing Analysis<br />
D<br />
st<br />
GT1A 1 VD<br />
1000<br />
Spatial PSD [E^2 km]<br />
100<br />
10<br />
Tzz measured by FTG<br />
Tzz derived from GT1A<br />
Tzz FTG 4km low-pass filter<br />
B<br />
C<br />
2km line spacing<br />
E<br />
4km line spacing<br />
F<br />
1<br />
15<br />
10<br />
5<br />
Wavelength [km]<br />
0<br />
6km line spacing<br />
• The graph of the Power Spectral Density (PSD)<br />
<strong>for</strong> <strong>Air</strong>-FTG ® Tzz and the Tzz response derived<br />
from the AG<br />
• The energy level in FTG Tzz is higher than that<br />
of AG response over a broad range of<br />
wavelengths<br />
• <strong>Air</strong>-FTG ® measurements could be matched to<br />
the AG at the long wavelength end of the<br />
spectrum by appli<strong>ca</strong>tion of a low-pass filter.<br />
• Six <strong>Air</strong>-FTG ® and AG images corresponding to 2, 4,<br />
and 6 km line spacing are displayed<br />
•Anomalies in black box (image A and D) show<br />
differences in resolution at 2 km line spacing between<br />
the two systems<br />
•The yellow circle highlights a geologi<strong>ca</strong>l target which<br />
is clearly detectable using <strong>Air</strong>-FTG ® even at wider line<br />
spacing, but the same target almost disappears in AG<br />
data with the same line spacing.<br />
Conclusions<br />
High altitude <strong>Air</strong>-FTG ® data compares well with airborne gravity and resolves intermediate to relatively long<br />
wavelengths anomalies that may be associated with deeper geologic features.<br />
High frequency response of <strong>Air</strong>-FTG ® is greater than that of the AG. Filtering the low frequency response of <strong>Air</strong>-<br />
FTG ® matches well with the AG even at the longest wavelengths<br />
Line spacing analysis indi<strong>ca</strong>te that <strong>Air</strong>-FTG ® system is more cost effective, surveys could be flown at wider<br />
line spacing with the same or better resolution than the conventional airborne gravity.<br />
<strong>Air</strong>-FTG ®<br />
<strong>Bell</strong> <strong>Geospace</strong>