Short Range Transit Plan - Santa Cruz METRO
Short Range Transit Plan - Santa Cruz METRO
Short Range Transit Plan - Santa Cruz METRO

Create successful ePaper yourself
Turn your PDF publications into a flip-book with our unique Google optimized e-Paper software.
2007 - 2008<br />
<strong>Santa</strong> <strong>Cruz</strong> Metro<br />
<strong>Short</strong> <strong>Range</strong> <strong>Transit</strong> <strong>Plan</strong><br />
<strong>METRO</strong>
SANTA CRUZ <strong>METRO</strong><br />
SHORT RANGE TRANSIT PLAN<br />
DECEMBER 2008<br />
The preparation of this report has been financed in part by the Association of Monterey Bay Area Governments with<br />
funding from the United States Department of Transportation, Federal <strong>Transit</strong> Administration.
TABLE OF CONTENTS<br />
Chapters<br />
1 Introduction<br />
2 Background<br />
3 Goals, Objectives and Standards<br />
4 System Evaluation / Current Performance<br />
5 Service Improvement Program<br />
6 Financial Analysis and Capital Needs<br />
7 Addendum<br />
Appendices<br />
A<br />
B<br />
C<br />
D<br />
E<br />
History of Metro<br />
Fleet Inventory<br />
Metro Website Evaluation<br />
Outreach Results<br />
Financial Tables<br />
101015<br />
SANTA CRUZ SHORT RANGE TRANSIT PLAN<br />
ii<br />
WILBUR SMITH ASSOCIATES
CHAPTER 1: INTRODUCTION<br />
OVERVIEW OF PROJECT<br />
The ever changing demographic and economic conditions in <strong>Santa</strong> <strong>Cruz</strong> County continually shift the future<br />
demands on the transportation infrastructure. Residents’ decisions on where to live, work, and recreate and<br />
the mode of transportation they choose to make these trips directly impact the transportation needs for the<br />
region. As roadway congestion worsens and fuel prices continue to go up, the availability of alternative<br />
modes of transportation to the automobile will play a significant role in the future transportation network for<br />
<strong>Santa</strong> <strong>Cruz</strong> County.<br />
<strong>Santa</strong> <strong>Cruz</strong> Regional Transportation Commission (SCRTC) functions as the County’s authority for<br />
prioritizing major capital improvement projects for the region’s transportation needs. These needs are<br />
derived from matching anticipated future travel conditions to the available infrastructure to support this<br />
travel. RTC’c planning process predicts future demands based on current travel behavior and assigns funding<br />
accordingly.<br />
Over the past twelve months, <strong>Santa</strong> <strong>Cruz</strong> <strong>METRO</strong>, the regions’ public transportation provider, has been<br />
working with Wilbur Smith Associates (WSA) to assess the future role for public transportation in the region.<br />
This effort involved a thorough assessment of system performance and financial data from the agency as well<br />
as a provided a number of different forums for community input and involvement to gain insight on the<br />
various needs of each community. This information was brought together to develop <strong>METRO</strong>’s first<br />
comprehensive short range transit plan (SRTP) that will be used to help guide future decisions made about<br />
<strong>METRO</strong>’s operations.<br />
PURPOSE OF THE SRTP<br />
The SRTP is a plan used by <strong>METRO</strong> to help determine the most efficient and effective use of the current<br />
and future resources to meet the transit needs for the residents of <strong>Santa</strong> <strong>Cruz</strong> County. The plan provides a<br />
comprehensive overview of transit operations in the County, establishes service standards to assist policy<br />
makers in making critical decisions, and outlines a service plan to focus available resources. The planning<br />
horizon for the plan is FY 2008 to FY 2012, focusing on the short-term needs of the agency.<br />
Section one provides an overview of the service, including service area characteristics, the regional transit<br />
network, the fleet and facilities of the organization and the organizational structure of the agency. Section<br />
two of the SRTP reviews the outreach efforts involved in the development of the plan. Section three of the<br />
plan details the goals, objectives, and service standards of the agency. Section four outlines the goals and<br />
objectives of <strong>METRO</strong> and recommended service standards. Section five provides a service improvement<br />
plan for the five year planning horizon and section six is the financial plan. Appendices A through I contain<br />
supplementary information collected and used during the development of the plan.<br />
SERVICE AREA CHARACTERISTICS<br />
Service Area Overview<br />
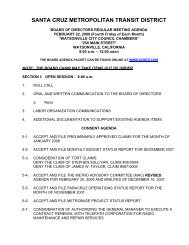
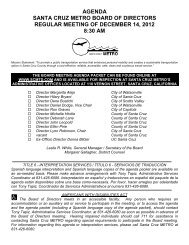
<strong>Santa</strong> <strong>Cruz</strong> County (Figure 2-1) is nearly 450 square miles and home to over 250,000 people. Nearly 50% of<br />
the population lives on 5% of the total land in the County. This population can be found in the communities<br />
of <strong>Santa</strong> <strong>Cruz</strong>, Watsonville, Capitola and Scotts Valley. This concentration of population in urban areas<br />
creates a large network of open space and rural areas within the County.<br />
101015<br />
SANTA CRUZ <strong>METRO</strong> SHORT RANGE TRANSIT PLAN<br />
Page 1 - 1<br />
WILBUR SMITH ASSOCIATES
INTRODUCTION<br />
<strong>Santa</strong> <strong>Cruz</strong><br />
The City of <strong>Santa</strong> <strong>Cruz</strong> is the County’s largest city and the County’s seat. The beach front city is situated on<br />
the northern portion of Monterey Bay, making it a prime tourist destination. Highway 1 runs east/west<br />
through the city and Highway 17 runs north, providing access to <strong>Santa</strong> Clara Valley. The city is home to the<br />
University of California at <strong>Santa</strong> <strong>Cruz</strong> (UCSC).<br />
Watsonville<br />
The City of Watsonville is the second largest city in the County and located on the southeastern corner near<br />
Monterey County. The community is a key agricultural community in the region. Watsonville has nearly<br />
doubled in population over the past 25 years and is expected to grow to be the largest city in the County by<br />
2015.<br />
Capitola<br />
Capitola is another tourist town in <strong>Santa</strong> <strong>Cruz</strong> County located directly to the east of <strong>Santa</strong> <strong>Cruz</strong>. Its proximity<br />
to <strong>Santa</strong> <strong>Cruz</strong> and the unincorporated areas of Soquel, Aptos and Live Oak create one interconnected<br />
urbanized area that is stretched out along Highway 1. The center of activity in the town is located on the<br />
beachfront and is referred to as the Capitola Village.<br />
Figure 1- 1: <strong>METRO</strong> Service Area (<strong>Santa</strong> <strong>Cruz</strong> County)<br />
GIS Source: ESRI Data<br />
Scotts Valley<br />
The city of Scotts Valley is located in the <strong>Santa</strong> <strong>Cruz</strong> Mountains between the City of <strong>Santa</strong> <strong>Cruz</strong> and the City<br />
of San Jose along Highway 17. Its location between these two cities adds both tourism and high-technology<br />
to the city’s economy.<br />
101015<br />
SANTA CRUZ <strong>METRO</strong> SHORT RANGE TRANSIT PLAN<br />
Page 1 - 2<br />
WILBUR SMITH ASSOCIATES
INTRODUCTION<br />
San Lorenzo Valley<br />
The San Lorenzo Valley is a region north of the City of <strong>Santa</strong> <strong>Cruz</strong> that follows the San Lorenzo River up<br />
into the <strong>Santa</strong> <strong>Cruz</strong> Mountains. The rural area is home to the towns of Ben Lomond, Felton, Brookdale, and<br />
Boulder Creek. The northern end of the Valley is home to Big Basin Redwoods State Park. Highway 9 is the<br />
key transportation corridor linking the Valley to the City of <strong>Santa</strong> <strong>Cruz</strong><br />
UCSC<br />
The University of California at <strong>Santa</strong> <strong>Cruz</strong> (UCSC) is one of the ten public collegiate universities in the<br />
University of California state school system. The campus is situated on 2,100 acres of rolling, forested hills<br />
overlooking the City of <strong>Santa</strong> <strong>Cruz</strong> and the Pacific Ocean. Just over 15,000 undergraduate and graduate<br />
students attend classes in Arts, Engineering, Humanities, Physical and Biological Sciences, and Social<br />
Sciences.<br />
The University’s 2005 Long <strong>Range</strong> Development <strong>Plan</strong> calls for future growth of an additional 5,100 students<br />
and 980 faculty members over the next 15 years. A high percentage of the University’s students, and most of<br />
its’ faculty live off-campus in <strong>Santa</strong> <strong>Cruz</strong> and the surrounding communities. This projected growth and offcampus<br />
living patterns will likely contribute to an increase of transit demand in the years to come.<br />
Demographics<br />
<strong>Santa</strong> <strong>Cruz</strong> County contains only four<br />
incorporated cities; <strong>Santa</strong> <strong>Cruz</strong>, Watsonville,<br />
Capitola, and Scotts Valley. These cities are<br />
located primarily along Highway 1 and<br />
border the Pacific Ocean. Only Scotts<br />
Valley is located away from this corridor in<br />
the <strong>Santa</strong> <strong>Cruz</strong> Mountains. Table 2.1 shows<br />
how these communities compare in<br />
population and size to the rest of <strong>Santa</strong><br />
<strong>Cruz</strong> County and the State. Table 1- 2<br />
shows a detailed breakdown of the key<br />
demographics of each of these four<br />
communities, the county, and the state.<br />
Table 1- 1: Population and Area Overview<br />
City<br />
Population<br />
Area<br />
(sq.mi.)<br />
Pop. Density<br />
(person/sq. mi.)<br />
<strong>Santa</strong> <strong>Cruz</strong> 54,593 12.90 4,232.02<br />
Watsonville 44,265 6.00 7,377.50<br />
Capitola 10,033 1.60 6,270.63<br />
Scotts Valley 11,385 4.60 2,473.70<br />
<strong>Santa</strong> <strong>Cruz</strong> County 255,602 445.24 122.61<br />
California 33,871,648 155,959.34 217.18<br />
The Association of Monterey Bay Area<br />
Source: 2000 US Census<br />
Governments serves as the Metropolitan<br />
<strong>Plan</strong>ning Organization (MPO) for the Counties of Monterey, <strong>Santa</strong> <strong>Cruz</strong> and San Benito. As part of its<br />
responsibilities, AMBAG provides forecasts for population, housing, and employment for these Counties.<br />
This process provides a common planning base for regional and local planning efforts.<br />
Figures 2.2 – 2.4 show AMBAG’s 2004 forecasts for the four incorporated cities in <strong>Santa</strong> <strong>Cruz</strong> County and<br />
the unincorporated regions of the County. The figures show that Watsonville is forecasted to become the<br />
largest city in the County, surpassing <strong>Santa</strong> <strong>Cruz</strong> by the year 2015. The other areas of the County are<br />
expected to experience population growth as well, but the majority is forecasted to occur in Watsonville.<br />
The housing and employment forecasts continue to show higher quantities for <strong>Santa</strong> <strong>Cruz</strong>, despite being<br />
surpassed in population by Watsonville. Both <strong>Santa</strong> <strong>Cruz</strong> and Watsonville show steady growth in these<br />
categories with Scotts Valley and Capitola showing slow growth.<br />
101015<br />
SANTA CRUZ <strong>METRO</strong> SHORT RANGE TRANSIT PLAN<br />
Page 1 - 3<br />
WILBUR SMITH ASSOCIATES
INTRODUCTION<br />
Table 1- 2: Service Area Demographic Summary, 2000-2006<br />
<strong>Santa</strong> <strong>Cruz</strong> Watsonville Capitola Scotts Valley<br />
<strong>Santa</strong> <strong>Cruz</strong><br />
County<br />
California<br />
Total Population (2000) 54,593 44,265 10,033 11,385 255,602 33,871,648<br />
Total Population (2006) estimate 54,778 48,709 9,507 11,150 249,705 36,457,549<br />
Population change (2000-2006) + 0.3% +10.0% -5.2% -2.1% -2.3% +7.6%<br />
Age<br />
under 5 2,664 4.9% 4,100 9.3% 488 4.9% 774 6.8% 15,544 6.1% 2,486,981 7.3%<br />
Persons under 18 yrs old 9,463 17.3% 15,037 34.0% 1,846 18.4% 2,939 25.8% 60,741 23.8% 9,249,829 27.3%<br />
Persons between 18 and 25 11,188 20.5% 5,244 11.8% 936 9.3% 800 7.0% 30,397 11.9% 3,366,030 9.9%<br />
Persons between 25 and 65 29,279 53.6% 20,182 45.6% 5,831 58.1% 6,073 53.3% 138,977 54.4% 17,660,131 52.1%<br />
Persons 65 years and older 4,663 8.5% 3,802 8.6% 1,420 14.2% 1,573 13.8% 25,487 10.0% 3,595,658 10.6%<br />
Median Age 31.7 27.4 38.4 38.3 35.0 33.3<br />
Gender<br />
Female 27,413 50.2% 22,240 50.2% 5,267 52.5% 5,544 48.7% 128,023 50.1% 16,874,892 49.8%<br />
Male 27,180 49.8% 22,025 49.8% 4,766 47.5% 5,841 51.3% 127,579 49.9% 16,996,756 50.2%<br />
Disability<br />
Persons with a disability, age 5+ 7,814 14.3% 8,340 1,619 1,251 37,895 5,923,361<br />
Journey to Work<br />
Mean travel time to work<br />
(minutes), workers 16+ 23 24 28 30 28 28<br />
Mode to Work<br />
Car, truck, or van: 21,289 73.5% 14,304 86.1% 4,911 86.2% 4,730 86.9% 105,600 83.7% 12,545,775 86.4%<br />
Public transportation: 2,119 7.3% 484 2.9% 74 1.3% 127 2.3% 4,159 3.3% 736,037 5.1%<br />
Motorcycle 117 0.4% 6 0.0% 25 0.4% 45 0.8% 374 0.3% 36,262 0.2%<br />
Bicycle 1,282 4.4% 258 1.6% 92 1.6% 24 0.4% 2,585 2.0% 120,567 0.8%<br />
Walked 2,343 8.1% 889 5.4% 298 5.2% 224 4.1% 5,599 4.4% 414,581 2.9%<br />
Other means 168 0.6% 405 2.4% 57 1.0% 8 0.1% 1,044 0.8% 115,064 0.8%<br />
Worked at home 1,653 5.7% 258 1.6% 242 4.2% 285 5.2% 6,745 5.3% 557,036 3.8%<br />
Ethnicity<br />
White 52,137 95.5% 19,036 43.0% 8,412 83.8% 10,090 88.6% 191,931 75.1% 20,170,059 59.5%<br />
Black or African American 945 1.7% 334 0.8% 117 1.2% 55 0.5% 2,477 1.0% 2,263,882 6.7%<br />
American Indian and Alaska<br />
Native persons 469 0.9% 768 1.7% 57 0.6% 46 0.4% 2,461 1.0% 333,346 1.0%<br />
Asian persons 2,677 4.9% 1,455 3.3% 401 4.0% 526 4.6% 8,789 3.4% 3,697,513 10.9%<br />
Native Hawaiian and Other<br />
Pacific Islander persons 72 0.1% 53 0.1% 20 0.2% 21 0.2% 382 0.1% 116,961 0.3%<br />
Persons reporting some other<br />
race 4,990 9.1% 20,328 45.9% 555 5.5% 245 2.2% 38,391 15.0% 5,682,241 16.8%<br />
Persons reporting two or more<br />
races 2,456 4.5% 2,291 5.2% 471 4.7% 402 3.5% 11,171 4.4% 1,607,646 4.7%<br />
Hispanic or Latino (of any race) 9,491 17.4% 33,254 75.1% 1,267 12.6% 729 6.4% 68,486 26.8% 10,966,566 32.4%<br />
Language and Education<br />
Language other than English<br />
spoken at Home, % age 5+ 22.3% 70.7% 17.6% 12.2% 27.8% 39.5%<br />
High school graduates, % of<br />
persons age 25+ 89.1% 49.1% 91.3% 94.8% 83.2% 76.8%<br />
Bachelor's degree or higher, %<br />
of persons age 25+ 44.4% 8.7% 34.6% 40.9% 34.2% 26.6%<br />
Housing<br />
Housing Units 21,504 11,695 5,309 4,423 98,873 12,214,549<br />
Homeownership rate 46.6% 48.1% 88.4% 74.9% 60.0% 56.9%<br />
Households 20,442 11,381 4,692 4,273 91,139 11,502,870<br />
Persons per household 2.44 3.84 2.11 2.56 2.71 2.87<br />
Owner-occupied 2.51 3.55 2.10 2.66 2.71 2.93<br />
Renter-occupied 2.39 4.11 2.11 2.27 2.70 2.79<br />
Median household income $50,605 $37,619 $46,048 $2,449 $53,998 $47,493<br />
Individuals below poverty, % of<br />
pop 16.5% 19.1% 7.0% 2.5% 11.9% 14.2%<br />
Per capita income $25,758 $13,205 $27,609 $35,684 $26,396 $ 22,711<br />
Source: 2000 US Census<br />
101015<br />
SANTA CRUZ <strong>METRO</strong> SHORT RANGE TRANSIT PLAN<br />
Page 1 - 4<br />
WILBUR SMITH ASSOCIATES
INTRODUCTION<br />
Figure 1- 2: AMBAG Population Forecasts (2000-2030)<br />
Population<br />
160,000<br />
140,000<br />
120,000<br />
100,000<br />
80,000<br />
60,000<br />
40,000<br />
20,000<br />
-<br />
2000 2005 2010 2015 2020 2025 2030<br />
<strong>Santa</strong> <strong>Cruz</strong> 54,593 56,953 57,768 58,846 59,924 61,956 63,987<br />
Watsonville 44,265 52,716 56,779 61,126 65,473 67,946 70,418<br />
Scotts Valley 11,385 13,182 13,677 13,864 14,062 14,169 14,275<br />
Capitola 10,033 10,869 10,978 11,041 11,104 11,120 11,136<br />
Unincorporated 135,326 133,824 136,167 139,150 142,132 143,582 145,031<br />
Figure 1- 3: AMBAG Housing Forecast (2000-2030)<br />
70,000<br />
60,000<br />
50,000<br />
Year<br />
Housing<br />
40,000<br />
30,000<br />
20,000<br />
10,000<br />
-<br />
2000 2005 2010 2015 2020 2025 2030<br />
<strong>Santa</strong> <strong>Cruz</strong> 21,982 22,826 23,321 23,916 24,510 25,296 26,082<br />
Watsonville 12,361 13,905 14,939 16,335 17,730 18,478 19,226<br />
Scotts Valley 4,714 5,297 5,494 5,575 5,656 5,699 5,742<br />
Capitola 5,556 5,896 6,054 6,088 6,121 6,127 6,132<br />
Unincorporated 54,260 55,510 56,589 57,919 59,248 60,077 60,906<br />
Figure 1- 4: AMBAG Employment Forecast (2000-2030)<br />
p y j<br />
Employment<br />
90,000<br />
80,000<br />
70,000<br />
60,000<br />
50,000<br />
40,000<br />
30,000<br />
20,000<br />
10,000<br />
-<br />
Year<br />
2000 2005 2010 2015 2020 2025 2030<br />
<strong>Santa</strong> <strong>Cruz</strong> 46,213 47,598 53,344 56,564 59,783 63,328 66,872<br />
Watsonville 26,135 26,856 29,820 32,187 34,553 36,354 38,155<br />
Scotts Valley 9,986 10,843 11,839 12,571 13,303 13,885 14,466<br />
Capitola 10,651 10,935 12,280 13,093 13,905 14,721 15,536<br />
Unincorporated 56,633 58,866 65,940 68,731 71,522 74,872 78,222<br />
Year<br />
101015<br />
SANTA CRUZ <strong>METRO</strong> SHORT RANGE TRANSIT PLAN<br />
Page 1 - 5<br />
WILBUR SMITH ASSOCIATES
INTRODUCTION<br />
Economic Condition<br />
<strong>Santa</strong> <strong>Cruz</strong> County has a strong economic base which is structured around agriculture, tourism and retail<br />
trades. The unemployment rates (Table 2-3) for the County are widely variable. The City of <strong>Santa</strong> <strong>Cruz</strong> is just<br />
under the statewide average, Watsonville is nearly twice the state average and Capitola and Scotts Valley are<br />
nearly half of the state average. Clearly, there is a rather significant variance between the four incorporated<br />
cities.<br />
Table 1- 3: 2000 Unemployment Summary<br />
City<br />
Unemployment<br />
(pop 16+)<br />
<strong>Santa</strong> <strong>Cruz</strong> 4.2%<br />
Watsonville 7.9%<br />
Capitola 2.1%<br />
Scotts Valley 1.7%<br />
<strong>Santa</strong> <strong>Cruz</strong> County 4.1%<br />
California 4.3%<br />
Source: 2000 US Census<br />
The various employment categories and the number of employees employed in each profession are broken<br />
down for the various geographic regions and shown in Table 1- 4. These results show the region’s economic<br />
dependence on tourism and agriculture and the rather unbalanced employment distribution when compared<br />
with the statewide distribution.<br />
101015<br />
SANTA CRUZ <strong>METRO</strong> SHORT RANGE TRANSIT PLAN<br />
Page 1 - 6<br />
WILBUR SMITH ASSOCIATES
INTRODUCTION<br />
Table 1- 4: Employment Summary<br />
<strong>Santa</strong> <strong>Cruz</strong> Watsonville Capitola Scotts Valley <strong>Santa</strong> <strong>Cruz</strong> County California<br />
Retail trade 3,608 19% 2,389 20% 2,809 47% 914 16% 12,714 20% 1,525,113 12%<br />
Health care & social assistance 2,216 12% 2,110 17% 312 5% 435 7% 10,404 17% 1,434,479 11%<br />
Accommodation & food services 4,036 21% 1,146 9% 1,496 25% 704 12% 10,060 16% 1,145,536 9%<br />
Manufacturing & Agriculture 1,833 10% 2,801 23% - 0% 631 11% 6,694 11% 1,616,504 13%<br />
Wholesale trade 1,300 7% 1,471 12% 64 1% 681 12% 5,025 8% 811,344 6%<br />
Professional, scientific, & technical services 1,917 10% 420 3% 60 1% 963 16% 4,701 8% 1,164,306 9%<br />
Administrative & support & waste management &<br />
remediation service<br />
440 2% 752 6% 433 7% 388 7% 3,247 5% 1,013,925 8%<br />
Other services (except public administration) 1,097 6% 400 3% 236 4% 156 3% 3,021 5% 405,030 3%<br />
Information 1,040 5% 233 2% 82 1% 782 13% 2,464 4% 563,841 4%<br />
Real estate & rental & leasing 454 2% 268 2% 274 5% 148 3% 1,766 3% 273,899 2%<br />
Arts, entertainment, & recreation 1,098 6% 156 1% 175 3% 60 1% 2,023 3% 287,157 2%<br />
Educational services 170 1% 60 0% 60 1% 10 0% 417 1% 62,843 0%<br />
Mining - 0% - 0% - 0% - 0% - 0% 20,321 0%<br />
Utilities - 0% - 0% - 0% - 0% - 0% 57,461 0%<br />
Construction - 0% - 0% - 0% - 0% - 0% 870,334 7%<br />
Transportation & Warehousing - 0% - 0% - 0% - 0% - 0% 397,266 3%<br />
Finance & insurance - 0% - 0% - 0% - 0% - 0% 681,626 5%<br />
Management of companies & enterprises - 0% - 0% - 0% - 0% - 0% 267,738 2%<br />
Total 19,209 100% 12,206 100% 6,001 100% 5,872 100% 62,536 100% 12,598,723 100%<br />
Source: 2000 US Census<br />
101015<br />
SANTA CRUZ <strong>METRO</strong> SHORT RANGE TRANSIT PLAN WILBUR SMITH ASSOCIATES<br />
Page 1 - 7
INTRODUCTION<br />
Services Provided<br />
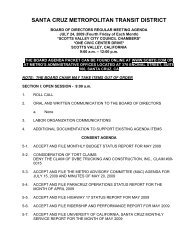
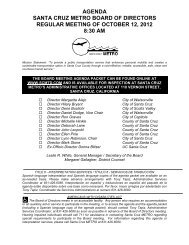
The <strong>Santa</strong> <strong>Cruz</strong> Metropolitan <strong>Transit</strong> District (<strong>METRO</strong>) is the fixed route and paratransit service provider for<br />
<strong>Santa</strong> <strong>Cruz</strong> County. Appendix A contains a summary of the history of the organization. A total of 39 routes<br />
are offered throughout <strong>Santa</strong> <strong>Cruz</strong> County and one regional service is offered into <strong>Santa</strong> Clara County. ADA<br />
paratransit is provided within ¾ miles from any of <strong>METRO</strong>’s fixed route services. These service areas are<br />
shown below in Figure 2-5.<br />
Figure 1- 5: Fixed Route and Paratransit Service Area<br />
Fixed Route<br />
Five types of fixed route services are provided to meet the various bus needs of the residents of <strong>Santa</strong> <strong>Cruz</strong><br />
County as shown in Table 1- 5 below. These categories were developed based on the differences in markets<br />
each type of route services and the differences in services frequencies/spans of service. Table 1- 6 and 2-7<br />
show a breakdown of the frequencies and span of services for each route by category.<br />
101015<br />
SANTA CRUZ <strong>METRO</strong> SHORT RANGE TRANSIT PLAN<br />
Page 1 - 8<br />
WILBUR SMITH ASSOCIATES
INTRODUCTION<br />
Table 1- 5: Fixed Route Classifications<br />
Route Type Description Route Numbers<br />
Rural Lifeline service outside urban boundaries 33, 34, 40, 41, 42, 72, 76<br />
Local / Feeder<br />
Intercity<br />
Urban routes which connect residential areas or<br />
major trip generators with transit centers<br />
Primary trunk lines with better than hourly<br />
service on arterial roads linking transit center or<br />
significant activity centers<br />
3, 4, 7, 9, 31, 32, 53, 54, 55, 56, 66, 68, 74, 75, 79, 88<br />
35, 69, 69A, 69W, 69N, 70, 71, 91<br />
UCSC Routes that connect to the UCSC campus 10, 12, 13, 15, 16, 19, 20<br />
Regional Routes that travel beyond <strong>Santa</strong> <strong>Cruz</strong> County 17<br />
Rural Routes: Rural routes provide service to rural areas of County in the <strong>Santa</strong> <strong>Cruz</strong> Mountains and outside<br />
Watsonville. These areas include the communities in the San Lorenzo Valley and Corralitos. Frequencies<br />
and span of service tends to be the lowest systemwide on these routes.<br />
Local / Feeder Routes: These routes are designed to provide bus service within the urban communities of<br />
the County. Frequencies and span of services tend to be higher than rural routes but lower than intercity and<br />
UCSC. The majority of these routes serve the cities of <strong>Santa</strong> <strong>Cruz</strong> and Watsonville.<br />
Intercity: Intercity routes are primarily focused on meeting the bus rider demands between the urban areas<br />
within the County including the <strong>Santa</strong> <strong>Cruz</strong> to Watsonville corridor and <strong>Santa</strong> <strong>Cruz</strong> to Scotts Valley corridor.<br />
A variety of service options (local stop to express) between <strong>Santa</strong> <strong>Cruz</strong> and Watsonville are offered to meet<br />
the various travel needs along the Highway 1 corridor. Intercity routes tend to have high service frequencies<br />
and high span of services.<br />
UCSC: Due to the high transit demands to the University of <strong>Santa</strong> <strong>Cruz</strong>, routes have been specially<br />
structured and assigned their own category of fixed routes service. The majority of these services are only<br />
offered during the University’s school term and are not in service during the summer months. The UCSC<br />
routes tend to have the highest ridership and productivity and experience a strong demand for bicycles. As a<br />
result, these routes tend to be the most frequent and have the longest running spans of service in the system.<br />
Regional: There is one regional route which provides service between <strong>Santa</strong> <strong>Cruz</strong> County and <strong>Santa</strong> Clara<br />
County along SR-17. This service connects the Downtown <strong>Santa</strong> <strong>Cruz</strong> <strong>METRO</strong> station with San Jose’s<br />
Diridon station servicing various park and ride lots and the Cavallaro <strong>Transit</strong> Center in Scotts Valley. At<br />
Diridon station, passengers can connect to the <strong>Santa</strong> Clara Valley Transportation Authority’s (VTA) transit<br />
system the Caltrain and Amtrak regional rail systems. Once at Diridon, transit passenger can connect to the<br />
San Jose airport using the VTA system.<br />
101015<br />
SANTA CRUZ <strong>METRO</strong> SHORT RANGE TRANSIT PLAN<br />
Page 1 - 9<br />
WILBUR SMITH ASSOCIATES
INTRODUCTION<br />
Table 1- 6: 2007 Weekday Service Headways and Span of Services<br />
Rural<br />
Route<br />
AM Peak Midday PM Peak Evening<br />
to 8:29 8:30-14:29 14:30-17:59 18:00 to<br />
Start Time<br />
End Time<br />
Span of<br />
Service<br />
33* Limited Service, Trips Per Day = 2 6:55 15:18 1:00<br />
34* Limited Service, Trips Per Day = 2 7:25 15:05 1:00<br />
40 Limited Service, Trips Per Day = 3 6:15 16:50 3:00<br />
41 Limited Service, Trips Per Day = 4 6:05 18:50 6:00<br />
42 Limited Service, Trips Per Day = 3 12:30 23:25 4:00<br />
72/76 60 60 60 60 5:40 19:38 14:00<br />
Local / Feeder<br />
3 60 60 60 60 6:50 19:28 13:00<br />
4 60 60 60 60 6:45 17:25 11:00<br />
7 60 60 60 60 8:50 18:18 10:00<br />
9 Limited Service, Trips Per Day = 2 7:35 14:57 1:00<br />
31 30 60 6:55 17:13 5:00<br />
32 Limited Service, Trips Per Day = 2 14:15 15:50 1:00<br />
53 120 120 9:05 17:55 4:00<br />
54 Limited Service, Trips Per Day = 2 7:05 19:00 1:00<br />
55 60 60 60 7:30 17:25 10:00<br />
56 120 120 120 8:05 17:00 5:00<br />
66 25-60 60 60 60-80 6:15 23:05 16:00<br />
68 60 60 60 60 6:30 19:20 12:00<br />
68N 60 18:30 23:30 5:00<br />
74 60 60 60 6:50 18:35 12:00<br />
75 60 60 60 60 6:09 21:02 15:00<br />
79 60 60 60 7:10 17:35 11:00<br />
88*** Limited Service, Trips Per Day = 4 6:05 18:35 3:00<br />
Intercity<br />
UCSC<br />
35 3-41. 30 30 28-75 5:53 23:45 18:00<br />
35A 30 30 30 25-75 6:30 0:08 17:30<br />
69 30-70 30 30 30 6:05 18:40 13:00<br />
69A 60 60 60 60 6:45 19:48 13:00<br />
69W 60 60 60 60 6:20 19:37 13:00<br />
69N 30 19:00 22:20 3:00<br />
70* 30 30 30 7:30 15:40 7:00<br />
71 30 15-30 15 30-60 5:40 0:45 18:00<br />
91 15-60 60 60 60 6:00 18:16 6:00<br />
10 30 30 30 30 6:55 19:05 12:00<br />
12* Limited Service, Trips Per Day = 1 7:10 8:07 1:00<br />
13* 60 60 60 60 7:20 19:07 12:00<br />
15* 14-28 6-53. 3-30. 9-41. 7:38 19:43 12:00<br />
16 30 5-30. 3-30. 15-30 6:25 2:14 20:00<br />
19* 30 30 30 30 7:30 0:11 17:00<br />
19N** 40 23:45 3:14 4:00<br />
20/20D 60 30-60 20-60 30 7:20 21:45 14:00<br />
Regional<br />
17 15-40 60-100 20-60 60-90 4:35 23:30 17:00<br />
* Route does not provide service or provides limited service when school (UCSC, Cabrillo, or San Lorenzo Valley) is not in service<br />
** Friday-Saturday Service : Limited Service Times<br />
*** Formerly Named 7N : No Service Times<br />
**** Service Operates Mid-November Through Mid-April Only<br />
Red italic text indicates AM time for the following day<br />
101015<br />
SANTA CRUZ <strong>METRO</strong> SHORT RANGE TRANSIT PLAN<br />
Page 1 - 10<br />
WILBUR SMITH ASSOCIATES
INTRODUCTION<br />
Table 1- 7: 2007 Weekend Service Headways and Span of Services<br />
Route<br />
AM Peak Midday PM Peak Evening<br />
to 8:29 8:30-14:29 14:30-17:59 18:00-21:59<br />
Start Time<br />
End Time<br />
Span of<br />
Service<br />
Rural<br />
33* 0:00<br />
34* 0:00<br />
40 Limited Service, Trips Per Day = 2 8:30 17:55 3:00<br />
41 Limited Service, Trips Per Day = 1 9:30 10:50 1:00<br />
42 Limited Service, Trips Per Day = 3 12:30 23:25 4:00<br />
72/76 60 60 60 6:40 18:40 12:00<br />
Local / Feeder<br />
3 0:00<br />
4 0:00<br />
7 0:00<br />
9 0:00<br />
31 0:00<br />
32 0:00<br />
53 0:00<br />
54 120 120 120 120 7:30 19:00 9:00<br />
55 0:00<br />
56 0:00<br />
66 60 60 60 60-80 7:00 23:05 16:00<br />
68 60 60 60 8:30 19:20 10:00<br />
68N 60 18:30 23:30 5:00<br />
74 0:00<br />
75 60 60 60 60 6:09 21:02 15:00<br />
79 0:00<br />
88**** Limited Service, Trips Per Day = 4 6:05 18:35 3:00<br />
Intercity<br />
35 60 30-60 30 30-71 7:02 23:21 16:00<br />
35A* 60 30-60 30 30-90 7:30 0:08 16:00<br />
69 Limited Service, Trips Per Day = 1 7:37 8:18 1:00<br />
69A 60 60 60 60 7:50 19:48 11:00<br />
69W 60 60 60 8:37 21:34 13:00<br />
69N 0:00<br />
70* 0:00<br />
71 30 30 30 30-60 6:05 22:30 17:00<br />
91<br />
UCSC<br />
Limited Service, Trips Per Day = 1 7:15 8:01 0:46<br />
100<br />
10 60 60 60 60 8:25 18:00 10:00<br />
12* 0:00<br />
13* 0:00<br />
15* 0:00<br />
16 60 15-60 15-30 15-45 7:05 3:15 20:00<br />
19* 60 60 60 9:30 19:11 10:00<br />
19N** 40 23:45 3:14 4:00<br />
20/20D 60 60 60 8:20 21:15 13:00<br />
Regional<br />
17 85-95 100 75-135 80-95 5:50 23:40 10:00<br />
* Route does not provide service or provides limited service when school (UCSC, Cabrillo, or San Lorenzo Valley) is not in service<br />
** Friday-Saturday Service : Limited Service Times<br />
*** Formerly Named 7N : No Service Times<br />
**** Service Operates Mid-November Through Mid-April Only<br />
Red italic text indicates AM time for the following day<br />
101015<br />
SANTA CRUZ <strong>METRO</strong> SHORT RANGE TRANSIT PLAN<br />
Page 1 - 11<br />
WILBUR SMITH ASSOCIATES
INTRODUCTION<br />
Para<strong>Cruz</strong><br />
Para<strong>Cruz</strong> is the public transportation system for seniors or the disabled who are unable to use the fixed route<br />
transit service. The service is compliant with the American with Disabilities Act of 1990 and services areas<br />
within a ¾ mile buffer of the fixed route service offered by <strong>METRO</strong>. Those registered in the program are<br />
eligible for shared ride, door-to-door pick up service from 6:00 AM until 10:30 PM every day except New<br />
Year’s Day, Thanksgiving, and Christmas Day. Trips must be booked between 1-14 days in advance between<br />
the hours of 8:00 AM and 5:00 PM. Following completion of a reservation, customers are given a “ready<br />
window” of 30 minutes (10 minutes before and 20 minutes after) their requested time. The cost is $3.00 per<br />
trip, twice the price of the regular fixed route fare.<br />
<strong>METRO</strong> took over the paratransit service from Community Bridges (private contractor) in November of<br />
2004. Minibus vehicles are used for the service which can accommodate wheelchairs and scooters less than<br />
30” by 48” and less than 600 pounds when occupied.<br />
Neighboring Services<br />
Monterey Salinas <strong>Transit</strong> (MST)<br />
Monterey-Salinas <strong>Transit</strong> (MST) is the fixed route and paratransit service provider for Monterey County.<br />
MST operates a total of 33 fixed-route services, providing service within ¾ of a mile to an estimated 352,000<br />
people. The service is structured to provide local and intercity service for Monterey Peninsula and Salinas<br />
Valley and rural services to the Carmel Valley, Big Sur, and coastal regions of the Monterey Peninsula. MST<br />
also runs service inland along the Highway 101 corridor to the cities of Chular, Gonzales, Greenfield,<br />
Soledad, and King City.<br />
Major transit centers within the MST system are located in the Cities of Monterey, Salinas, Seaside, Marina,<br />
and Watsonville. The Watsonville <strong>Transit</strong> Center, opened in 1995, provides transferring service to <strong>Santa</strong> <strong>Cruz</strong><br />
<strong>METRO</strong> bus lines. MST Routes 27, 28, and 29 that service the Watsonville <strong>Transit</strong> Center allow <strong>METRO</strong><br />
riders to make direct transfers on to Salinas, Castroville and Marina. Transfers can then be made at either the<br />
Marina or Salinas <strong>Transit</strong> center for continued service to the rest of Monterey County.<br />
MST offers free transfers to <strong>METRO</strong> routes for the travel to the North Zone 1 only. Transfers must be<br />
requested at time of payment for <strong>METRO</strong> fare and are not available at the Watsonville <strong>Transit</strong> Center. Day<br />
passes are also good for unlimited travel in the MST North Zone but <strong>METRO</strong> monthly pass holders must be<br />
accompanied by a transfer. <strong>METRO</strong> also accepts MST’s Courtesy Cards (senior and disabled passes) giving<br />
riders a discounted fare. MST accepts <strong>METRO</strong>’s senior rate payment even though the senior age is less than<br />
their own.<br />
A memorandum of understanding signed in 1989 by MST and <strong>METRO</strong> outlines a plan for both agencies to<br />
provide coordinated and efficient transit service to transit riders of Watsonville and the Pajaro Valley. Aside<br />
from fare arrangements mentioned above, the agreement also calls for MST and <strong>METRO</strong> staff to assist in<br />
directing passenger between the two systems and providing each others information in the respective rider<br />
guides.<br />
1 North Zone includes the communities of Watsonville, Marina, Prunedale, and Castroville.<br />
101015<br />
SANTA CRUZ <strong>METRO</strong> SHORT RANGE TRANSIT PLAN<br />
Page 1 - 12<br />
WILBUR SMITH ASSOCIATES
INTRODUCTION<br />
<strong>Santa</strong> Clara Valley Transportation Authority (VTA)<br />
Valley <strong>Transit</strong> Authority (VTA) provides bus, light-rail, paratransit and various shuttle services to the <strong>Santa</strong><br />
Clara County. Sixty-nine fixed-route bus services and three rail lines link the major communities including<br />
Mountain View, Sunnyvale, San Jose, Milpitas, Morgan Hill, and Gilroy.<br />
<strong>METRO</strong>’s Highway 17 Express service provides <strong>Santa</strong> <strong>Cruz</strong> and <strong>Santa</strong> Clara County residents with “overthe-hill”<br />
service between the two counties. Northbound passengers from <strong>Santa</strong> <strong>Cruz</strong> County can connect to<br />
VTA lines at either the Diridon Station or the Downtown <strong>Transit</strong> Plaza in San Jose. Since both of these<br />
locations serve as major transit terminals in the area, passengers have a number of options for bus, light rail<br />
and shuttle connections to most of <strong>Santa</strong> Clara County. The free Downtown DASH circulator shuttle is<br />
available at both of these locations at well.<br />
Fares paid into the <strong>METRO</strong> system for the Highway 17 bus results in free transfer to VTA system, but not<br />
the reverse to <strong>METRO</strong> from VTA. A single ride is $4, day pass $8 and monthly pass is $90.<br />
Altamonte Commuter Express (ACE)<br />
The Altamonte Commuter Express is a regional commuter rail system linking the Central Valley,<br />
Livermore/Amador Valley, and <strong>Santa</strong> Clara County. Four AM westbound and four PM eastbound trains<br />
provide commuters from the communities of Stockton, Lathrop, Manteca, Tracy, Livermore, Pleasanton, and<br />
Fremont connections to the major employment destination in the Silicon Valley. The final stop along the<br />
corridor is the Diridon Station in San Jose, allowing connections to the Highway 17 Express from <strong>Santa</strong> <strong>Cruz</strong><br />
County.<br />
Transfers at the Diridon Station to ACE are not timed with the Highway 17 Express and discounted fare<br />
transfer rates are not available.<br />
Caltrain<br />
Caltrain provides commuter rail service to 34 stations along a 77-mile corridor from San Francisco, through<br />
San Mateo and <strong>Santa</strong> Clara Counties to Gilroy. As of April 2 nd , 2007, 96 trains provide weekday northbound<br />
and southbound service. Along with the regular all-stop service, a limited stop and baby bullet option are<br />
available to commuters. The baby bullet allows travel to occur between San Francisco and San Jose in less<br />
than an hour.<br />
Caltrain services the Diridon Station in San Jose where the Highway 17 Express service from <strong>Santa</strong> <strong>Cruz</strong><br />
stops. This location allows passengers a train connection to San Francisco and San Mateo Counties<br />
(northbound) or Morgan Hill/Gilroy (southbound). Persons boarding with a Caltrain monthly ticket and<br />
Peninsula pass receive $4.50 credit towards a purchase of a HWY 17 day pass.<br />
Amtrak<br />
Amtrak’s Capitol Corridor service from Sacramento to San Jose is accessible via the Highway 17 Express.<br />
This commuter rail system provides service seven days a week to major destination in the East Bay and<br />
Sacramento Valley including Oakland, Berkeley, Martinez, Davis, Sacramento, and Auburn. Amtrak also<br />
provides motorcoach service from the Diridon Station south to San Luis Obispo and <strong>Santa</strong> Barbara.<br />
Organizational Structure<br />
The organization structure for <strong>METRO</strong> is shown below in Figures 2- 6 to 2- 15. Nine major departments<br />
exist within this structure that is overseen by the Board of Directors:<br />
• Office of the General Manager<br />
• District Counsel<br />
101015<br />
SANTA CRUZ <strong>METRO</strong> SHORT RANGE TRANSIT PLAN<br />
Page 1 - 13<br />
WILBUR SMITH ASSOCIATES
INTRODUCTION<br />
• Finance Department<br />
• Human Resources Department<br />
• Operations Department<br />
• Maintenance Department<br />
• Information Technology Department<br />
• Fleet Department<br />
• Facilities Department<br />
Figure 1- 6: <strong>METRO</strong> Organizational Chart - All Departments<br />
BOARD OF DIRECTORS<br />
OFFICE OF THE<br />
GENERAL MANAGER<br />
DISTRICT COUNSEL<br />
FINANCE<br />
DEPARTMENT<br />
HUMAN<br />
RESOURCES<br />
DEPARTMENT<br />
OPERATIONS<br />
DEPARTMENT<br />
MAINTENANCE<br />
DEPARTMENT<br />
INFORMATION<br />
TECHNOLOGY<br />
DEPARTMENT<br />
Figure 1- 7: <strong>METRO</strong> Organizational Chart - Office of the General Manager<br />
General Manager<br />
Assistant General Manager<br />
<strong>Transit</strong> <strong>Plan</strong>ner<br />
Grants/Legislative<br />
Administrative Services<br />
Project Manager<br />
Analyst<br />
Coordinator<br />
(MetroBase)<br />
<strong>Transit</strong> Surveyor<br />
Administrative Assistants<br />
<strong>Plan</strong>ning Intern<br />
101015<br />
SANTA CRUZ <strong>METRO</strong> SHORT RANGE TRANSIT PLAN<br />
Page 1 - 14<br />
WILBUR SMITH ASSOCIATES
INTRODUCTION<br />
Figure 1- 8: <strong>METRO</strong> Organizational Chart – Office of District Counsel<br />
District Counsel<br />
Legal Secretary<br />
Paralegal<br />
Claims Investigator I<br />
Figure 1- 9: <strong>METRO</strong> Organizational Chart – Office of Finance<br />
Finance Manager<br />
Finance Manager Advisor<br />
Accounting<br />
Technician/Senior<br />
Assistant<br />
Finance Manager<br />
Accounting<br />
Technician/Senior<br />
Accounting Specialist<br />
Payroll & Benefits<br />
Coordinator<br />
Figure 1- 10: <strong>METRO</strong> Organizational Chart – Human Resources Department<br />
Human Resources<br />
Manager<br />
Assistant Human Resources Manager<br />
Personnel Technician Benefits Coordinator Human Resources Specialist<br />
101015<br />
SANTA CRUZ <strong>METRO</strong> SHORT RANGE TRANSIT PLAN<br />
Page 1 - 15<br />
WILBUR SMITH ASSOCIATES
INTRODUCTION<br />
Figure 1- 11: <strong>METRO</strong> Organizational Chart – Information Technology Department<br />
Information Technology Manager<br />
Senior Systems Administrator<br />
Senior Information<br />
Technology Technician<br />
Senior Database Administrator<br />
Figure 1- 12: <strong>METRO</strong> Organizational Chart – Operations Department<br />
Operations Manager<br />
Administrative<br />
Assistant/Supv<br />
Administrative Assistant<br />
(Customer Service)<br />
Administrative Clerk I<br />
Revenue Collection<br />
Supervisor<br />
Base<br />
Superintendent<br />
Paratransit<br />
Administrator<br />
Ticket & Pass<br />
Program Specialist<br />
Customer Service<br />
Coordinator<br />
Payroll<br />
Specialist<br />
Schedule<br />
Analyst<br />
Clerk III<br />
Senior Customer<br />
Service Rep.<br />
<strong>Transit</strong> Supervisors<br />
Safety & Training<br />
Coordinator<br />
Paratransit<br />
Superintendent<br />
Paratransit<br />
Eligibility Coordinator<br />
Accessible<br />
Services Coordinator<br />
Customer Service<br />
Representatives<br />
Bus Operators<br />
Reservation &<br />
Scheduling Coord.<br />
Mechanic<br />
Safety &<br />
Training Coord.<br />
Dispatch/Schedulers<br />
Reservationists<br />
Van Operators<br />
101015<br />
SANTA CRUZ <strong>METRO</strong> SHORT RANGE TRANSIT PLAN<br />
Page 1 - 16<br />
WILBUR SMITH ASSOCIATES
INTRODUCTION<br />
Figure 1- 13: <strong>METRO</strong> Organizational Chart – Maintenance Department<br />
Maintenance<br />
Manager<br />
Administrative<br />
Buyer<br />
Assistant/Supv<br />
Senoir Accounting<br />
Senior Accounting<br />
Technician<br />
Technician<br />
Fleet Maint.<br />
Fleet Maint.<br />
Parts & Materials<br />
Facilities Maintenance<br />
Supervisor<br />
Supervisor<br />
Supervisor<br />
Supervisor<br />
Lead Mechanics<br />
Lead Mechanic<br />
Vehicle Service Techs<br />
Lead Parts Clerk<br />
Senior Facilities<br />
Lead Custodian<br />
Maintenance Worker<br />
Mechanics I/II/III<br />
Mechanics I/II<br />
Vehicle Service<br />
Parts Clerk<br />
Facilities Maintenance<br />
Custodial Services<br />
Upholsterer<br />
Workers I/II<br />
Receiving Parts Clerk<br />
Worker II<br />
Worker I<br />
Body Mechanic<br />
Facilities Maintenance<br />
Vehicle Service Detailers<br />
Worker I<br />
Figure 1- 14: <strong>METRO</strong> Organizational Chart – Fleet Department<br />
Maintenance<br />
Manager<br />
Administrative<br />
Assistant/Supv<br />
Buyer<br />
Senior Accounting<br />
Technician<br />
Senior Accounting<br />
Technician<br />
Fleet Maint.<br />
Fleet Maint.<br />
Parts & Materials<br />
Supervisor<br />
Supervisor<br />
Supervisor<br />
Lead Mechanic<br />
Day Shift<br />
Lead Mechanic<br />
Day - Unit Rebuild<br />
Lead Mechanic<br />
Graveyard Shift<br />
Lead Mechanic<br />
Swing Shift<br />
Vehicle Service Techs<br />
Lead Parts Clerk<br />
Mechanics I/II<br />
Mechanics III<br />
Mechanics I/II<br />
Mechanics I/II<br />
Vehicle Service<br />
Parts Clerk<br />
Vehicle Service Detailers<br />
Upholsterer<br />
Workers I/II<br />
Receiving Parts Clerk<br />
Body Mechanic<br />
101015<br />
SANTA CRUZ <strong>METRO</strong> SHORT RANGE TRANSIT PLAN<br />
Page 1 - 17<br />
WILBUR SMITH ASSOCIATES
INTRODUCTION<br />
Figure 1- 15: <strong>METRO</strong> Organizational Chart – Facilities Department<br />
Maintenance<br />
Manager<br />
Facilities Maintenance Supervisor<br />
Senior Facilities<br />
Maintenance Worker<br />
Lead Custodian<br />
Facilities Maintenance<br />
Worker II<br />
Facilities Maintenance<br />
Worker I<br />
Custodial Services<br />
Worker I<br />
Fare Structure<br />
The fixed route fare structures shown in Table 1- 8 below were effective as of July 1, 2004. Fares for the<br />
Highway 17 Express Service to <strong>Santa</strong> Clara County are shown in Table 1- 9. Paratransit fares are priced as<br />
twice the normal fixed-route cash fare, $3.00 per trip.<br />
Transfers between <strong>METRO</strong> buses are not free and require repayment for every bus boarded. Those making<br />
more than three trips in one day are encouraged to buy a day pass for $4.50 which will result in a cost savings<br />
for the rider. Free transfers are issued for those traveling to the North Zone areas of the Monterey-Salinas<br />
<strong>Transit</strong> area. Transfers to this service must be issued when the initial bus fare is paid and monthly passes are<br />
not honored by MST.<br />
Monthly adult, youth, and senior/disabled passes are good for unlimited rides on all routes in <strong>Santa</strong> <strong>Cruz</strong><br />
County except the Highway 17 Express. To qualify as a senior, riders must be 62 or older and be able to<br />
show proof of age. To qualify as disabled, riders must provide a MERTRO ID card or Medicare card. The<br />
Highway 17 Express monthly pass is good for unlimited rides on all <strong>METRO</strong>’s fixed route services and <strong>Santa</strong><br />
Clara buses and light rail.<br />
<strong>METRO</strong> currently has agreements with the University of California <strong>Santa</strong> <strong>Cruz</strong> (UCSC) and Cabrillo College<br />
to offer students and staff free transit service. Students and staff must present a valid identification card for<br />
their respective college or university at the time of boarding to use the free service. This “class pass”<br />
program eliminates the charge to the rider at the time of boarding but eventually reimburses <strong>METRO</strong> at a<br />
subsidized per trip rate as described in the agreement.<br />
101015<br />
SANTA CRUZ <strong>METRO</strong> SHORT RANGE TRANSIT PLAN<br />
Page 1 - 18<br />
WILBUR SMITH ASSOCIATES
INTRODUCTION<br />
Table 1- 8: 2007 Fixed Route Fares<br />
Cash Day Pass 5 Day Pass Monthly Pass<br />
Cash $1.50 $4.50 $22.00 $50.00<br />
Student<br />
above 46" or through the 12th grade<br />
Child<br />
less than 46" (three ride free with fare paying<br />
passenger)<br />
Senior<br />
62 + years<br />
$1.50 $4.50 $22.00 $35.00<br />
Free N.A. N.A. N.A.<br />
$0.75 $2.25 $11.25 $25.00<br />
Disabled $0.75 $2.25 $11.25 $25.00<br />
Table 1- 9: 2007 Highway 17 Express Fares<br />
Cash Day Pass Monthly Pass<br />
Cash $4.00 $8.00 $90.00<br />
Senior<br />
62 + years<br />
$2.00 N.A. N.A.<br />
Disabled $2.00 N.A. N.A.<br />
Fleet<br />
As of November of 2006, <strong>METRO</strong> had 113 revenue vehicles for fixed route services, 34 vehicles for<br />
paratransit services, and 61 non-revenue vehicles. Nearly all fixed route vehicles are 35 or 40 foot in length.<br />
Revenue vehicles have an average age of 10 years, paratransit 5.2 years, and non-revenue 7.8 years. A<br />
complete listing of these vehicles is shown in Appendix B.<br />
Facilities<br />
Four transit centers are currently used by <strong>METRO</strong> as hub or transfer locations for their fixed routes services.<br />
The two primary centers, which nearly all routes service, are the <strong>Santa</strong> <strong>Cruz</strong> <strong>Transit</strong> Center located in<br />
Downtown <strong>Santa</strong> <strong>Cruz</strong> and the Watsonville <strong>Transit</strong> Center located in Downtown Watsonville. Both of these<br />
facilities contain a large number of bus bays to allow layover and transferring activities to occur. They also<br />
include a high level of customer amenities including food vendors, customer service agents, and seating.<br />
The secondary transit centers are located in Felton and Capitola. The Felton center is located at Felton Faire<br />
just north of Mt. Hermon Road. The Capitola <strong>Transit</strong> Center is located at the Capitola Mall on 41 st Street.<br />
Both of these facilities have fewer customer amenities but provide key transfer points for <strong>METRO</strong>’s fixed<br />
routes services.<br />
The District is also in the process of constructing the new MetroBase <strong>Transit</strong> facility on River Street and Golf<br />
Course Drive. The new facility will be the central location for operations and maintenance of <strong>METRO</strong>’s bus<br />
fleet. The facility will contain the following components:<br />
• Liquified Compression Natural Gas (LCNG) fueling station<br />
101015<br />
SANTA CRUZ <strong>METRO</strong> SHORT RANGE TRANSIT PLAN<br />
Page 1 - 19<br />
WILBUR SMITH ASSOCIATES
INTRODUCTION<br />
• Bus washing structure<br />
• A second story addition to the current building<br />
• Reconfigured parking and circulation<br />
Completion of the facility is scheduled for 2010.<br />
Website<br />
The District currently offers a website dedicated to providing transit information to the residents of <strong>Santa</strong><br />
<strong>Cruz</strong> County. The website is also a medium for obtaining citizen feedback on the current service offered by<br />
<strong>METRO</strong>. The major information areas on the page include; System Information, Schedules, Contact Us,<br />
News, Board, Bids, Jobs, Links, MetroBase, and Para<strong>Cruz</strong>. <strong>METRO</strong>’s website has been in existence since<br />
1996 and is currently being reevaluated to determine changes that will meet the needs of their current users.<br />
This assessment can be found in Appendix C of this report.<br />
101015<br />
SANTA CRUZ <strong>METRO</strong> SHORT RANGE TRANSIT PLAN<br />
Page 1 - 20<br />
WILBUR SMITH ASSOCIATES
CHAPTER 2: BACKGROUND<br />
BACKGROUND REPORTS<br />
The following studies were reviewed in the SRTP development process. These documents address issues that<br />
directly or indirectly effect operations at <strong>METRO</strong> and in some way impact the operational conditions. The<br />
documents reviewed include:<br />
• Regional Transportation <strong>Plan</strong> (2005) - <strong>Santa</strong> <strong>Cruz</strong> Regional Transportation Commission (RTC)<br />
• Metropolitan Transportation <strong>Plan</strong> (MTP) (2005) – Association of Monterey Bay Area Governments<br />
(AMBAG)<br />
• City of <strong>Santa</strong> <strong>Cruz</strong> Master Transportation Study (2003) - Fukuji <strong>Plan</strong>ning & Design<br />
• ADA Complementary Paratransit Comprehensive Operational and Financial Audit (2000)-<br />
Multisystems<br />
• UCSC Comprehensive <strong>Transit</strong> Study (2003) – Urbitran<br />
• UCSC Long <strong>Range</strong> Development <strong>Plan</strong> (2005-2020) - University of <strong>Santa</strong> <strong>Cruz</strong><br />
• Major Transportation Investment Study (1997) – <strong>Santa</strong> <strong>Cruz</strong> Regional Transportation Commission<br />
Regional Transportation <strong>Plan</strong> (2005)<br />
The RTC is the transportation planning agency for <strong>Santa</strong> <strong>Cruz</strong> County that is primarily responsible for<br />
prioritizing capital investments in transportation infrastructure for all modes of transportation including<br />
autos, transit, bikes and pedestrians. The RTP is the long range planning document mandated by the state of<br />
California to guide transportation funding decision for the planning region. The 2005 plan identifies goals,<br />
projects and programs that will improve and maintain the County’s transportation system over the next 25<br />
years. The plan further identifies specific projects to meet these goals.<br />
The overall theme that developed in the plan focused on the increasing traffic congestion and the increasing<br />
competition for limited transportation dollars. A number of key points were highlighted, including:<br />
• <strong>Santa</strong> <strong>Cruz</strong> County has a rich multi-modal transportation network<br />
• Traffic in <strong>Santa</strong> <strong>Cruz</strong> is worsening<br />
• <strong>Transit</strong> service is limited by available revenues<br />
• Maintenance needs for the existing transportation network are increasing<br />
• The complexity of transportation solutions is increasing<br />
• All transportation modes and facilities are subsidized with public funding generated from tax<br />
revenues<br />
• Since 1998 the RTC has gained more control of the local share of state and federal funds<br />
• The ebb and flow of federal, regional and local funding affects project timing<br />
• Existing funds are insufficient<br />
• Reaching consensus on transportation improvements is difficult<br />
101015<br />
SANTA CRUZ SHORT RANGE TRANSIT PLAN<br />
Page 2 - 1<br />
WILBUR SMITH ASSOCIATES
BACKGROUND<br />
Metropolitan Transportation <strong>Plan</strong> (2005) - AMBAG<br />
AMBAG is the metropolitan planning organization (MPO) for the three-county Monterey Bay region<br />
including <strong>Santa</strong> <strong>Cruz</strong> County, Monterey County and San Benito County. Federal regulations requires<br />
AMBAG to develop a long-range transportation plan that is both financially constrained and falls under the<br />
on-road motor vehicle emissions budget included in the Federal Air Quality Maintenance <strong>Plan</strong>. The plan<br />
provides the financial element which demonstrates how various transportation improvement projects can be<br />
implemented with the region’s available resources.<br />
The constrained action element of the plan for 2005-2030 for the three-county region allocated 25.3% of all<br />
project funding to transit. <strong>Transit</strong> was second only to vehicle flow which received 34.4% of the total funding.<br />
Forty different projects were identified for <strong>METRO</strong> in the constrained scenario. The majority of the funding<br />
for these 40 projects was allocated to four major areas; general transit service operations and maintenance<br />
($850 million) local service restoration and expansion ($67.75 million), the MetroBase facility ($42.8 million)<br />
and bus replacements for 2018-2030 ($40 million).<br />
City of <strong>Santa</strong> <strong>Cruz</strong> Master Transportation Study (2003)<br />
The Master Transportation Study (MTS) was a joint planning effort between the City of <strong>Santa</strong> <strong>Cruz</strong> and the<br />
University of California <strong>Santa</strong> <strong>Cruz</strong> to develop a community-based approach to shaping the future<br />
transportation system. The four main objectives from the planning process included:<br />
• Expand and offer new travel choices for people who live, work, play and visit <strong>Santa</strong> <strong>Cruz</strong><br />
• Provide relief for citywide vehicle traffic congestion<br />
• Enhance community livability<br />
• Achieve a sustainable transportation future<br />
The key challenges were identified as addressing future traffic growth and reducing peak-hour single occupant<br />
vehicle trips. The study went on to make a number of short-term and long-term recommendations to achieve<br />
the objectives of the study. The short-term (5-year) strategies that are specific to transit include:<br />
• Give right-of-way priority to transit through incremental Bus Rapid <strong>Transit</strong> (BRT) improvements<br />
that lead to a long-term BRT system. Incremental improvements include bus queue jump lanes,<br />
transit priority signalization, pre-payment of transit fares and reversible parking and travel lanes.<br />
• Refine and build on the successes of the existing <strong>METRO</strong> system.<br />
• Augment key transit services of the existing transit system to offer a core, high frequency limitedtransfer<br />
transit network serving activity centers & region.<br />
• Develop Metro Base; it is required for the successful implementation of expanded and improved<br />
transit services.<br />
• At this time, a Bus Rapid <strong>Transit</strong> (BRT) system is the most flexible and cost effective transit<br />
technology to apply to <strong>Santa</strong> <strong>Cruz</strong>. It is a technology that can address both the regional mobility<br />
challenge of Highway 1 congestion, and the low-density distribution countywide and growth of<br />
development in South <strong>Santa</strong> <strong>Cruz</strong> County. Bus Rapid <strong>Transit</strong> is a system that combines the quality of<br />
rail line with the flexibility of buses. It can operate on ordinary city streets, exclusive transit ways or<br />
HOV lanes with priority for transit being the key component. A BRT system combines intelligent<br />
transportation systems technology, cleaner and quieter vehicles, rapid and convenient fare collection,<br />
and integration with land use policy.<br />
101015<br />
SANTA CRUZ SHORT RANGE TRANSIT PLAN<br />
Page 2 - 2<br />
WILBUR SMITH ASSOCIATES
BACKGROUND<br />
Part of the short term strategies also evaluated <strong>METRO</strong>’s route structure in some depth. The following route<br />
modifications were discussed to increase ridership:<br />
• Eastside — UCSC Connector. Provide a direct, high frequency, local and express service to bypass<br />
downtown between UCSC and East Side residential neighborhoods with service extended to Cabrillo<br />
College.<br />
• North — South Central Route. Provide a direct, high frequency service along the City's central<br />
north-south area connecting the Harvey West, Downtown, Metro Center and Boardwalk areas.<br />
• East — West Connector. Provide direct, east - west transit route with limited stop express and local<br />
service linking the West Side residential neighborhoods, Mission Street retail, <strong>Santa</strong> <strong>Cruz</strong> High<br />
School, the Downtown, Soquel Avenue retail, East Side, and residential neighborhoods, with Cabrillo<br />
College.<br />
• Ocean Street Hotel/Beach Shuttle. Seasonal, weekend shuttle providing 30-minute service<br />
between the Ocean Street hotels and the Boardwalk area.<br />
The short-term strategies focused primarily on local City of <strong>Santa</strong> <strong>Cruz</strong> needs and didn’t address the regional<br />
transportation issues the County is currently faced with. The long-term strategies took these factors into<br />
consideration and developed the following options:<br />
• <strong>Transit</strong> and carpooling offer the greatest promise for traffic reduction through mode shift from<br />
SOVs.<br />
• Based on the travel analysis, to achieve no future growth in vehicle traffic in the year 2020 from year<br />
2000 levels, transit ridership levels need to increase for the external, commute in and out, and<br />
regional trips. For a transit emphasis solution, external transit mode splits need to increase from 3.8<br />
% to an average of 8.6% (5.3% commute out and 11.8% commute in), a 125% increase by 2020.<br />
• To achieve this level transit mode split, the City can benefit from a regional transit strategy, however<br />
any regional transit strategy must address both the regional mobility challenge of the high levels of<br />
vehicle traffic on Highway 1, and the low density distribution and growth of development in South<br />
<strong>Santa</strong> <strong>Cruz</strong> County.<br />
• At this time, a Bus Rapid <strong>Transit</strong> (BRT) system is the most flexible and cost effective transit<br />
technology for the <strong>Santa</strong> <strong>Cruz</strong> region.<br />
• At this time there are three potential rights-of-way available to implement future high occupancy,<br />
high frequency BRT technology that can address regional mobility and growth challenges: the rail<br />
corridor, local arterial streets and Highway 1.<br />
• The Rail Corridor right-of-way option must be preserved for higher occupancy transit services, and<br />
pursued to achieve project funding in conjunction with whatever effort is made to modify Highway<br />
1.<br />
• Environmental analysis needs to be conducted to ensure HOV proposals are sensitive to City needs<br />
and the MTS vision including the effect on local streets, single occupancy vehicle use and land use<br />
impacts.<br />
• The most efficient spatial configuration is to have high occupancy, high frequency, and minimum<br />
transfer service along direct routes linking major local and regional activity centers.<br />
• Future growth of UCSC, beyond assumptions projected in this document, will require consideration<br />
of a new connection to an enhanced regional transit system. Any new connection must be designed<br />
and engineered for environmental sensitivity.<br />
101015<br />
SANTA CRUZ SHORT RANGE TRANSIT PLAN<br />
Page 2 - 3<br />
WILBUR SMITH ASSOCIATES
BACKGROUND<br />
• In the future, the city should continue to consider the application of new, innovative technologies to<br />
increase local and regional transit ridership. Possible options are discussed in the following sections<br />
of this report.<br />
ADA Complementary Paratransit Comprehensive Operational and Financial Audit<br />
(2000)<br />
Under the Americans with Disabilities Act of 1990 (ADA) <strong>METRO</strong> is required to provide complementary<br />
paratransit service for persons with disabilities. Prior to 2004, <strong>METRO</strong> contracted out its paratransit services.<br />
At the time this study was complete, Food and Nutrition Services (FNS) was the provider of paratransit<br />
services. The 2000 comprehensive operational and financial audit was completed to assess the following<br />
areas of the paratransit program:<br />
• The current ADA eligibility process<br />
• The service quality experienced by customers<br />
• Service quality, including vehicles, drivers, and performance standards<br />
• The reservations, scheduling and dispatch service provided under this contract<br />
• The administration of the program by FNS<br />
• The subcontractor’s performance, compliance and reporting<br />
• The contract for thoroughness<br />
• The internal cost allocation of FNS and the accuracy of billings<br />
• Compliance with the ADA regulatory requirements<br />
Since paratransit operations are now provided by <strong>METRO</strong>, the following summary of the study’s results will<br />
exclude those finding relating to contract with FNS. The findings and recommendations for the other areas<br />
of focus were filtered to its applicability for the SRTP and presented below.<br />
Current ADA eligibility process. The eligibility process was found to be brief and did not ask if the<br />
applicant was unable to use fixed route services. It was recommended that <strong>METRO</strong> look into ways to more<br />
thoroughly verify ADA eligibility and to more strictly apply the eligibility criteria as described in the ADA<br />
regulations.<br />
Service quality experienced by customers. Scheduling Assistants appear to be professional and interact<br />
well with customers. Implementing automated scheduling may increase scheduling efficiency, but may impact<br />
customers by increasing ride times and grouping more trips.<br />
Service quality, including vehicles, drivers, and performance standards. The vehicle fleet and driver<br />
quality was found to vary based upon the provider of the service. A closer monitoring program for the<br />
personnel and a training program were suggested to improve driver performance.<br />
The on-time performance standards were shown be met but these standards were also recognized as being<br />
excessive. It was recommended that the current 45-minute window (-15 to +30) was revised to a 30-minute<br />
window (-30 to 0). It was also recommended that on-street monitoring and support for vehicles be<br />
implemented.<br />
101015<br />
SANTA CRUZ SHORT RANGE TRANSIT PLAN<br />
Page 2 - 4<br />
WILBUR SMITH ASSOCIATES
BACKGROUND<br />
The reservations, scheduling and dispatch service provided under this contract. Overall, reservations,<br />
scheduling, and dispatch operate well. Areas to improve upon include:<br />
• Improve timeliness of will call trips<br />
• Improve communication between scheduling assistants and dispatch<br />
• Manual scheduling procedures have resulted in denials, overcrowding and under-crowding due to the<br />
lack of real-time information for the scheduling assistants.<br />
UCSC Comprehensive <strong>Transit</strong> Study (2003)<br />
The 2003 Comprehensive <strong>Transit</strong> Study completed for UCSC evaluated how well transit services to and<br />
through the main campus and off-campus were meeting the existing needs and anticipated future needs. The<br />
study was completed in cooperation with <strong>METRO</strong> and presented to their Board in January of 2004.<br />
Recommendations were used in the creation of the University’s 2005 Long <strong>Range</strong> Development <strong>Plan</strong>.<br />
The general conclusion for the study showed that the University must plan for significant increases in transit<br />
demand, especially internal transit trips. The internal demand was addressed by a series of modifications to<br />
the campus shuttle buses. The external demand was addressed by suggested changes to the <strong>METRO</strong> service.<br />
The following recommendations were suggested:<br />
• Route #22: Add a stop on Laurel Street, reschedule to coordinate with class change times<br />
• Routes #15/16: Add two vehicles to meet increasing demands<br />
• Route #20: Improve frequency to every 60 minutes; add evening service until 10 PM<br />
• Explore the possibility of a new service from UCSC to serve Ocean Street, Cabrillo College, and<br />
Aptos, that would bypass the <strong>Santa</strong> <strong>Cruz</strong> <strong>METRO</strong> Center<br />
UCSC Long <strong>Range</strong> Development <strong>Plan</strong> (2005-2020)<br />
The LRDP provides UCSC with a comprehensive framework for the physical development of the UC <strong>Santa</strong><br />
<strong>Cruz</strong> campus over a 15-year planning period. The document includes a land use plan that is structured to<br />
meet the academic and institutional objectives of the campus. The LRDP was accompanied by an<br />
Environmental Impact Report as required by the California Environmental Quality Act (CEQA).<br />
The 2005 plan represents an increase in student enrollment to 19,500, an additional 5,100 students over the<br />
2003-04 total enrollment. The circulation impacts associated with this increase were addressed in the plan<br />
and many solutions involved the continued utilization of <strong>METRO</strong>’s services. The key aspects of the plan for<br />
the transit network include:<br />
• Currently 40% of all trips to campus are made through single occupancy vehicles<br />
• UCSC is the primary contributor to the public transit system, contributing $2 million a year in rider<br />
fees to <strong>METRO</strong>.<br />
• The LRDP calls for an interconnected network of transit routes with a transit hub located at east and<br />
west peripheral lots. Campus shuttles will continue to serve the inter-campus transit needs and<br />
<strong>METRO</strong> will provide off-campus and regional transit travel. BRT solutions, such as queue jump<br />
lanes or transit-priority traffic signals, may be installed to allow buses to bypass vehicles at congested<br />
intersections.<br />
• A third entry to campus is proposed along Empire Grade to provide emergency egress to the west<br />
101015<br />
SANTA CRUZ SHORT RANGE TRANSIT PLAN<br />
Page 2 - 5<br />
WILBUR SMITH ASSOCIATES
• UCSC supports an Eastern Access route to campus.<br />
BACKGROUND<br />
• The LRDP calls for an extension of Meyer Drive to Hagar Drive, and Hagar Drive to Coolidge<br />
Drive, creating critical cross-campus links.<br />
• The LRDP call for an additional 2,100 parking spaces to meet anticipated parking demands<br />
Major Transportation Investment Study (1997)<br />
The MTIS is a long-term investment study for the Watsonville to <strong>Santa</strong> <strong>Cruz</strong> to UCSC Campus corridor to<br />
determine the best investment strategy for the future travel needs of the corridor. The recommended<br />
investment strategy was based on a new ¼ cent sales tax and a federal earmark to construct a busway and<br />
bikeway project in the <strong>Santa</strong> <strong>Cruz</strong> Branch Line right-of-way between Natural Bridges and State Park Drive by<br />
the year 2006. The technical tasks of the project included; public participation, travel model development,<br />
screening of alternatives, travel forecasts, transportation impacts, environmental scan, capital and operating<br />
and maintenance costs, financial analysis, MTIS report, and an intercity recreational rail study.<br />
To date, there is still no clear consensus from the general public or the Regional Transportation Commission<br />
on what the best alternative is to dealing with the future travel needs along this corridor. The field is split<br />
between widening the highway for carpool and bus travel and implementing rail service in the corridor.<br />
There is also a “do nothing” group that doesn’t support any changes in the corridor.<br />
The impacts to transit that resulted from the analysis showed Alternative 8, Improve Bus Service, as achieving<br />
the greatest transit mode share of travel in the corridor. This alternative includes adding new express bus<br />
service to <strong>Santa</strong> <strong>Cruz</strong>, California State University at Monterey Bay, and San Jose. New local service would be<br />
added in Watsonville, Harvey West, Aptos, Capitola, San Lorenzo Valley, and the west side of <strong>Santa</strong> <strong>Cruz</strong> and<br />
the UCSC campus. <strong>METRO</strong>’s bus fleet could exceed 150 vehicles plus needed spares.<br />
Even under the Improve Bus Service scenario, the transit mode share was only estimated to be 2.73% of all<br />
trips. This is well below the County’s transit mode split goal of 10%. The results show UCSC as having the<br />
greatest growth in transit usage and capturing the highest number of transit trips. Downtown Watsonville<br />
was estimated to have the least number of trips made by transit. Overall, 83% of boardings were forecasted<br />
to occur between the UCSC campus and Capitola.<br />
Summary of Background Reports<br />
In general, the following assumptions were developed from the reviewed transportation studies in <strong>Santa</strong> <strong>Cruz</strong><br />
County.<br />
• Traffic conditions are worsening<br />
• There is a competition of funds and interests for the various modes of travel in <strong>Santa</strong> <strong>Cruz</strong> County<br />
• Peak-hour single occupant trips could be reduced through increases in transit use<br />
• BRT is a reasonable approach to increasing transit capacity and use<br />
• UCSC, already a major consumer of transit, will continue to expand and thus contribute to increased<br />
transit use<br />
The previous transportation improvement studies reviewed above offer a number of valuable<br />
recommendations, which were taken into consideration during the development of this SRTP. As long as<br />
traffic levels continue to increase in <strong>Santa</strong> <strong>Cruz</strong> County and single-occupant automobile travel continues to be<br />
the preferred method of travel, roadway congestion will worsen. Solutions to these issues offered by previous<br />
101015<br />
SANTA CRUZ SHORT RANGE TRANSIT PLAN<br />
Page 2 - 6<br />
WILBUR SMITH ASSOCIATES
BACKGROUND<br />
studies favor an investment in transit, specifically BRT, which offers a cost-effective solution to increasing<br />
capacity and improving the attractiveness of transit. While BRT appears to be a preferred transit solution,<br />
competing interests and funds within the County have failed to create an environment where transit trumps<br />
other modes of travel to the point of bypassing congestion. Specifically, high-frequency corridors that would<br />
lend itself well for a BRT type transit service for <strong>METRO</strong> such as Highway 1 between Watsonville and <strong>Santa</strong><br />
<strong>Cruz</strong> and the Laurel-Mission-Bay Street corridor between downtown <strong>Santa</strong> <strong>Cruz</strong> and UCSC are still forced to<br />
run mixed-flow, subjected to all the same congestion constraints of other motorist.<br />
PUBLIC OUTREACH<br />
Public outreach is an essential component to a good community-based planning effort. The creation of the<br />
SRTP provided an ideal opportunity to reach out to the community and stakeholders to determine the<br />
strengths and weaknesses of <strong>METRO</strong> and identify changes that could be made to improve upon the<br />
identified deficiencies. This information provides essential qualitative insight that can then be paired with the<br />
quantitative performance assessment to accurately depict the current conditions of the system.<br />
To focus the outreach efforts, various user groups were identified at the onset of the project. These groups<br />
were identified based on current usage patterns and dependence of the system for their day to day travels.<br />
Other groups were identified because they either had service and don’t use it or they are currently lacking<br />
service.<br />
Reaching out to these key stakeholders and users of the system is often times challenging. Recognizing that<br />
differing demographics use various methods to communicate, the outreach plan used multiple formats and<br />
mediums to gain the necessary information. Table 2- 1 below shows the groups who participated in the<br />
outreach and the techniques used to gain their input.<br />
Table 2- 1: Outreach Groups and Methods Used<br />
Group<br />
<strong>Transit</strong> Stakeholders<br />
<strong>Transit</strong> Passengers<br />
<strong>Transit</strong> Drivers (Metro fixed-route bus drivers)<br />
Local communities (Watsonville, Capitola)<br />
Cabrillo College (student, staff and faculty)<br />
Outreach Method<br />
Face-to-face interviews<br />
On-board surveys / intercept surveys<br />
Face-to-face interviews<br />
Community meetings<br />
Online survey<br />
Stakeholder Interviews<br />
The majority of stakeholder interviews were conducted at the onset of the project during the 2nd week of<br />
January, 2007. Follow up interviews with remaining stakeholders were conducted in February and March<br />
2007. Those interviewed included elected officials, regional and community agencies, local business<br />
communities, educational institutions, and MAC members. Our understanding with each of the stakeholders<br />
interviewed was that their individual responses would be confidential, but that we would include all of the<br />
important comments as part of an overall evaluation.<br />
A summary of the included stakeholders and their input can be found in Appendix D. Significant findings<br />
from the stakeholder interviews included:<br />
• <strong>Santa</strong> <strong>Cruz</strong> local service caters toward downtown and UCSC and may be overlooking service worker<br />
travel needs or potential tourist market<br />
101015<br />
SANTA CRUZ SHORT RANGE TRANSIT PLAN<br />
Page 2 - 7<br />
WILBUR SMITH ASSOCIATES
• More local services for Watsonville, Capitola and Scotts Valley<br />
• Increase service to Cabrillo College and its link to UCSC<br />
• Traffic congestion hinders <strong>METRO</strong>’s performance<br />
BACKGROUND<br />
• <strong>METRO</strong> staff does not do much in the way of advertising and/or marketing and therefore is not<br />
looking to service new potential markets.<br />
• Long distances services (Highway 17 Express/Connections to Watsonville) are generally good but<br />
could be improved by decreasing travel time and increasing span of service.<br />
<strong>Transit</strong> Passenger Surveys<br />
<strong>METRO</strong> current riders are perhaps the most important source of information when it comes to assessing<br />
performance of the agency. Two different approaches were taken to gain insight from this user group. The<br />
first, and most intensive of all the outreach efforts, was an on-board survey. This technique placed a surveyor<br />
on various buses throughout the <strong>METRO</strong> system and asked riders if they would take a voluntary and<br />
confidential survey while they ride. The survey was distributed as a hard copy for them to fill out. Assistance<br />
was given to the rider by the surveyor if requested.<br />
The survey captured responses from 1,902 weekday riders over a three day period in March of 2007.<br />
Fourteen questions were asked of the riders including basic demographic information, origin/destination of<br />
transit trip, purpose of trip, and preference ratings for various attributes of the system. One side of the<br />
questionnaire was in English and the other side was translated into Spanish. A copy of the questionnaire, a<br />
detailed summary of the results, and mapped trips from origin locations from the four incorporated cities can<br />
be found in Appendix D.<br />
Significant findings from the onboard survey included:<br />
• The majority of the trips were home-based trips used for school and work, with just under half of all<br />
trips made for school purposes<br />
• Over ¾ of riders walked to the starting point of their transit trip<br />
• The most common payment methods for the bus are the UC pass (33%), cash (26%), and a monthly<br />
pass (19%)<br />
• 2/3 of transit riders do not own a vehicle and 57% do not have access to a vehicle<br />
• Just under half of all riders are ages 18-23<br />
• Only ¼ of riders are employed full-time and nearly half make less than $10,000<br />
• On-time arrivals was rated the lowest of the performance attributes and bus maintenance was rated<br />
the highest<br />
Bus Driver Interviews<br />
WSA held interview sessions with <strong>METRO</strong> bus drivers on May 2 nd , 2007 at the <strong>Santa</strong> <strong>Cruz</strong> <strong>Transit</strong> Center<br />
and the Bus Maintenance Facility on River Street. Four representatives (two located at each site) sat down<br />
with drivers during their breaks and discussed issues the drivers felt were important to include in the <strong>Short</strong><br />
101015<br />
SANTA CRUZ SHORT RANGE TRANSIT PLAN<br />
Page 2 - 8<br />
WILBUR SMITH ASSOCIATES
BACKGROUND<br />
<strong>Range</strong> <strong>Transit</strong> <strong>Plan</strong> process. The interviewers were equipped with a questionnaire but the drivers were<br />
encouraged to discuss any issues they felt were relative.<br />
Those drivers that could not participate in the afternoon interview session were asked to submit letters or<br />
emails to the consultant. These submittals were compiled with the interview feedback.<br />
WSA held interview sessions with <strong>METRO</strong> bus drivers on May 2 nd , 2007 at the <strong>Santa</strong> <strong>Cruz</strong> <strong>Transit</strong> Center<br />
and the Bus Maintenance Facility on River Street. Four representatives (two located at each site) sat down<br />
with drivers during their breaks and discussed issues the drivers felt were important to include in the <strong>Short</strong><br />
<strong>Range</strong> <strong>Transit</strong> <strong>Plan</strong> process. The interviewers were equipped with a questionnaire but the drivers were<br />
encouraged to discuss any issues they felt were relative.<br />
Two important ideas were raised during these discussions:<br />
• An investment by <strong>METRO</strong> in technology to record and measure performance for services would be<br />
beneficial. That way there would be a consistent resource to record information, provide information<br />
to customers and measure and monitor performance. Of particular importance is the ability to record<br />
on time performance. On time performance of services is affected by increasing congestion on major<br />
trunk lines.<br />
• The operators believe that <strong>METRO</strong> service would be enhanced by regular communication forums<br />
being established between planning and operations to discuss route and service opportunities.<br />
Those drivers that could not participate in the afternoon interview session were asked to submit letters or<br />
emails to the consultant. These submittals were compiled with the interview feedback. A summary of the<br />
Community Focus Groups<br />
The communities of Watsonville and Capitola were identified as communities where outreach was needed as<br />
part of the SRTP development process. Watsonville is a community where it was felt more local service was<br />
needed for the growing population and Capitola was an area where local service was provided but not<br />
necessarily used. These outreach efforts were conducted to obtain feedback from the communities on how<br />
transit service could better serve their travel needs.<br />
Watsonville<br />
WSA conducted a focus group with non-users of the transit service in the community of Watsonville on<br />
Wednesday, May 16 2006. The focus group was held at the La Manzana Community Resources Center, a<br />
bilingual, bicultural community resource center serving mostly low-income residents of Watsonville and<br />
Pajaro Valley.<br />
The purpose of this focus group was threefold: 1) to identify if the members of the community were aware of<br />
<strong>METRO</strong> service in the City of Watsonville and the surrounding areas, 2) to identify the major reasons why<br />
<strong>METRO</strong> service is not currently used, and 3) to identify what service changes would increase the use of<br />
transit. The participants were a representative group of the Watsonville community, comprised of users and<br />
non-users, working class and low-income agricultural workers.<br />
A detailed summary of the focus group can be found in Appendix D. The general recommendations that<br />
were developed from the session include:<br />
• Provide an express route between Watsonville and Downtown <strong>Santa</strong> <strong>Cruz</strong><br />
• Provide more information about bus scheduling and stop locations<br />
101015<br />
SANTA CRUZ SHORT RANGE TRANSIT PLAN<br />
Page 2 - 9<br />
WILBUR SMITH ASSOCIATES
BACKGROUND<br />
• Provide bus shelters. The majority of bus stops are only designated by a pole with the route number<br />
and provide no weather protection<br />
• Provide good lighting and emergency phones at bus stop locations in remote areas<br />
• Widely advertise service changes to bus routes (via mailers, on board and bus stop postings)<br />
• Introduce a discounted bus fare price for children<br />
• Introduce a bus transfer system<br />
• Provide more bilingual bus drivers<br />
Capitola<br />
WSA conducted a focus group with non-users of the transit service in the community of Capitola on<br />
Thursday, May 17, 2007. The focus group was held during the evening hours at Capitola City Hall. Working<br />
with community leaders, 15 individuals were asked to participate and all attended. The participants were a<br />
representative group of the Capitola community, comprised of users and non-users, owners and renters.<br />
The purpose of this focus group was threefold: 1) to identify if the members of the community were aware of<br />
<strong>METRO</strong> service in the City of Capitola and the surrounding areas, 2) to identify the major reasons why<br />
<strong>METRO</strong> service is not currently used, and 3) to identify what service changes would increase the use of<br />
transit.<br />
A detailed summary of the focus group can be found in Appendix D. The majority of the discussion at the<br />
session focused on providing a local shuttle/connector to improve mobility for the residents and tourists of<br />
the community. The general recommendations that were developed from the session include:<br />
• Implement a trolley/circulator shuttle for the local trips within Capitola<br />
• Serve more destinations directly, bypass transfer station at the Capitola Mall<br />
• Provide more rider information, pre-trip and at the station<br />
• Invest in environmentally clean buses to reduce pollution in the community<br />
Cabrillo College Online Survey<br />
Cabrillo College was selected by <strong>METRO</strong> as a transit market for further research to determine ways to<br />
increase transit performance to this institution. An online survey was selected as the outreach method to get<br />
feedback on transit improvements from students, staff, and faculty. The survey was posted online and a link<br />
was put on the Cabrillo College home page that took users to the survey location. The site was published on<br />
the 15 th of May and results were captured for a two week period.<br />
The focus of the survey was to determine reasons why people did not use transit to get to and from Cabrillo<br />
College. The first question filtered those who used <strong>METRO</strong> and those who did not. Those who used<br />
<strong>METRO</strong> were not asked any further questions and were navigated out of the survey. The remaining<br />
respondents were asked a series of questions to determine the major reasons why they did not use the transit<br />
service.<br />
101015<br />
SANTA CRUZ SHORT RANGE TRANSIT PLAN<br />
Page 2 - 10<br />
WILBUR SMITH ASSOCIATES
BACKGROUND<br />
A total of 141 responses were gathered from the survey. Question by question results are included in<br />
Appendix D. Over a third of the respondents use transit to get to Cabrillo, second only to auto (52%). Of<br />
those who use transit, almost 85% use it daily or almost daily. The results of the survey showed the following<br />
reasons why those Cabrillo users don’t use transit:<br />
• Difficulty in planning a trip was identified as a concern.<br />
• <strong>Transit</strong> is viewed as not convenient to many respondents’ lifestyles due primarily to offpeak/irregular<br />
schedules<br />
• Poor on-time performance was highlighted as important reason why people don’t use the service<br />
• Poor or limited time coverage was a significant concern, specifically frequency of service and the<br />
need to transfer between buses<br />
• There is a desire to expand service information, specifically real-time bus location information and a<br />
trip planning tool<br />
• More direct routes was listed as a service coverage issue<br />
• Limited service time coverage was very significant deterrent, specifically the lack of evening and<br />
weekend service and the frequency of service<br />
SUMMARY OF BACKGROUND INFORMATION<br />
<strong>METRO</strong> provides a critical transportation service to many residents of <strong>Santa</strong> <strong>Cruz</strong> County. Regional<br />
transportation studies have identified an increase in transit’s role in providing transportation solutions to<br />
solve many of the current congestion issues facing the County’s population. Specifically, BRT has been<br />
identified as a feasible way to improve transit operations and reachthe desired transit choice mode split<br />
envisioned for the County.<br />
While transit is identified to play a more significant role in the future transportation system, <strong>METRO</strong> can<br />
improve upon its delivery of service in a variety of ways. The agency is still rebounding from systemwide<br />
adjustments made following the October 2005 strike. These adjustments, made primarily to align the existing<br />
scheduling of service and the newly required driver break requirements, are still being refined. Added<br />
uncertainties from traffic congestion and roadway construction complicate the scheduling process, resulting<br />
in reliability issues of the service.<br />
Improvements have also been identified in the contrasting needs of the various markets for which <strong>METRO</strong><br />
provides transit. On-board survey results and historical ridership shows students as a major user of transit.<br />
Population trends and transit rider demographics highlight the future expansion of transit ridership from<br />
Watsonville. While both of these user groups are potential users of transit, <strong>METRO</strong> needs to adapt its<br />
services and outreach techniques to accommodating their contrasting needs. This translates to a balancing of<br />
resources for those invested in technological advancements such as real-time signage and online trip planners<br />
and those dedicated to improving community-based outreach and bi-lingual communication.<br />
101015<br />
SANTA CRUZ SHORT RANGE TRANSIT PLAN<br />
Page 2 - 11<br />
WILBUR SMITH ASSOCIATES
CHAPTER 3: GOALS, OBJECTIVES & STANDARDS<br />
MISSION STATEMENT<br />
Provide a public transportation service that enhances personal mobility and creates a sustainable transportation option in <strong>Santa</strong><br />
<strong>Cruz</strong> County through a cost-effective, reliable, accessible, safe, clean and courteous transit service.<br />
GOALS AND OBJECTIVES<br />
Goals, objectives and performance measures are used by <strong>METRO</strong> to establish the vision for how transit<br />
should be delivered and how decisions concerning its delivery, based upon the available resources, should be<br />
made by the agency. This process was initiated by the development of the goals and objectives and then<br />
quantified and assessed using performance measures developed by WSA in collaboration with <strong>METRO</strong>.<br />
Since a structured performance measuring program is new to <strong>METRO</strong>, a complementary monitoring<br />
program is suggested to ensure the standards are constantly working toward improving the system.<br />
The <strong>Short</strong> <strong>Range</strong> <strong>Transit</strong> <strong>Plan</strong> (SRTP) must address the competing goals of productivity and service delivery.<br />
Identifying the importance of each of these goals in the performance measurement program was completed<br />
through rider surveys, transit non-user focus groups, bus operator surveys, and input from <strong>METRO</strong> staff.<br />
The cumulative feedback highlighted the desire to focus primarily on service delivery (specifically coverage)<br />
on secondarily on productivity.<br />
The following goals and objectives were developed to meet the public transportation needs of the general<br />
public:<br />
Goal 1: <strong>METRO</strong> shall provide a family of services for the residents of <strong>Santa</strong> <strong>Cruz</strong> County that:<br />
connects key activity centers, serving as the foundation for the system; provides<br />
transportation alternatives to those who lack other options, including elderly persons,<br />
persons with disabilities, students, and economically disadvantaged persons; and allows for<br />
system expansion to serve new markets and opportunities.<br />
Objective 1.1: Develop a core group of services that connect key activity points and commit to<br />
providing service along those corridors that as the primary objective.<br />
Objective 1.2: Review all services to evaluate how the needs of the transportation disadvantaged,<br />
using the federal definition which includes seniors, people with disabilities and those with low<br />
income, are being addressed as a second objective.<br />
Objective 1:3: Consider the impact on core services and those to the transportation disadvantaged as<br />
part of requests for new or expanded services.<br />
Goal 2: <strong>METRO</strong> shall provide safe, reliable and accessible transportation to the residents of <strong>Santa</strong><br />
<strong>Cruz</strong> County.<br />
Objective 2.1: Ensure that services are operated in a manner to maximize safety, to the riders, the<br />
public and the operators.<br />
Objective 2.2: Operate service in a manner that will maximize reliability of transit services.<br />
Objective 2.3: Consider potential for services within one-half mile of residential areas.<br />
Goal 3: <strong>METRO</strong> shall work cooperatively with local communities, residents, and other affected<br />
agencies and groups to develop the best possible family of services within the limitations of<br />
their resources.<br />
101015<br />
SANTA CRUZ <strong>METRO</strong> SHORT RANGE TRANSIT PLAN<br />
Page 3 - 1<br />
WILBUR SMITH ASSOCIATES
GOALS, OBJECTIVES AND STANDARDS<br />
Objective 3.1: Develop an ongoing planning process with key agencies and organizations within<br />
<strong>Santa</strong> <strong>Cruz</strong> County and the region.<br />
Objective 3.2: Operate the agency in a manner that will encourage public input and participation.<br />
Objective 3.3: Ensure high levels of customer satisfaction.<br />
Goal 4: <strong>METRO</strong> shall consistently work to improve its operating efficiency and service delivery<br />
effectiveness.<br />
Objective 4.1: Operate service in a manner that will maximize system productivity.<br />
Objective 4.2: Operate service in a manner that will maximize system efficiency.<br />
Objective 4.3: Operate service in a manner that will maximize use of subsidies.<br />
PERFORMANCE STANDARDS<br />
Overview<br />
A Performance Measurement Program is an essential tool for transit agencies to both monitor the service<br />
they deliver and provide justifications for modifications to that service. Development of a measurement<br />
program should focus on meeting the goals of the transit agency and fulfilling the needs of the community<br />
for which they serve. Deciding on these measurements and the quantity of measurements, is a combination<br />
of what data is obtainable by the agency and how that analysis of that data will affect the service design<br />
criteria. The following lists display the typical categories, methods of presentation and data collection and<br />
organization and standards of evaluation:<br />
Categories:<br />
• Availability - how easily potential passengers can use transit services<br />
• Service Delivery- assessment of passengers experiences using transit<br />
• Community Measures – transit’s role in achieving the greater goals of the community<br />
• Travel Time – how long the transit trip takes (isolated and compared to other modes)<br />
• Safety and Security – how safe the user feels and likelihood of an accident and how personally<br />
secure a passenger feels riding the bus or waiting at <strong>METRO</strong> facilities.<br />
• Maintenance and Construction – effectiveness of the agency’s maintenance program<br />
• Economics – utilization, efficiency, and effectiveness of service and management’s impact on these<br />
measures<br />
• Capacity – ability of transit to move both vehicles and people<br />
Data Presentation:<br />
• Individual measures<br />
• Ratios<br />
• Indexes<br />
• Level of service<br />
101015<br />
SANTA CRUZ <strong>METRO</strong> SHORT RANGE TRANSIT PLAN<br />
Page 3 - 2<br />
WILBUR SMITH ASSOCIATES
GOALS, OBJECTIVES AND STANDARDS<br />
Data Collection Methods:<br />
• In-house sources (driver’s manifest, schedules, financial data, etc.)<br />
• Census data<br />
• AVL or APC counters<br />
• Manual field work (ridechecks)<br />
• Environment Surveys (passenger on-board surveys, driver surveys, etc.)<br />
Standards of Evaluation:<br />
• Comparison to an annual average<br />
• Comparison to a baseline value<br />
• Trend analysis<br />
• Self-identified standards<br />
• Comparison to typical industry standards<br />
• Comparison to peer systems<br />
Measures for <strong>METRO</strong><br />
The development of the performance measurement program was done as an iterative process between WSA<br />
and <strong>METRO</strong> staff. After discussions with <strong>METRO</strong> staff, it was decided that the goals, objectives and<br />
performance measures should be developed from the bottom up to directly reflect the needs of the agency.<br />
This process used a combination of resources including the TCRP Report 88: A Guidebook for Developing a<br />
<strong>Transit</strong> Performance-Measurement System and observed measures from a number of peer transit agencies.<br />
These developed measures were also based on the agency’s ability to collect and analyze the needed data and<br />
the agencies ability to meet the criteria. Meetings were held with <strong>METRO</strong> staff to determine how data is<br />
currently collected and their vision for future upgrades that would allow them more analysis capabilities. Staff<br />
resources available for the collection and analysis process were also discussed prior to developing the<br />
performance monitoring programs.<br />
In total, 19 measures were established for the service monitoring program. These measures and the goals and<br />
objectives they quantify are shown in Table 3-1. These measures will allow informed service improvement<br />
decisions to be made by <strong>METRO</strong> and their Board. The program comprehensively covers the goals and<br />
objectives of the agency. The criteria selected for these measures was set to be both manageable to obtain<br />
and stringent enough to identify where improvement/changes need to occur.<br />
The suggested performance monitoring program contains a mixture of qualitative and quantitative measures.<br />
Quantitative measures are relatively easy to monitor and evaluate once the necessary data is collected.<br />
Qualitative measures are more difficult to collect and evaluate and often time take more resources. These<br />
measures focus on satisfaction ratings with customers and employees and communication with the local<br />
communities.<br />
Recognizing that <strong>METRO</strong> operates different types of service to meet different needs and users, some of the<br />
performance measures were developed in recognition of the various types of fixed route services offered by<br />
101015<br />
SANTA CRUZ <strong>METRO</strong> SHORT RANGE TRANSIT PLAN<br />
Page 3 - 3<br />
WILBUR SMITH ASSOCIATES
GOALS, OBJECTIVES AND STANDARDS<br />
<strong>METRO</strong>. This was done to allow performance comparisons to be completed for routes of similar<br />
characteristics and purposes. These categories of fixed-route services include:<br />
• Rural (6 Routes)<br />
• Local/Feeder (17 Routes)<br />
• Intercity (8 Routes)<br />
• University of California at <strong>Santa</strong> <strong>Cruz</strong> (7 Routes)<br />
• Regional (1 Route)<br />
The majority of the performance measures can be collected and calculated with the current resources and<br />
technology. However, WSA recommends establishing annual surveying efforts for passengers, and the<br />
community to collect important information from these sources. These surveys would allow <strong>METRO</strong> the<br />
opportunity to gauge their performance through their riders and non riders and develop strategies to improve<br />
upon any viewed deficiencies. Financial constraints would limit these to annual systemwide surveys but<br />
comment cards and other forms of customer feedback should be encouraged and reviewed by staff as it is<br />
generated.<br />
GIS (geographic information systems) data is also assumed to be available to <strong>METRO</strong> and the in-house tool<br />
(ArcView ArcGIS 9.0 or later) is assumed to be in use prior to starting the monitoring process. Many of the<br />
community measures depend upon the integration of the transit’s spatial network and the demographic<br />
information obtained from the US Census Bureau and other local and regional surveys.<br />
Testing and Monitoring Process<br />
The success of the performance monitoring program will be largely based on <strong>METRO</strong> ability to perform the<br />
following three tasks:<br />
• Collect the needed data<br />
• Analyze the data<br />
• Report the data<br />
These tasks were taken into consideration during the development process of the performance measures but<br />
<strong>METRO</strong> should run a pilot program to test the staff’s ability to complete these tasks. If these tasks are found<br />
to be unfeasible to complete for any of the performance measurements, the suggested measurement should<br />
be revised or a replacement measurement should be pursued. Future technological investments by <strong>METRO</strong><br />
could also reduce staff time and resources currently needed to collect certain pieces of information and these<br />
advancements need to be recognized and utilized.<br />
The performance standard suggested for each performance measurement needs be calibrated to best meet the<br />
needs of <strong>METRO</strong>. The suggested performance standards were based on FY 2006-2007 averages for each<br />
service type and historic performance data. These numbers may be skewed due to abnormal events that<br />
occurred during these time periods or abnormal economic conditions. Forecasting transit activity is a difficult<br />
venture so <strong>METRO</strong> must monitor its current performance and its performance standards program to ensure<br />
the standards are set and adjusted as needed to meet the goals of the agency.<br />
101015<br />
SANTA CRUZ <strong>METRO</strong> SHORT RANGE TRANSIT PLAN<br />
Page 3 - 4<br />
WILBUR SMITH ASSOCIATES
GOALS, OBJECTIVES AND STANDARDS<br />
General <strong>Plan</strong>ning Process<br />
The Goals, Objectives and Standards program suggested in this chapter of the SRTP should be accompanied<br />
by a formal planning process to ensure it is being utilized to its fullest potentials. Over time, <strong>METRO</strong> should<br />
use this process to transition from reactive planning to a more of a prescribed and proactive internal planning<br />
process that identifies service opportunities to add, delete or change services in conjunction with the<br />
established performance standards and priorities. The recommendation also includes the development of a<br />
position of <strong>Plan</strong>ning Manager/Director to guide and lead overall planning and service design efforts, to<br />
ensure consistency and leadership from an overall management perspective and to ensure high level oversight<br />
of the processes.<br />
Currently, service changes and recommendations are received by <strong>METRO</strong> staff through three primary<br />
sources:<br />
• The general public (through comment cards or email);<br />
• Bus drivers; and<br />
• <strong>METRO</strong> staff.<br />
These changes are collected by various <strong>METRO</strong> staff and screened to determine those that should move<br />
forward for further consideration. These suggested changes are then reviewed at the monthly meetings of the<br />
Service <strong>Plan</strong>ning and Review Committee (SPARC). This committee is composed of <strong>METRO</strong> <strong>Plan</strong>ning staff,<br />
<strong>METRO</strong> Operations Staff and representatives from the bus drivers’ union. Final recommendations<br />
generated at these meetings are presented to the <strong>METRO</strong> Board for approval before reaching the<br />
implementation stages.<br />
The SRTP recommendation is to provide structure and formalize planning and service performance<br />
monitoring to effectively and efficiently meet the needs of the agency and its users. Service improvements or<br />
changes should be made based on community needs as well as service performance. The <strong>Plan</strong>ning<br />
Manager/Director would have as his or her responsibility monitoring service performance, developing service<br />
performance reports that are prepared at regular intervals for the General Manager, Deputy and the <strong>METRO</strong><br />
Board, so that they have the tools they need to make service decisions based on established priorities.<br />
To support performance monitoring program, planning staff will be responsible for collecting and entering all<br />
inputs needed to keep the all routes in the system monitored. A regular schedule for data collection and<br />
inputs should be developed and followed consistently. Specific recommendations to modify the input<br />
process, the goals/objectives/standards criteria and associated service modifications would also be the<br />
responsibility of the <strong>Plan</strong>ning Manager/Director, but would logically coincide with the budgeting process<br />
timelines.<br />
It in intended that as recommendations for service changes are merited, the process of bringing these<br />
recommendations to the existing SPARC Committee or another recommended process should continue.<br />
101015<br />
SANTA CRUZ <strong>METRO</strong> SHORT RANGE TRANSIT PLAN<br />
Page 3 - 5<br />
WILBUR SMITH ASSOCIATES
GOALS, OBJECTIVES AND STANDARDS<br />
Table 3- 1: Performance Measures<br />
Goal<br />
Objective<br />
Measure<br />
Category<br />
Measure Description Categories<br />
Current Performance<br />
Average or average (low-high)<br />
Suggested Target<br />
Performance<br />
Reporting<br />
Frequency<br />
Data<br />
Collection<br />
Method<br />
Data<br />
Analysis<br />
Method<br />
Availability<br />
Span of service<br />
Total hours service is provided -<br />
have service available during<br />
times when it is appropriate<br />
Core services Varies by type 18 hours Annual Hastus Excel<br />
Availability Frequency Minimum appropriate headway Core services Varies by type 15, 30, 60 Annual Hastus Excel<br />
1.1 Develop a core group of services that<br />
connect key activity points<br />
Capacity Seat Capacity Seats available Core services Varies by type Standees measure Annual<br />
Travel Time<br />
<strong>Transit</strong>-Auto<br />
Travel Time<br />
<strong>Transit</strong> trip not to exceed 150%<br />
of same trip by automobile<br />
Ride<br />
Check<br />
Results<br />
Core services Not Yet Collected 90% Quarterly Hastus Excel<br />
Excel<br />
1. <strong>METRO</strong> shall provide a family of<br />
services that connects key activity<br />
centers provides transportation<br />
alternatives to those that lack other<br />
options, and allows for system<br />
expansion to serve new markets and<br />
opportunities.<br />
Availability<br />
Community<br />
Service coverage<br />
Service coverage<br />
Service available at key activity<br />
centers<br />
(key activity centers to be further<br />
defined)<br />
% of the total population within<br />
walking distance (1/4 mile of a<br />
transit stop[1])<br />
Core services Not Yet Collected 100% Annual<br />
Systemwide 88% 90% Annual<br />
County or<br />
Local<br />
<strong>Plan</strong>ning<br />
Depts<br />
Census<br />
and/or<br />
AMBAG<br />
GIS<br />
GIS/Excel<br />
Rural Limited (60) 60 \ 60*<br />
Intercity Varies (30) 60 \ 60*<br />
Availability<br />
Frequency<br />
Minimum headway frequency<br />
during non-peak (peak)<br />
Local / Feeder Varies (30) 60 \ 60*<br />
Annual Hastus Excel<br />
1.2 To the maximum extent possible<br />
ensure that services are available to<br />
transportation disadvantaged<br />
UCSC Varies (15) 15 \ 60*<br />
HWY 17 Varies (30) 60 \ 60*<br />
Rural<br />
Varies<br />
6 hours<br />
(allocated to peak periods)<br />
Service Delivery Span of Service Total hours service is operated<br />
Intercity Varies 14 hours<br />
Local / Feeder Varies 14 hours<br />
UCSC Varies 18 hours<br />
Annual Hastus Excel<br />
HWY 17 Varies 16 hours<br />
1.3 Consider the impact on core services<br />
and transportation disadvantaged as<br />
requests for new services are studied<br />
Community<br />
Service Equity<br />
Equitable distribution of costs<br />
and benefits from investments in<br />
transit – cost per additional<br />
riders<br />
Systemwide Not Yet Collected ? Annual<br />
Existing<br />
Ride<br />
Check<br />
Excel<br />
101015<br />
SANTA CRUZ <strong>METRO</strong> SHORT RANGE TRANSIT PLAN WILBUR SMITH ASSOCIATES<br />
Page 3 - 6
GOALS, OBJECTIVES AND STANDARDS<br />
Goal<br />
Objective<br />
Measure<br />
Category<br />
Measure Description Categories<br />
Current Performance<br />
Average or average (low-high)<br />
Suggested Target<br />
Performance<br />
Reporting<br />
Frequency<br />
Data<br />
Collection<br />
Method<br />
Data<br />
Analysis<br />
Method<br />
2.1 Ensure that services are operated in<br />
a manner to maximize safety, to the<br />
riders, the public and the operators<br />
Safety and<br />
Security<br />
Accident rate # of accident per service mile Systemwide 0.48 accidents per 100,000 miles<br />
< 1 accident per<br />
100,000 miles<br />
Quarterly<br />
Operations<br />
Data?<br />
Excel<br />
Service Delivery<br />
On-time<br />
performance<br />
% of transit vehicles departing at<br />
a scheduled timepoint<br />
Systemwide<br />
Varies<br />
90% of timepoints<br />
within 5 minutes of<br />
schedule, 0% early<br />
departures -<br />
systemwide<br />
Annual<br />
Ride<br />
Check<br />
Results<br />
Excel<br />
2. <strong>METRO</strong> shall provide a safe, reliable,<br />
accessible and attractive means of<br />
transportation to the residents of <strong>Santa</strong><br />
<strong>Cruz</strong> County.<br />
2.2 Operate service in a manner that will<br />
maximize reliability of transit services<br />
Service Delivery<br />
Service Delivery<br />
Run time ratio<br />
Compliant rate<br />
(Ratio of observed running time<br />
to scheduled running time)*100<br />
Number of passenger<br />
complaints<br />
Systemwide<br />
Systemwide<br />
Not Yet Collected<br />
<strong>METRO</strong> To Provide<br />
Between 90-110 –<br />
systemwide<br />
≤ 1 per 1,000 service<br />
hours – systemwide<br />
Annual<br />
Quarterly<br />
Ride<br />
Check<br />
Results<br />
and<br />
Headways<br />
Customer<br />
Service?<br />
Excel<br />
Excel<br />
Service Delivery<br />
Missed trips<br />
Trips removed from the daily<br />
schedule due to mechanical<br />
breakdown or driver absences<br />
Systemwide <strong>METRO</strong> To Provide ≤ 0.5% - systemwide Quarterly Hastus? Excel<br />
Maintenance and<br />
Construction<br />
Spare ratio<br />
% of fleet available to substitute<br />
for other vehicles<br />
Systemwide <strong>METRO</strong> To Provide ≥ 20% Annual<br />
Operations<br />
Data?<br />
Excel<br />
2.3 Consider service potential within<br />
one-half mile of residential areas<br />
Availability<br />
Service coverage<br />
% of the total population within<br />
walking distance (1/4 mile of a<br />
transit stop[2])<br />
Systemwide 88% 90% Annual<br />
Census<br />
and/or<br />
AMBAG<br />
GIS/Excel<br />
101015<br />
SANTA CRUZ <strong>METRO</strong> SHORT RANGE TRANSIT PLAN WILBUR SMITH ASSOCIATES<br />
Page 3 - 7
GOALS, OBJECTIVES AND STANDARDS<br />
Goal<br />
Objective<br />
Measure<br />
Category<br />
Measure Description Categories<br />
Current Performance<br />
Average or average (low-high)<br />
Suggested Target<br />
Performance<br />
Reporting<br />
Frequency<br />
Data<br />
Collection<br />
Method<br />
Data<br />
Analysis<br />
Method<br />
3.1 Develop an ongoing planning<br />
process with key agencies and<br />
organizations within <strong>Santa</strong> <strong>Cruz</strong> County<br />
and the region.<br />
Community<br />
Measures<br />
Communications<br />
How well transit agencies are<br />
able work with key agencies and<br />
local communities<br />
Systemwide<br />
Not Yet Collected<br />
80% or average<br />
above 4.0<br />
Annual<br />
Annual<br />
Community<br />
Survey<br />
Excel<br />
3.2 Operate the agency in a manner that<br />
will encourage public input and<br />
participation<br />
Community<br />
Measures<br />
Communication<br />
% of community responding as<br />
satisfied or very satisfied on<br />
community survey<br />
Systemwide<br />
Not Yet Collected<br />
80% or average<br />
above 4.0<br />
Annual<br />
Annual<br />
Community<br />
Survey<br />
Excel<br />
3. <strong>METRO</strong> shall work cooperatively<br />
with the communities and residents or<br />
<strong>Santa</strong> <strong>Cruz</strong> County to develop the best<br />
possible transit service within the<br />
limitations of their resources.<br />
3.3 Ensure high levels of customer<br />
satisfaction<br />
Service Delivery<br />
Customer<br />
satisfaction<br />
% of customer responding as<br />
satisfied or very satisfied on<br />
questionnaire<br />
Systemwide<br />
Not Yet Collected<br />
80% or average<br />
above 4.0<br />
Annual<br />
Annual<br />
Customer<br />
Survey<br />
Excel<br />
101015<br />
SANTA CRUZ <strong>METRO</strong> SHORT RANGE TRANSIT PLAN WILBUR SMITH ASSOCIATES<br />
Page 3 - 8
GOALS, OBJECTIVES AND STANDARDS<br />
Goal<br />
Objective<br />
Measure<br />
Category<br />
Measure Description Categories<br />
Current Performance<br />
Average or average (low-high)<br />
Suggested Target<br />
Performance<br />
Reporting<br />
Frequency<br />
Data<br />
Collection<br />
Method<br />
Data<br />
Analysis<br />
Method<br />
Ridership<br />
Average weekday ridership<br />
Rural 403<br />
Intercity 2,385<br />
Local / Feeder 6,831<br />
UCSC 8,027<br />
HWY 17 713<br />
Previous year’s<br />
month total * [1 +<br />
(annual County<br />
population growth)]<br />
Monthly<br />
Fare<br />
Revenues<br />
Excel<br />
Rural 16.44 (11.91-24.38) ≥ 15.0<br />
4.1 Operate service in a manner that will<br />
maximize system productivity<br />
Economic<br />
Passengers per revenue hour<br />
Intercity 25.79 (19.16-32.28) ≥ 20.0<br />
Local / Feeder 19.16 (7.17-51.54) ≥ 10.0<br />
UCSC 58.54 (43.55-70.30) ≥ 50.0<br />
Monthly<br />
Operations<br />
Data<br />
Excel<br />
Productivity<br />
Passengers per service 2 mile<br />
HWY 17 12.79 ≥ 10.0<br />
Rural 0.50 (0.34-0.70) ≥ 0.5<br />
Intercity 1.40 (0.69-2.35) ≥ 1.5<br />
Local / Feeder 1.31 (0.30-5.23) ≥ 0.5<br />
UCSC 5.22 (0.60-12.48) ≥ 5.0<br />
Monthly<br />
Operations<br />
Data<br />
Excel<br />
4. <strong>METRO</strong> shall consistently work to<br />
improve its operating efficiency and<br />
service delivery performance.<br />
Cost efficiency Cost per service mile ($)<br />
HWY 17 0.52 ≥ 0.5<br />
Rural $7.17 ($3.88-$13.99) ≤ $10<br />
Intercity $8.82 ($4.92-$12.52) ≤ $10<br />
Local / Feeder $10.14 ($3.38-$25.30) ≤ $10<br />
UCSC $15.54 ($2.27-$46.74) ≤ $20<br />
Monthly<br />
Operations<br />
Data<br />
Excel<br />
HWY 17 $4.84 ≤ $5<br />
4.2 Operate service in a manner that will<br />
maximize system efficiency<br />
Economic<br />
Cost<br />
effectiveness<br />
Operating ratio (farebox<br />
recovery)<br />
Rural 7.96% (4.06%-12.21%) ≥ 5%<br />
Intercity 16.10% (12.25%-20.54%) ≥ 15%<br />
Local / Feeder 9.52% (1.68%-18.27%) ≥ 10%<br />
UCSC 33.48% (25.17%-39.93%) ≥ 30%<br />
Monthly<br />
Operations<br />
Data<br />
Excel<br />
HWY 17 23.48% ≥ 25%<br />
Employee<br />
efficiency<br />
Paid to platform ratio Systemwide 88.28% ≥ 90% Quarterly Hastus? Excel<br />
Rural $13.23 ($7.87-$20.62) ≤ $15<br />
4.3 Operate service in a manner that will<br />
minimize the need for subsidy<br />
Economic<br />
Cost<br />
effectiveness<br />
Subsidy per passenger ($)<br />
Intercity $5.57 ($4.06-$7.55) ≤ $5<br />
Local / Feeder $9.92 ($3.15-$22.09) ≤ $10<br />
UCSC $1.97 ($1.41-$2.83) ≤ $2<br />
Monthly<br />
Operations<br />
Data<br />
Excel<br />
HWY 17 $7.17 ≤ $10<br />
101015<br />
SANTA CRUZ <strong>METRO</strong> SHORT RANGE TRANSIT PLAN WILBUR SMITH ASSOCIATES<br />
Page 3 - 9
GOALS, OBJECTIVES AND STANDARDS<br />
Summary<br />
The suggested performance monitor process will give <strong>METRO</strong> the opportunity to be proactive in their<br />
planning practices and identify service issues or service needs as early as possible. Current staff resources and<br />
technology investments allow planning operations to focus primarily on problems once they surface, rather<br />
than identifying them earlier on in their development. The lack of Automatic Vehicle Locator (AVL) devices<br />
and Automatic Passenger Counters (APC) on service vehicles also limit the amount of real-time data that the<br />
<strong>Plan</strong>ning staff have access to, further limiting their abilities.<br />
Recent investments in GIS and the ATP module (allowing run-time calibration to occur) for Hastus will aid<br />
in the data collection and analysis tools needed to develop the monitoring program. Additional staffing<br />
resources would also greatly increase the frequency and precision of the monitoring and reporting process.<br />
As theses resources continue to increase, <strong>METRO</strong> will be able to implement an active and responsive<br />
reporting and monitoring system that will give <strong>METRO</strong> staff and its Board members valuable information<br />
needed to assess necessary actions needed to improve their transit system for the residents of <strong>Santa</strong> <strong>Cruz</strong><br />
County.<br />
101015<br />
SANTA CRUZ <strong>METRO</strong> SHORT RANGE TRANSIT PLAN<br />
Page 3 - 10<br />
W
CHAPTER 4: SYSTEM EVALUATION / CURRENT<br />
PERFORMANCE<br />
Evaluation of <strong>METRO</strong>’s fixed route services was completed systemwide and route by route. The<br />
systemwide assessment is useful to determine trends in the overall transit market for <strong>Santa</strong> <strong>Cruz</strong> County.<br />
The route by route evaluation provides a more detailed assessment of how the individual routes are doing<br />
compared to the overall system, and compared to peer routes that fall within the same <strong>METRO</strong> service<br />
category. Table 4- 1 shows <strong>METRO</strong>’s systemwide performance from FY 2003-04 to FY 2006-07.<br />
Table 4- 1: Systemwide Performance Summary<br />
FY 2003-04 FY 2004-05 FY 2005-06* FY 2006-07<br />
Total Change<br />
(03/04-06/07)<br />
Fare Revenues $ 6,697,702 $ 7,141,807 $ 6,301,904 $ 7,730,498 $ 1,032,796<br />
year previous % change 6.63% -11.76% 22.67% 15.42%<br />
Operating Cost $ 30,608,074 $ 32,316,524 $ 33,310,816 $ 36,875,628 $ 6,267,554<br />
year previous % change 5.58% 3.08% 10.70% 20.48%<br />
Revenue Miles of Operation 3,775,849 3,286,376 2,875,196 3,249,061 (526,788)<br />
year previous % change -12.96% -12.51% 13.00% -13.95%<br />
Revenue Hours of Operation 248,361 216,531 194,306 221,188 (27,173)<br />
year previous % change -12.82% -10.26% 13.83% -10.94%<br />
Total Passengers Carried 5,962,173 5,596,884 4,769,437 5,605,317 (356,856)<br />
year previous % change -6.13% -14.78% 17.53% -5.99%<br />
Farebox Recovery Ratio 0.22 0.22 0.19 0.21 (0.01)<br />
year previous % change 0.99% -14.39% 10.81% -4.20%<br />
Average Fare/Passenger $ 1.12 $ 1.28 $ 1.32 $ 1.38 $ 0.26<br />
year previous % change 13.59% 3.55% 4.38% 22.77%<br />
Passengers Carried / Revenue Hour 24.01 25.85 24.55 25.34 1.34<br />
year previous % change 7.67% -5.04% 3.24% 5.56%<br />
Passengers Carried / Revenue Mile 1.58 1.70 1.66 1.73 0.15<br />
year previous % change 7.85% -2.60% 4.00% 9.26%<br />
Operating Cost / Passenger $ 5.13 $ 5.77 $ 6.98 $ 6.58 $ 1.44<br />
year previous % change 12.47% 20.96% -5.81% 28.15%<br />
Subsidy Cost / Passenger $ 4.01 $ 4.50 $ 5.66 $ 5.20 $ 1.19<br />
year previous % change 12.16% 25.90% -8.18% 29.65%<br />
Operating Cost / Service Hour 123.24 149.25 171.43 166.72 $ 43.48<br />
year previous % change 21.10% 14.87% -2.75% 35.28%<br />
* does not include the month of October 2005 due to a strike that lasted the duration of the month<br />
From 2003 to 2007, there has been a general increase in fare revenues and total operating cost, while<br />
ridership and revenue miles and hours of operation have declined. Compared to the year prior, operation<br />
hours, miles, and ridership in FY 2006-07 have increased, despite a downward trend during previous years.<br />
However, it should be noted that this may be a result of the strike in 2005, and compared to the year before<br />
(FY 2004-05), these numbers were relatively similar.<br />
Among the most significant changes from 2003 to 2007 were operating costs per passenger and per service<br />
hour, and subsidy cost per passenger. These costs did, however, decline slightly in FY 2006-07 from the<br />
previous year, despite an earlier upward trend. Over the four year period, there were also relatively smaller<br />
101015<br />
SANTA CRUZ <strong>METRO</strong> SHORT RANGE TRANSIT PLAN<br />
Page 4 - 1<br />
WILBUR SMITH ASSOCIATES
SYSTEM EVALUATION / CURRENT PERFORMANCE<br />
gains in passengers per revenue hour and mile, both of which declined slightly in FY 2005-06 but returned<br />
back up to previous levels the following year.<br />
Average fare per passenger has increased rather steadily over the past four years. This increase is also<br />
reflected in the overall increase in total fare revenues and decline in total ridership. On the other hand, the<br />
farebox recovery ratio has declined slightly over the four year period, though it has fluctuated rather<br />
significantly. The drop in farebox recovery in FY 2005-06 could be partly due to the strike in October,<br />
when fare revenues also declined considerably while operating costs continued to increase.<br />
The route by route assessment is presented in Table 4- 2 and Table 4- 3 and Figures 4- 1 to 4- 5. Table 4- 2<br />
shows route by route performance, summarizing operating costs, ridership, and revenues. In earlier<br />
sections of the report there was a discussion regarding the different types of routes which <strong>METRO</strong> operates,<br />
by category. One reason this was done is to recognize that different types of services perform at different<br />
bases. Therefore the expectation for route performance should be different for routes as they are<br />
distinguished by category.<br />
In terms of route categories, the UCSC routes have the highest farebox recovery and passengers, and the<br />
lowest per passenger operating costs. The regional route also has a very high farebox recovery, but, as it is<br />
mainly used for longer distance travel, it carries a relatively lower number of passengers per mile and per<br />
hour, as would be expected. The rural routes are generally the lower performing routes, as they serve<br />
smaller markets and span longer distances while maintaining regular fares. These routes thus have lower<br />
farebox recovery rates and provide greater subsidies per passenger. A number of local/feeder services also<br />
have relatively lower performance in terms of passengers per hour and per mile. These tend to be the<br />
limited or special service routes.<br />
A route by route ridership summary is shown in Table 4- 3. Total annual and average weekday ridership is<br />
highest among the UCSC routes, which, not surprisingly, carry the highest percentage of UCSC riders.<br />
These annual ridership numbers are also high despite the fact that many of these routes are operated only<br />
during the school term. The intercity routes also have high ridership levels, and they also carry the highest<br />
percentage of weekend trips. A handful of rural, intercity, and local/feeder routes carry a higher than<br />
average percentage of UCSC trips. This indicates that these may be the main transit services used by UCSC<br />
students and faculty traveling to and from places further away from campus.<br />
The intercity routes, followed by local/feeder routes, tend to serve a higher percentage of Cabrillo riders.<br />
This includes Route 70, an intercity route, which is a service specific to Cabrillo College. These two types<br />
of routes also carry a large number of wheelchair riders, possibly indicating a more transit-dependent<br />
population that exists around those service areas. Relatively high numbers of wheelchair passengers are<br />
notable on a handful of local/feeder routes, particularly Routes 53 and 88. This may have significant<br />
implications for the operations of these routes and the types of vehicles used, which can influence<br />
boarding/alighting delays and capacity.<br />
In terms of average weekday ridership, UCSC and intercity routes are again shown to be among the highest.<br />
All UCSC routes are near the highest in terms of ridership and farebox recovery and among the lowest in<br />
subsidies per passenger. A number of intercity and local/feeder routes rank relatively high in these criteria<br />
as well, namely intercity routes 69, 69A, and 69W and local/feeder routes 66 and 68.<br />
The suggested performance targets for the quantitative performance monitoring program were developed<br />
using averages calibrated based on the FY 2006-07 data. Reviewing each route to the averages for each<br />
category is an approach which <strong>METRO</strong> staff can utilize regularly to monitor route performance on a<br />
regular basis. These standards were calibrated based on current system performance and service goals.<br />
101015<br />
SANTA CRUZ <strong>METRO</strong> SHORT RANGE TRANSIT PLAN<br />
Page 4 - 2<br />
WILBUR SMITH ASSOCIATES
Table 4- 2: Route by Route Performance Summary (FY 2006-2007)<br />
Rural<br />
Route<br />
Estimated<br />
Operational Cost<br />
Estimated Fare<br />
Revenues<br />
Farebox<br />
Recovery<br />
Passengers<br />
Per Hour<br />
SYSTEM EVALUATION / CURRENT PERFORMANCE<br />
Passengers Per<br />
Mile<br />
Operating Cost<br />
Per Passenger<br />
Subsidy Per<br />
Passenger<br />
33* $ 40,492 $ 4,949 12.22% 25.09 1.17 $ 8.03 $ 7.05<br />
34* $ 30,814 $ 2,312 7.50% 12.38 0.82 $ 16.27 $ 15.05<br />
40 $ 240,315 $ 25,178 10.48% 17.31 0.64 $ 11.63 $ 10.41<br />
41 $ 307,808 $ 22,171 7.20% 12.25 0.51 $ 16.43 $ 15.25<br />
42 $ 303,015 $ 17,028 5.62% 9.48 0.34 $ 21.24 $ 20.04<br />
72 $ 645,300 $ 60,138 9.32% 15.14 0.73 $ 13.30 $ 12.06<br />
Average $ 258,077 $ 20,651 8.00% 13.31 0.58 $ 15.13 $ 13.92<br />
Local / Feeder<br />
3 $ 417,770 $ 38,214 9.15% 17.43 1.26 $ 11.55 $ 10.50<br />
4 $ 372,101 $ 48,113 12.93% 29.73 2.59 $ 6.77 $ 5.90<br />
7 $ 236,818 $ 14,569 6.15% 12.88 1.15 $ 15.63 $ 14.67<br />
9 $ 58,355 $ 5,227 8.96% 15.42 0.82 $ 13.05 $ 11.89<br />
31 $ 280,763 $ 24,558 8.75% 15.08 0.78 $ 13.35 $ 12.18<br />
32 $ 105,127 $ 5,718 5.44% 9.40 0.55 $ 21.42 $ 20.25<br />
53 $ 206,215 $ 10,830 5.25% 9.82 0.69 $ 20.50 $ 19.42<br />
54 $ 286,925 $ 10,398 3.62% 6.66 0.39 $ 30.24 $ 29.14<br />
55 $ 465,162 $ 44,520 9.57% 17.97 1.22 $ 11.20 $ 10.13<br />
56 $ 235,956 $ 14,339 6.08% 11.61 0.51 $ 17.35 $ 16.30<br />
66 $ 1,360,641 $ 221,015 16.24% 28.90 2.49 $ 6.97 $ 5.84<br />
68 $ 1,001,057 $ 138,636 13.85% 25.03 2.11 $ 8.05 $ 6.93<br />
68N $ 261,543 $ 31,934 12.21% 21.43 1.46 $ 9.40 $ 8.25<br />
74 $ 474,018 $ 42,441 8.95% 14.37 0.83 $ 14.02 $ 12.76<br />
75 $ 957,828 $ 119,688 12.50% 20.07 1.21 $ 10.03 $ 8.78<br />
79 $ 232,557 $ 27,900 12.00% 20.04 1.18 $ 10.05 $ 8.84<br />
88**** $ 80,017 $ 1,310 1.64% 50.33 5.04 $ 4.00 $ 3.94<br />
Average $ 413,697 $ 47,024 11.37% 20.94 1.45 $ 9.62 $ 8.52<br />
Intercity<br />
35/35A* $ 4,604,742 $ 538,723 11.70% 20.60 1.03 $ 9.78 $ 8.63<br />
69 $ 780,797 $ 143,682 18.40% 33.45 3.09 $ 6.02 $ 4.91<br />
69A $ 1,894,821 $ 329,778 17.40% 30.01 1.62 $ 6.71 $ 5.54<br />
69W $ 1,908,385 $ 357,876 18.75% 32.51 1.82 $ 6.19 $ 5.03<br />
69N $ 334,402 $ 36,595 10.94% 19.71 1.58 $ 10.21 $ 9.10<br />
70*** $ 408,887 $ 61,385 15.01% 27.83 2.29 $ 7.23 $ 6.15<br />
71 $ 6,753,746 $ 984,114 14.57% 24.92 1.42 $ 8.08 $ 6.90<br />
91 $ 554,206 $ 72,376 13.06% 22.25 0.91 $ 9.05 $ 7.87<br />
Average $ 2,154,998 $ 315,566 14.64% 25.43 1.41 $ 7.92 $ 6.76<br />
UCSC<br />
10 $ 1,020,981 $ 333,277 32.64% 60.26 4.86 $ 3.34 $ 2.25<br />
12A** $ 30,990 $ 10,207 32.94% 61.12 4.21 $ 3.29 $ 2.21<br />
13** $ 306,634 $ 125,108 40.80% 75.59 6.45 $ 2.66 $ 1.58<br />
15** $ 1,084,938 $ 409,374 37.73% 69.87 5.97 $ 2.88 $ 1.79<br />
16** $ 2,733,850 $ 991,669 36.27% 66.67 5.37 $ 3.02 $ 1.92<br />
19** $ 961,247 $ 295,106 30.70% 56.71 4.20 $ 3.55 $ 2.46<br />
20** $ 1,242,002 $ 250,675 20.18% 37.29 2.46 $ 5.40 $ 4.31<br />
Average $ 1,054,377 $ 345,060 32.73% 60.36 4.68 $ 3.34 $ 2.24<br />
Regional<br />
17 $ 3,415,613 $ 1,732,587 50.73% 14.42 0.47 $ 13.96 $ 6.88<br />
Total $ 36,875,628 $ 7,616,502 20.65% 29.95 1.69 $ 6.72 $ 5.33<br />
* Some or all Trips Operated During San Lorenzo Valley School Term Only *** All Trips Operate Only During Cabrillo College School Term<br />
** Some or all Trips Operated During UCSC School Term Only **** Service Operates Mid-November Through Mid-April Only<br />
101015<br />
SANTA CRUZ <strong>METRO</strong> SHORT RANGE TRANSIT PLAN<br />
Page 4 - 3<br />
WILBUR SMITH ASSOCIATES
Table 4- 3: Route by Route Ridership Summary (FY 2006-2007)<br />
Route<br />
Rural<br />
Annual Ridership<br />
2006-2007<br />
Average Weekday<br />
Ridership<br />
% of Total Trips<br />
During Weekday<br />
SYSTEM EVALUATION / CURRENT PERFORMANCE<br />
% of Total Trips by<br />
UCSC Riders<br />
% of Total Trips by<br />
Cabrillo Riders<br />
Bikes per<br />
1,000 Riders<br />
Wheelchairs per<br />
1,000 Riders<br />
33* 5,045 29 100.0% 0.4% 0.4% 2 0.2<br />
34* 1,894 11 100.0% 0.3% 1.0% 4 0.0<br />
40 20,659 68 82.6% 3.9% 1.1% 42 0.4<br />
41 18,731 70 93.6% 17.3% 4.4% 84 0.5<br />
42 14,268 41 71.7% 13.7% 3.5% 120 1.2<br />
72 48,509 192 100.0% 1.2% 4.0% 18 4.5<br />
Average 17,061 59 84.0% 5.7% 3.0% 43.6 3.3<br />
Local / Feeder<br />
3 36,161 143 100.0% 20.2% 4.8% 45 5.0<br />
4 54,943 218 100.0% 6.6% 2.2% 19 13.8<br />
7 15,149 60 100.0% 6.9% 5.1% 11 5.8<br />
9 4,470 18 100.0% 10.1% 1.0% 7 1.1<br />
31 21,031 83 100.0% 6.9% 2.5% 44 4.3<br />
32 4,909 19 100.0% 5.9% 2.9% 44 4.9<br />
53 10,059 40 100.0% 2.1% 3.7% 15 35.1<br />
54 9,489 11 30.1% 2.3% 10.4% 37 13.4<br />
55 41,519 155 94.1% 1.5% 30.6% 22 17.2<br />
56 13,599 54 100.0% 1.1% 24.2% 31 24.5<br />
66 195,265 587 75.8% 11.4% 3.3% 26 7.6<br />
68 124,429 383 78.1% 14.4% 3.2% 24 6.6<br />
74 27,837 81 73.4% 17.7% 3.8% 41 3.8<br />
75 33,819 134 100.0% 0.9% 2.5% 8 6.0<br />
79 95,461 266 70.3% 1.1% 2.7% 16 5.5<br />
88**** 23,141 92 100.0% 1.8% 5.0% 8 39.4<br />
Average 43,017 146 83.0% 8.5% 5.2% 23.3 9.2<br />
Intercity<br />
35/35A* 471,055 1,508 80.7% 3.4% 2.6% 39 1.3<br />
69 129,690 502 97.5% 14.8% 3.1% 31 7.0<br />
69A 282,370 825 73.6% 7.0% 2.5% 31 9.2<br />
69W 308,098 938 76.7% 7.3% 9.8% 32 7.8<br />
69N 32,738 130 100.0% 16.8% 9.0% 50 8.7<br />
70*** 56,516 270 100.0% 4.9% 33.5% 36 6.9<br />
71 835,778 2,620 79.0% 4.8% 10.0% 38 5.6<br />
91 61,244 230 94.7% 5.7% 13.8% 49 2.1<br />
Average 272,186 878 80.7% 5.9% 7.7% 36.5 5.5<br />
UCSC<br />
10 305,527 1,091 90.0% 90.2% 0.5% 27 0.9<br />
12A** 9,406 52 93.2% 94.5% 0.3% 30 0.1<br />
13** 115,115 677 100.0% 94.4% 0.3% 19 0.2<br />
15** 376,444 2,214 100.0% 93.8% 0.5% 24 0.4<br />
16** 905,191 2,877 80.1% 90.1% 0.5% 26 0.4<br />
19** 270,730 938 87.3% 88.8% 0.6% 25 0.4<br />
20** 230,030 780 85.4% 83.7% 1.0% 26 0.4<br />
Average 316,063 1,233 87.4% 90.2% 0.6% 25.4 0.5<br />
Regional<br />
17 244,618 817 84.2% 0.4% 0.6% 58 1.9<br />
Total 5,485,258 19,368 83.9% 40.0% 4.1% 31.4 3.7<br />
* Some or all Trips Operated During San Lorenzo Valley School Term Only *** All Trips Operate Only During Cabrillo College School Term<br />
** Some or all Trips Operated During UCSC School Term Only **** Service Operates Mid-November Through Mid-April Only<br />
101015<br />
SANTA CRUZ <strong>METRO</strong> SHORT RANGE TRANSIT PLAN<br />
Page 4 - 4<br />
WILBUR SMITH ASSOCIATES
SYSTEM EVALUATION / CURRENT PERFORMANCE<br />
<strong>METRO</strong>’s current performance summary highlights the strengths and weaknesses in terms of transit<br />
markets within the County. Three types of routes stand out above the rest in terms of ridership, farebox<br />
recovery and operational efficiency. These include UCSC routes, intercity routes (Watsonville-<strong>Santa</strong> <strong>Cruz</strong><br />
and Scotts Valley to <strong>Santa</strong> <strong>Cruz</strong>) and the Highway 17 Express regional route. While these 16 routes only<br />
comprise 40% of the total routes, their service accounts for 84% of all riders and 87% of all revenue. The<br />
local and rural services while not operating as productively as the other categories assist <strong>METRO</strong> in<br />
meeting other goals such as coverage and connectivity.<br />
The outreach results identify some significant hurdles that <strong>METRO</strong> can address in its continuing efforts to<br />
improving transit service. Improving on-time performance, increasing frequency and adapting service and<br />
communications to its contrasting populations and riders will improve the transit experience for its current<br />
riders and help capture new or “choice riders” within the County.<br />
The benefit of <strong>METRO</strong> having in place a performance monitoring program is that it can provide<br />
information to decision makers so they can make informed decisions regarding how dollars for services can<br />
be best used to meet local priorities. The system evaluation findings and information learned from the<br />
background reports and community involvement discussions suggest an opportunity for developing a new<br />
vision for transit services within <strong>Santa</strong> <strong>Cruz</strong> County.<br />
This change would increase the visibility of public transportation within the transportation network and<br />
work to create an environment where transit is not secondary to the automobile. This vision would focus<br />
on creating high density service corridors within the County to meet those corridors with the highest<br />
demand for services. Ultimately these could be partnered with transit preferential operations and transitsupportive<br />
land use that would increase operational efficiency of the transit vehicles and increase the<br />
market share of transit. Local and rural service would be tailored to the geographic needs of each<br />
community in terms of frequency, span of service and vehicle type and allow connectivity to these transit<br />
corridors. The local services would provide geographic coverage to the broader community at levels which<br />
are commensurate with needs identified. The service plan suggested in the following chapter highlights the<br />
specific components of this transit service.<br />
101015<br />
SANTA CRUZ <strong>METRO</strong> SHORT RANGE TRANSIT PLAN<br />
Page 4 - 5<br />
WILBUR SMITH ASSOCIATES
CHAPTER 5: SERVICE IMPROVEMENT PROGRAM<br />
OVERVIEW<br />
Based on the results and findings from the previous chapters, the focus of this chapter is to move forward<br />
with service improvement recommendations. Data used in the development of this program are taken from<br />
the reported FY 06-07 results.<br />
COMMUNITY OUTREACH / COMMUNICATION<br />
It would appear that future service improvements should be complemented with an increase in<br />
communication and outreach for existing and potential transit riders. This strategy should be flexible to reach<br />
the various markets of transit riders within Metro’s service area. For example, the methods and techniques<br />
used to communicate with students at UCSC differ from those of passengers in Watsonville who make a daily<br />
commute to <strong>Santa</strong> <strong>Cruz</strong>. It is important to distinguish the various markets in the County and tailor<br />
communication and outreach to best serve their needs.<br />
The results of the outreach conducted as part of the study recommends the following improvements:<br />
• Upgrade <strong>METRO</strong>’s website to increase usability and improve the image of the agency<br />
• Print all marketing and reference material is both English and Spanish<br />
• Distribute transit information by mail including schedules and service updates<br />
• Consider deployment of bi-lingual drivers in areas of high Spanish-speaking riders<br />
FIXED ROUTE SERVICE PLAN<br />
<strong>METRO</strong>’s current fixed route service has developed incrementally over the years, adding service when funds<br />
allowed and reducing service when resources were limited. This SRTP, to a large degree, is the first<br />
comprehensive look at how the fixed route service reached the point it is at today and allows an opportunity<br />
to assess what the best use of <strong>METRO</strong>’s resources will be in the years to come.<br />
Current Service Provided<br />
Using the route classifications identified in Chapter 2, an analysis of service hours by route type was<br />
completed to show how service is currently being allocated between the various service areas. Table 5-1<br />
contains hours of service by route classification and shows that Intercity Routes currently account for 47% of<br />
all service provided by <strong>METRO</strong>. Local service and UCSC services account for a combined 39% of service<br />
with rural and regional services composing the remaining 14%.<br />
101015<br />
SANTA CRUZ <strong>METRO</strong> SHORT RANGE TRANSIT PLAN<br />
Page 5 - 1<br />
WILBUR SMITH ASSOCIATES
SERVICE IMPROVEMENT PROGRAM<br />
Table 5-1: Hours of Service (by Route Classification)<br />
Classifications Routes Total Service Hours<br />
Rural 33, 34, 40, 41, 42, 72, 76 8,972 4.9%<br />
Local/Feeder 3, 4, 7, 9, 31, 32, 53, 54, 55, 56, 66, 68, 68N, 74, 75, 79, 88 34,926 19.1%<br />
Intercity 35, 35A, 69, 69A, 69W, 69N, 70, 71, 91 85,617 46.8%<br />
UCSC 10, 12, 13, 15, 16, 19, 20 36,654 20.0%<br />
Regional 17 16,963 9.3%<br />
Total: 183,132 100%<br />
An analysis of rural, local and intercity services shows the allocation of service within these areas. For rural<br />
services, the majority of hours are distributed between Bonny Doon/Davenport and Corralitos as shown in<br />
Table 5-2. Local service in the San Lorenzo Valley accounts for less than 5% as many hours as the other two<br />
rural markets and is also without weekend service.<br />
Table 5-2: Service Hours of Rural Routes (by Service Area)<br />
Routes<br />
Total<br />
San Lorenzo Valley 33, 34 354 3.9%<br />
Bonny Doon/ Davenport 40, 41, 42 4,227 47.1%<br />
Corralitos 72, 76 4,391 48.9%<br />
Total: 8,972 100.0%<br />
An analysis of local/feeder services shows 36% of all local service hours going toward <strong>Santa</strong> <strong>Cruz</strong> services,<br />
25% toward the communities of Capitola/Live Oak and approximately 24% going to Watsonville. Scotts<br />
Valley/Graham Hill and Aptos/Rio Del Mar/La Selva Beach account for 5-10% each. Due to the interlining<br />
practices of <strong>METRO</strong> and the designation of UCSC routes in a separate category, these hours may be a bit<br />
misleading. Both Watsonville and <strong>Santa</strong> <strong>Cruz</strong> have additional local service provided by the intercity routes<br />
that have stops in each of the communities plus <strong>Santa</strong> <strong>Cruz</strong> has an additional 36,000 hours added in UCSC<br />
services. Although the UCSC service is operated based on the needs of the students and faculty and operates<br />
only during school terms, these hours alone are four times as many as either Capitola/Live Oak or<br />
Watsonville local service hours. Route 66’s 6,757 hours, assigned to <strong>Santa</strong> <strong>Cruz</strong> local in the above analysis,<br />
could also be distributed between <strong>Santa</strong> <strong>Cruz</strong> and Capitola since both communities are served.<br />
Table 5-3: Service Hours of Local Routes (by Service Area)<br />
Routes<br />
Total<br />
<strong>Santa</strong> <strong>Cruz</strong> 3, 4, 7, 9, 66, 88 12,543 35.9%<br />
Watsonville 74, 75, 79 8,266 23.7%<br />
Scotts Valley/ Graham Hill 31, 32 1,916 5.5%<br />
Capitola/Live Oak 53, 54, 68, 68N 8,719 25.0%<br />
Aptos/Rio Del Mar/La Selva Beach 55, 56 3,482 10.0%<br />
Total: 34,926 100.0%<br />
101015<br />
SANTA CRUZ <strong>METRO</strong> SHORT RANGE TRANSIT PLAN<br />
Page 5 - 2<br />
WILBUR SMITH ASSOCIATES
SERVICE IMPROVEMENT PROGRAM<br />
Intercity service provides 73% of its hours to the <strong>Santa</strong> <strong>Cruz</strong> to Watsonville service and the remaining hours<br />
to the <strong>Santa</strong> <strong>Cruz</strong> to Scotts Valley service as shown in Table 5-4. The intercity routes category has the single<br />
highest number of hours apportioned to it. As noted earlier, many of these intercity services provide<br />
local/feeder services once they reach the local jurisdiction, however, which are included in the table below.<br />
Table 5-4: Service Hours for Intercity Routes (by Service Area)<br />
Routes<br />
Total<br />
<strong>Santa</strong> <strong>Cruz</strong>-Watsonville 69, 69A, 69W, 69N, 70, 71, 91 62,749 73.3%<br />
<strong>Santa</strong> <strong>Cruz</strong>-Scotts Valley 35, 35A 22,868 26.7%<br />
Total: 85,617 100.0%<br />
Service Consumed<br />
Table 5-5 below shows that <strong>METRO</strong>’s budgeting of hours closely resembles the ridership distribution on the<br />
services. The exception here is the UCSC routes that proportionally have nearly twice the ridership as service<br />
hours than the local/feeder and rural routes where the opposite is true.<br />
Table 5-5: Comparison of Service Hours to Ridership<br />
Classifications* Total Annual Service Hours Annual Ridership<br />
Rural 8,972 4.9% 119,426 2.2%<br />
Local/Feeder 34,926 19.1% 731,282 13.3%<br />
Intercity 85,617 46.8% 2,177,489 39.7%<br />
UCSC 36,654 20.0% 2,212,443 40.3%<br />
Regional 16,963 9.3% 244,618 4.5%<br />
Total 183,132 100% 5,485,258 100%<br />
The UCSC routes are the strongest of the routes classifications in terms of ridership. This finding is<br />
highlighted in the tables found in Chapter 4. Two of the top three routes in terms of average weekday<br />
ridership are UCSC routes (Routes 15 and 16). Field observations and stakeholder discussions also revealed a<br />
fair number of pass-ups and standing loads on these UCSC routes.<br />
Aside from the UCSC routes, two intercity routes connecting <strong>Santa</strong> <strong>Cruz</strong> to both Watsonville and Scotts<br />
Valley also show significant levels of ridership. Route 71 connecting <strong>Santa</strong> <strong>Cruz</strong> to Watsonville, is the second<br />
highest individual route in terms of ridership in the whole system. Route 35/35A is the fourth highest<br />
individual route in terms of ridership in the system and connects <strong>Santa</strong> <strong>Cruz</strong> and Scotts Valley.<br />
Travel Patterns<br />
To no surprise, the travel patterns observed from origin/destination survey results were concentrated along<br />
the key east/west (Highway 1) and north/south (Highway 17) travel corridors in the County. The east/west<br />
travel pattern between <strong>Santa</strong> <strong>Cruz</strong> on the west and Watsonville on the east traversed the Highway 1 corridor.<br />
Communities in between these two cities also contributed to the travel between these anchor cities.<br />
North/south travel is primarily concentrated along the Highway 17 corridor between <strong>Santa</strong> <strong>Cruz</strong> and <strong>Santa</strong><br />
Clara County to the north.<br />
101015<br />
SANTA CRUZ <strong>METRO</strong> SHORT RANGE TRANSIT PLAN<br />
Page 5 - 3<br />
WILBUR SMITH ASSOCIATES
SERVICE IMPROVEMENT PROGRAM<br />
Linked trips were further broken down by origin location and purpose for analysis. The origin-destination<br />
figures in Appendix D show transit trips with origin locations in <strong>Santa</strong> <strong>Cruz</strong>, Watsonville, Capitola, and Scotts<br />
Valley. <strong>Santa</strong> <strong>Cruz</strong> trips show a high percentage remaining local or to the UCSC campus. Origins appear to<br />
be concentrated north of Laurel Street and south of Highway 1 with the highest concentrations along the<br />
Soquel corridor. Most of the trips originating in <strong>Santa</strong> <strong>Cruz</strong> do not extend much past Capitola and Cabrillo<br />
College. The majority of trips are school based trips.<br />
Trips originating in Watsonville show travel patterns that are more intercity than <strong>Santa</strong> <strong>Cruz</strong>, with high<br />
demand destinations in Capitola, Live Oak and <strong>Santa</strong> <strong>Cruz</strong>. Origin locations for these trips are concentrated<br />
near the Downtown <strong>Transit</strong> Center and along Main St. and Freedom Boulevard. Trip purposes for those<br />
trips originating in Watsonville are much more diverse than <strong>Santa</strong> <strong>Cruz</strong>, with significantly fewer school trips<br />
and higher percentages of work, shopping and medical trips.<br />
The majority of Capitola trips originated at or near the Capitola Mall on 41 st Street. These trips are linked<br />
primarily to either <strong>Santa</strong> <strong>Cruz</strong> or Watsonville, with a few trips going to Cabrillo College and north to <strong>Santa</strong><br />
Clara County. Trip purposes were diverse and included a combination of school, work and shopping trips.<br />
Scotts Valley showed the lowest number of total trips originating within its boundaries. Trip destinations<br />
were split between <strong>Santa</strong> <strong>Cruz</strong> and <strong>Santa</strong> Clara County. Nearly all trip purposes were school, work or medical<br />
trips.<br />
Countywide, forty-five percent (45%) of all surveyed trips were school trips and thirty-six percent (36%) were<br />
completed for work purposes. Combining these two purposes represented over eighty percent (80%) of all<br />
responses in the on-board survey. Figures 5-1 and 5-2 break down school-based and work-based by origin<br />
location. Appendix D shows additional origin-destination plots from the on-board survey results.<br />
School-based trips are concentrated primarily between <strong>Santa</strong> <strong>Cruz</strong> and Capitola, with noticeable activity<br />
between Watsonville and <strong>Santa</strong> <strong>Cruz</strong>. UCSC and Cabrillo College appear to anchor the destinations for this<br />
activity. Although the majority of UCSC trip origins are located in and around Downtown <strong>Santa</strong> <strong>Cruz</strong>, a<br />
significant number of trips represent a student body population that is living further away from campus in the<br />
communities of Live Oak and Capitola. Cabrillo trips also appear to have a strong attraction to Downtown<br />
<strong>Santa</strong> <strong>Cruz</strong> and portions of Live Oak and Capitola.<br />
101015<br />
SANTA CRUZ <strong>METRO</strong> SHORT RANGE TRANSIT PLAN<br />
Page 5 - 4<br />
WILBUR SMITH ASSOCIATES
SERVICE IMPROVEMENT PROGRAM<br />
Figure 5-1: Home Based School <strong>Transit</strong> Trips<br />
101015<br />
SANTA CRUZ <strong>METRO</strong> SHORT RANGE TRANSIT PLAN WILBUR SMITH ASSOCIATES<br />
Page 5 - 5
SERVICE IMPROVEMENT PROGRAM<br />
Figure 5-2: Home-Based Work <strong>Transit</strong> Trips<br />
101015<br />
SANTA CRUZ <strong>METRO</strong> SHORT RANGE TRANSIT PLAN WILBUR SMITH ASSOCIATES<br />
Page 5 - 6
SERVICE IMPROVEMENT PROGRAM<br />
Work-based trips are much more dispersed than school-based trips. A significantly higher number of trips<br />
occur between the communities of <strong>Santa</strong> <strong>Cruz</strong> and Capitola/Live Oak and Watsonville and Capitola/Live<br />
Oak. <strong>Santa</strong> Clara County travel is also recorded all along the Highway 1 corridor into Watsonville.<br />
Scheduling Practices<br />
<strong>METRO</strong> relies on the HASTUS computer scheduling application to create block assignments and driver<br />
assignments. Nearly all service (except routes 17 and 71) are currently interlined, creating blocks with a mix<br />
of rural, intercity, UCSC and local routes. This process allows for the most efficient use of drivers’ platform<br />
time based on the route cycles input to the system. While this process may create the most efficient use of<br />
driver resources, the rigidness of the system also creates little room for flexibility within the schedule. Small,<br />
incremental delays in drive times due to roadway congestion, high loading, etc. can lead to breakdowns with<br />
the scheduling process. For example, any delays in the Route 1 corridor could adversely impact local service<br />
in Watsonville, which would be the next service provided by that vehicle.<br />
<strong>METRO</strong> has four different operating periods within its fiscal year where service can be modified and<br />
adjusted. Adjustment between these operating periods allows for additional service to be supplied during<br />
school terms and to meet the demand of seasonal tourist populations that visit <strong>Santa</strong> <strong>Cruz</strong> County. During<br />
each of these bid periods, drivers re-select runs composed of various block groups. Priority for run selection<br />
is based on seniority of the drivers.<br />
This full service interlining practice was established in 2006 to allow the required number of driver break<br />
periods and when those were taken per the Industrial Welfare Commission (IWC). Previously there was less<br />
interlining and routes were more restricted to a certain geographic zone or market. This prior scheduling<br />
process typically resulted in retaining the same driver and bus in the same part of the County, operating the<br />
same type of route. This practice had the advantages of driver familiarity by his or her passengers and<br />
potentially made the buses less susceptible to regional traffic delays. The disadvantage was the general driver<br />
resource loss in efficiency, adding to overall operating costs of providing transit in the County.<br />
While interlining may optimize agency resources allocated to service, the resulting performance and<br />
intuitiveness or understanding of the service can be compromised. As mentioned above, poor on-time<br />
performance can be linked to the rigidness of the scheduling which was highlighted as a major concern during<br />
nearly all outreach efforts. Thus, uncoupling the interlining practice to allow drivers and routes to operate the<br />
same type of daily service would improve on-time performance and allow operations planning to better gauge<br />
the estimates of route specific delay, even if this requires additional hours (and thus cost) to cushion the<br />
current service.<br />
The uncoupling of service would also support the development of a more intuitive or understandable system<br />
for passengers. The current 69, 69A, 69W, 69N grouping and 35/35A services should be simplified into one<br />
route so passengers have less detail to filter through when planning their trips. The development of uniform<br />
headways which may support a memory schedule for passengers would be more feasible with the noninterlined<br />
routes which would also ease the use for passengers.<br />
Service Structure<br />
As discussed, the geography and topography of <strong>Santa</strong> <strong>Cruz</strong> County have created a development pattern that is<br />
concentrated along the Pacific Coast or Highway 1 corridor in the southern portion of the County. The<br />
Highway 17 corridor, linking <strong>Santa</strong> <strong>Cruz</strong> County to <strong>Santa</strong> Clara County to the north, is the other significant<br />
connection to growth and development. Transportation and thus transit service are also focused along these<br />
key settlement corridors.<br />
The current service pattern operated by <strong>METRO</strong> is predominately a hub and spoke operations with the hub<br />
of activity focused around two primary transit centers in Downtown <strong>Santa</strong> <strong>Cruz</strong> and Downtown Watsonville<br />
101015<br />
SANTA CRUZ <strong>METRO</strong> SHORT RANGE TRANSIT PLAN<br />
Page 5 - 7<br />
WILBUR SMITH ASSOCIATES
SERVICE IMPROVEMENT PROGRAM<br />
and two secondary transit centers in Capitola (Capitola Mall) and Scotts Valley (Cavallaro <strong>Transit</strong> Center).<br />
This configuration funnels most passengers through one of these facilities during some point of their trip.<br />
Heavy transfer activity is also experienced at these locations due to this structure.<br />
The hub and spoke operation was developed when Downtown <strong>Santa</strong> <strong>Cruz</strong> was the hub for region in terms of<br />
population and employment. As the County has developed and expanded, the transit system has grown<br />
incrementally to meet the new needs of the new growth. Recent and future trends (see figures 2-2, 2-3 and 2-<br />
4) show <strong>Santa</strong> <strong>Cruz</strong> continuing to be the economic center in County, but show Watsonville as the major<br />
center for population and households. <strong>Santa</strong> Clara County also adds another major employment destination<br />
for those living in <strong>Santa</strong> <strong>Cruz</strong> County and offers lower cost housing options for those who work in <strong>Santa</strong><br />
<strong>Cruz</strong> County.<br />
Growth patterns and the topography within the County have also shaped the development of the transit<br />
system. <strong>Transit</strong>-based activity centers are not centered around one central location such as a traditional<br />
Downtown employment center. In <strong>Santa</strong> <strong>Cruz</strong> County these activity centers are primarily schools and<br />
university, hospitals, major shopping centers and business parks which are dispersed among the developed<br />
urban areas. Physical barriers created by the ocean and hills and transportation corridors have resulted in a<br />
settlement pattern that straddles the Highway 1 corridor from <strong>Santa</strong> <strong>Cruz</strong> to Watsonville. The service plan<br />
needs to take these development patterns into consideration.<br />
To adapt to this change occurring within and adjacent to <strong>Santa</strong> <strong>Cruz</strong> County, <strong>METRO</strong> should consider a new<br />
servicing planning concept that takes a more regional approach to providing transit while focusing on<br />
efficiency. This new approach would replace the current hub and spoke operations with a trunk and feeder<br />
service. The trunk and feeder concept would allow supply and demand of transit to be more closely matched,<br />
thus improving the overall efficiency of the system. This matching of supply and demand is completed by<br />
adjusting service levels to target demands within different corridors and areas and adjusting the vehicle types<br />
and operations to needs of that area.<br />
A trunk and feeder service would provide the key linkages between the County’s major activity hubs through<br />
high frequency, high capacity trunk line service. This trunk service would focus on moving high numbers of<br />
patrons between major regional centers in an effective and efficient manner. Complementing the trunk line<br />
service would be a series of feeder connections that would supply the public transportation needs of the<br />
individual community while providing connections to the regional trunk line service. While the trunk line<br />
focuses on high capacity and high frequency, the feeder service would focus on reliability and connectivity for<br />
its passengers. Vehicles used for this service would ultimately be appropriate for the community based on the<br />
infrastructure and the desires of the community. Stop locations would be convenient for the majority of<br />
residents in the communities and on-time performance would be stressed to ensure patrons will have<br />
confidence in the system and do not get stranded in areas where service is less frequent.<br />
Figure 5-3 shows the basic structure of the trunk and feeder concept. The east/west trunk would run along<br />
the Highway 1/Soquel Ave Corridor while the north/south link would operate along Highway 17, Mt.<br />
Hermon Road and Highway 9. A third trunk service would operate from the <strong>Santa</strong> <strong>Cruz</strong> Metro Center to<br />
UCSC to meet the high ridership needs of the campus community. Feeder service would be supplied to the<br />
communities within the County along these corridors. Those communities not located along the trunk line<br />
corridor would be provided a lifeline transit service that falls under the “rural” classification of services.<br />
101015<br />
SANTA CRUZ <strong>METRO</strong> SHORT RANGE TRANSIT PLAN<br />
Page 5 - 8<br />
WILBUR SMITH ASSOCIATES
SERVICE IMPROVEMENT PROGRAM<br />
Figure 5-3: Proposed Trunk and Feeder Concept Map<br />
101015<br />
SANTA CRUZ <strong>METRO</strong> SHORT RANGE TRANSIT PLAN WILBUR SMITH ASSOCIATES<br />
Page 5 - 9
SERVICE IMPROVEMENT PROGRAM<br />
PROPOSED TRUNK AND FEEDER CONCEPT<br />
Subsequent to the preparation of the Service Improvement Program economic conditions have substantially<br />
changed. In addition, several policy issues were raised by the Board as described in Chapter 7. The proposed<br />
service plan will be reviewed in a subsequent SRTP or planning study and would be phased into operation as<br />
resources allow and demographic changes occur. The following description of the plan contains the<br />
following proposed trunk lines and feeder services:<br />
• <strong>Santa</strong> <strong>Cruz</strong> – Watsonville (Trunk Line)<br />
• <strong>Santa</strong> <strong>Cruz</strong> – UCSC (Trunk Line)<br />
• <strong>Santa</strong> <strong>Cruz</strong> – San Lorenzo Valley (Trunk Line)<br />
• <strong>Santa</strong> <strong>Cruz</strong> Local (Feeder Service)<br />
• Watsonville Local (Feeder Service)<br />
• Scotts Valley/Graham Hill (Feeder Service)<br />
• Capitola/Live Oak Local (Feeder Service)<br />
• Aptos/Rio Del Mar/La Selva Beach (Feeder Service)<br />
<strong>Santa</strong> <strong>Cruz</strong> – Watsonville (Trunk Line)<br />
Overview<br />
<strong>Santa</strong> <strong>Cruz</strong> to Watsonville accounts for a significant percentage of current ridership and service. With<br />
Watsonville anticipated to surpass <strong>Santa</strong> <strong>Cruz</strong> in total population by 2015, demands from this travel market<br />
are anticipated to increase. Infrastructure constraints along this corridor can be viewed as both opportunities<br />
and impediments for future <strong>METRO</strong> service. Impediments lie in the current congestion that is experienced<br />
along Highway 1 during the peak travel periods. This delay increases bus travel time and creates a high<br />
degree of variance that makes bus operations difficult to schedule, leading to poor on-time performances.<br />
Depending upon the future actions within the County, opportunities may exist to speed up bus operations<br />
and make transit a more desirable mode of travel for regional commuters. Even with the current operating<br />
conditions, a trunk line service across the County is necessary to provide a backbone of service connecting<br />
the County’s major activity centers.<br />
Routes 69, 69A, 69W, 69N, 71, and 91 serve the current <strong>Santa</strong> <strong>Cruz</strong> to Watsonville corridor. Route 91 is the<br />
express route offered only during peak periods that operates along the longest stretch of Highway 1 and has<br />
the least number of local stops and thus the lowest travel time between the Watsonville <strong>Transit</strong> Center and<br />
the <strong>Santa</strong> <strong>Cruz</strong> Metro Center – 31-50 minutes. Route 70 operates between Cabrillo College and Downtown<br />
<strong>Santa</strong> <strong>Cruz</strong> along the Soquel Avenue corridor. Route 69 operates between the Downtown Metro Center and<br />
Capitola Mall along Soquel Avenue and Capitola Road. Route 69N provides nighttime service between<br />
Cabrillo College, Capitola Mall and the Downtown Metro Center.<br />
Scheduling<br />
Current interlining practices have the 69, 69A, 69W, 69N, or 91 operating at least one run in 38 different<br />
blocks. The nature of these long routes and tight scheduling practices create plentiful opportunities for delay<br />
to occur during these trips. Often times these will be scheduled at the beginning or in the middle of the<br />
blocks, causing the coupled local routes to become delayed due to intercity route portion of the block.<br />
101015<br />
SANTA CRUZ <strong>METRO</strong> SHORT RANGE TRANSIT PLAN<br />
Page 5 - 10<br />
WILBUR SMITH ASSOCIATES
SERVICE IMPROVEMENT PROGRAM<br />
Scheduling of the 71 is done differently within the HASTUS program. Rather than adding all of the route’s<br />
runs to the pool of possibilities of other lines, the 71 has been interlined with itself with a number of blocks.<br />
This process assigns one bus to do only route 71 trips during the driver’s shift.<br />
Service Characteristics<br />
These strong ridership routes have relatively high passengers per service hour and revenue hour. Trips on<br />
these routes are focused more on work and medical trips and less on school trips. UCSC and Cabrillo<br />
students make up only about 5% of the total ridership and bike and wheelchair passengers are relatively<br />
minimal.<br />
Service Delivery<br />
The <strong>Santa</strong> <strong>Cruz</strong> to Watsonville corridor is currently well served compared to other areas within the County.<br />
A trip between the Metro Center in <strong>Santa</strong> <strong>Cruz</strong> and the Watsonville <strong>Transit</strong> Center during the weekday can be<br />
made every 30 minutes on the 71 or 69A/69W routes which combine to offer four trips per hour.<br />
Frequencies of route 71 increase between 2 PM and 7 PM to 15 minute headways, creating six trips per hour<br />
between the two services during this time. These services start prior to 6 AM and run past midnight,<br />
delivering a span of service over 18 hours. Route 91 adds a few additional peak hour services along the<br />
corridor. Weekend service is provided every 30 minutes by the 71 and 69A/69W services between the hours<br />
of 6 AM and 11:30 PM. One AM trip from Watsonville <strong>Transit</strong> Center is offered on Route 91 during the<br />
weekend. Again, these staggered schedules create a near 15-minute frequency.<br />
Restructuring<br />
The trunk line service should have the highest levels of service of any of the routes in the system. While the<br />
current routes combine to offer a fairly high level of service along the corridor, the different deviations taken<br />
between the two transit centers and various sub-markets serviced by these routes requires significantly higher<br />
hours to be allocated to the corridor. The overall restructuring concept would create a frequent and direct<br />
service that would still allow a one-seat trip to occur for the majority of riders within this corridor.<br />
The short-term routing modifications of this trunk line service should be a hybrid of the current Routes 71<br />
and 91. From <strong>Santa</strong> <strong>Cruz</strong> Metro Center, the service would take Front Street and River Street to reach Water<br />
Street. Water Street would be taken to Soquel Avenue where the service would turn and follow Soquel<br />
Avenue to Dominican Hospital and Cabrillo College. The service would remain on Soquel Drive until State<br />
Park Drive where it would merge onto Highway 1 and continue until the Main Street exit in Watsonville.<br />
Service would follow Main Street to Rodriguez Street and the Watsonville <strong>Transit</strong> Center. Running time of<br />
this service is estimated to be around 70 minutes, with higher run times in the peak and lower times during<br />
the off-peak and weekend periods.<br />
Currently, peak hour traffic creates travel speeds and travel times on the freeway that are similar to those on<br />
the adjacent arterial streets. Without the advantages of travel time savings, it is logical to operate transit along<br />
the arterial network in the corridor including Main Street, Soquel Avenue, and Water Street. If changes occur<br />
along this corridor that make bus operations more efficient along Highway 1, the service strategy should<br />
adapt to include longer portions of running way along the high capacity freeway.<br />
The most significant change in service along this corridor will be the absence of a direct connection to the<br />
existing transit center at Capitola Mall. This ¾ mile deviation from Soquel Drive would add significant travel<br />
time between Watsonville and <strong>Santa</strong> <strong>Cruz</strong>, especially with the new retail development at Soquel Avenue and<br />
41 st Street. This increase in travel time and reduction of travel speed would compromise the goal of the trunk<br />
line system. Local or “feeder” services between Soquel Avenue and the Capitola Mall along 41 st Street and<br />
Capitola Road would need to be added with the removal of these 69 routes. The new service should be<br />
frequent enough to adequately meet the demand of these transit riders.<br />
101015<br />
SANTA CRUZ <strong>METRO</strong> SHORT RANGE TRANSIT PLAN<br />
Page 5 - 11<br />
WILBUR SMITH ASSOCIATES
SERVICE IMPROVEMENT PROGRAM<br />
Proposed Trunk Line Operation<br />
Based on above operating conditions and service improvement goals, estimates to provide 10 minute peak/15<br />
minute off-peak service and 15 minute night service during the weekday and 15 minute frequencies<br />
throughout the day on the weekends would require approximately 60,000 service hours. This assumes an 18<br />
hour span of services during all days of the week. In 2007, Routes 69, 69A, 69W, 69N, 71, and 91 were<br />
allocated nearly 63,000 annual service hours, or 34% of the system total. Thus, there would be an additional<br />
3,000 hours available following the implementation of the new trunk service.<br />
In addition, gaps in local service, specifically in Capitola and the connection to the Capitola Mall would be<br />
created by the removal of these services. These gaps would either need to be replaced by modifying or<br />
extending Routes 53, 66 or 68 or adding new local shuttle service that would connect Water/Soquel, the<br />
Capitola Mall, and 41 st /Soquel. A new service, operating on 30 minute headways would need an additional<br />
10,000 hours. An extension of one of the existing services would vary but all services would have to be<br />
upgraded from their current 60-120 minute frequencies to 30 minute frequencies, resulting in significantly<br />
more hours of service.<br />
Advantages of the trunk line service over the existing routes along this corridor would come from the more<br />
uniform scheduling of the service and anticipated reduced confusion experienced by the passenger. It would<br />
appear that as <strong>METRO</strong> continually looks for ways to improve its service, it should consider adding a limited<br />
stop or other type of rapid service along this corridor. This service would take the same alignment as the<br />
intercity service but stop at fewer locations and reduce the overall travel time for passengers traveling<br />
between the major destinations along the corridor. Adding <strong>Transit</strong> Signal Priority (TSP) and queue jumps at<br />
congested intersections could also increase performance of the operation.<br />
A longer term service strategy could come from improvements along the Highway 1 corridor between<br />
Watsonville and <strong>Santa</strong> <strong>Cruz</strong>. The addition of a high-occupancy vehicle (HOV) lane would allow <strong>METRO</strong><br />
buses to increase travel speeds and make it more efficient to operate along longer portions of the highway.<br />
Another future option for the corridor would be to operate buses along the shoulder of Highway 1. Agencies<br />
in ten states across the country are currently operating successful examples of this type of operation.<br />
Conditions typically needed for operating buses on shoulders include congestion along the highway, an<br />
express bus service and a minimum of 11 foot lanes. Buses commonly only use the shoulder only when<br />
travel speeds decrease below 35 mph and do not exceed this speed limit when using the shoulder. San Diego<br />
Metropolitan <strong>Transit</strong> System is the only current example of this type of operation in California. If it appears<br />
Highway 1 will not include a dedicated high-occupancy vehicle lane in the future, <strong>Santa</strong> <strong>Cruz</strong> <strong>METRO</strong> should<br />
consider a study to assess the feasibility of bus on shoulder operations.<br />
<strong>Santa</strong> <strong>Cruz</strong> – UCSC (Trunk Line)<br />
Overview<br />
The single largest market for transit ridership in the system is the UCSC student, faculty and staff population.<br />
The 2005 Long <strong>Range</strong> Development <strong>Plan</strong> by the University calls for significant future growth in both<br />
students (+5,100) and faculty (+980) over the next 15 years. A high percentage of students and most faculty<br />
live off-campus in <strong>Santa</strong> <strong>Cruz</strong> and the surrounding communities. The University is also geographically placed<br />
at a higher elevation than <strong>Santa</strong> <strong>Cruz</strong>, making travel between these two locations difficult for non-motorized<br />
modes. This displacement along with tight restrictions on personal vehicle parking makes the University a<br />
prime market for transit activities.<br />
<strong>METRO</strong> currently provides eight routes that can be classified as UCSC serving routes. Although four of<br />
these eight routes operate only during school terms, their total service hours are 20% of <strong>METRO</strong>’s annual<br />
totals. Nearly 40% of all service hours on the UCSC routes are dedicated to Route 16 which operates seven<br />
days a week with average headways of 10 minutes during the peak. The night service provided by Route 16<br />
101015<br />
SANTA CRUZ <strong>METRO</strong> SHORT RANGE TRANSIT PLAN<br />
Page 5 - 12<br />
WILBUR SMITH ASSOCIATES
SERVICE IMPROVEMENT PROGRAM<br />
creates a span of service from 6:30 AM to 2:00 AM during the weekday and 6:30 AM to 3:00 AM on the<br />
weekend. This service follows the most direct corridor from the Downtown <strong>METRO</strong> Station to the campus<br />
along Laurel Street, Mission Street, and Bay Street and circulates counterclockwise when arriving on campus.<br />
Routes 12, 13, 15 and 19 provide similar services to that of the Route 16 with slight differences. Route 12<br />
only operates once a day (Monday-Friday) and extends beyond the Downtown <strong>METRO</strong> center to serve the<br />
eastside of <strong>Santa</strong> <strong>Cruz</strong> and the Capitola Mall. Route 13 runs along Walnut Street instead of Laurel Street to<br />
access Mission Street, does not provide weekend or late night service, and runs a clockwise route through<br />
campus. Route 15 also operates clockwise when reaching campus and does not operate on weekend or night<br />
service. Route 19 offers seven day service and night service but uses Pacific Street, Beach Street and Bay<br />
Street instead of Laurel Street and Mission Street, adding service from the beach area to campus.<br />
Routes 10 and 20 also connect the Downtown <strong>METRO</strong> Center and the UCSC campus but enter the campus<br />
on routes other than Bay Street Route 10 is a seven day service that connects the Downtown <strong>METRO</strong><br />
Center to the UCSC campus but uses High Street instead of Bay Street to enter campus. This service adds<br />
additional local service to the northern areas of Downtown <strong>Santa</strong> <strong>Cruz</strong>. Route 20 is a seven day service that<br />
runs along Delaware Street in the southern portion of <strong>Santa</strong> <strong>Cruz</strong> and enters the campus via Western Drive.<br />
This alignment provides the campus’s Westside service.<br />
Scheduling<br />
Most of the routes serving UCSC from the Downtown <strong>METRO</strong> Center are scheduled by HASTUS to make<br />
a roundtrip in approximately 45 minutes. The interlining scheduling uses these rather short trips in one of 72<br />
different blocks currently assigned. While some of these blocks are entirely composed of UCSC routes, many<br />
are mixed in with intercity routes. Although this scheduling technique may maximize systemwide resources,<br />
it can often lead to irregular headways and poor on-time performance for those students and faculty relying<br />
on these routes to get to class and work.<br />
Service Characteristics<br />
Systemwide the UCSC routes are the highest in terms or ridership, even though some operate only during<br />
school terms. Farebox recoveries are nearly twice all other categories of routes and passengers per mile and<br />
per hour are three to four times higher than other routes. Overall, these routes are clearly the most<br />
productive for <strong>METRO</strong>. Eighty-seven percent of use on these routes was attributed to UCSC students and<br />
faculty.<br />
Service Delivery<br />
During school terms, the UCSC to Downtown <strong>Santa</strong> <strong>Cruz</strong> corridor (Bay Street-Mission Street-Laurel Street)<br />
has the highest frequency and longest span of service of any area in the County. Headways for routes<br />
between these key locations during the peak are less than 10 minutes. Service starts at 6:30 in the morning<br />
and runs to 2:00 AM during the weekdays and to 3:00 AM on weekends. Exceptions are campus service<br />
along High Street which terminates at 7:00 PM and service to the Westside ends around 9:00 PM.<br />
These high frequencies during the school hours allow passengers riding these services to not have to rely on<br />
set schedules and are less sensitive to irregularities in headways and poor on-time performance. It can be<br />
assumed that the wait time for a bus serving these markets is rarely longer than 10 minutes. Although<br />
frequencies may not be as much of issue on UCSC service, standing loads and pass-ups resulting from full<br />
loads are experienced on these popular routes, even with the high levels of service deliveries.<br />
Restructuring<br />
The UCSC corridor is a prime candidate for the identification of trunk line service due to its high ridership<br />
and major trip generators on both ends of the line. The current levels of service provide high frequencies<br />
101015<br />
SANTA CRUZ <strong>METRO</strong> SHORT RANGE TRANSIT PLAN<br />
Page 5 - 13<br />
WILBUR SMITH ASSOCIATES
SERVICE IMPROVEMENT PROGRAM<br />
from the Downtown <strong>METRO</strong> Center to UCSC but offer many deviations. The proposed trunk service<br />
would consolidate existing resources on the Laurel Street – Mission Street – Bay Street corridor to a uniform<br />
service and allow the existing UCSC and <strong>Santa</strong> <strong>Cruz</strong> local services not along this corridor to meet the trunk at<br />
key transfer locations. Once on campus, the service could either take a clockwise or counterclockwise loop.<br />
This alignment would mimic either the Route 15 or 16.<br />
Proposed Trunk Line Operation<br />
The UCSC trunk line service should meet the needs of the student body whose travel demands are primarily<br />
during the weekdays between the hours of 7:00 AM and 7:00 PM. <strong>METRO</strong> should consider defining these<br />
hours as the peak for UCSC services and operating service from 6:30 AM to 3 AM seven days a week. The<br />
proposed trunk line operation should operate every 10 minutes during this peak service time and 15 minutes<br />
during the off peak and weekend times.<br />
Operating service along this single trunk line corridor at the above defined frequencies and spans of service<br />
would take approximately 25,000 service hours. Routes 13, 15 and 16 alone, which traverse the same<br />
alignment as the proposed trunk line service currently consume over 20,000 service hours. An additional<br />
5,000 hours would result from the consolidation of these three routes and still keep other UCSC routes that<br />
service the campus via High Street and Western Drive.<br />
The current schedule shows a roundtrip travel time of approximately 45 minutes from the Downtown<br />
<strong>METRO</strong> Center to Science Hill on the UCSC campus and back. <strong>METRO</strong>, along with UCSC, should<br />
investigate improvements along this corridor that could reduce this time to closer to 35-40 minutes. These<br />
small improvements in travel time could result in significantly more service through this corridor.<br />
SANTA CRUZ – SAN LORENZO VALLEY/SANTA CLARA COUNTY (TRUNK<br />
LINE)<br />
Overview<br />
Aside from the developed areas along the Highway 1 corridor, the most significant concentration of<br />
population, jobs and housing are located in a number of relatively small communities north of <strong>Santa</strong> <strong>Cruz</strong> in<br />
the San Lorenzo Valley. Included in these communities are Scotts Valley, Ben Lomond, Felton, Brookdale<br />
and Boulder Creek. These communities are linked to the rest of the County through Highway 9 and Highway<br />
17. Highway 17 continues north from <strong>Santa</strong> <strong>Cruz</strong> County to connect to <strong>Santa</strong> Clara County and the<br />
metropolitan area of San Jose.<br />
Route 35/35A provides the backbone of service from <strong>Santa</strong> <strong>Cruz</strong> to the San Lorenzo Valley. The service<br />
runs from the Downtown <strong>METRO</strong> Center north to Highway 17 (via Front Street –River Street-Water Street-<br />
Ocean Street) and exits at Mt. Hermon Road in Scotts Valley. (Route 35A runs the same alignment except it<br />
continues one exit further north on Highway 17 to the Granite Creek Rd. exit.) After serving the Cavallaro<br />
<strong>Transit</strong> Center, the service continues along west on Mt. Hermon Road to Graham Hill Road eventually<br />
turning north on Highway 9 to serve the communities of Felton, Ben Lomond and Boulder Creek. A<br />
number of variations of the 35 and 35A route take passengers to various locations throughout the Valley<br />
including as far north as Big Basin State Park.<br />
Four other routes supplement the Route 35 service in San Lorenzo Valley but provide very few trips. In<br />
total, these four routes contribute an additional 12 daily weekday trips that are primarily focused on high<br />
school students’ trip needs. Routes 31 and 32 create a loop through Scotts Valley from the Downtown<br />
<strong>METRO</strong> Center using Highway 17 for either the northbound or southbound direction and Graham Hill<br />
Road for the opposite direction. Routes 33 and 34 never leave the Valley and start and end at Felton Faire<br />
along Graham Hill Road.<br />
101015<br />
SANTA CRUZ <strong>METRO</strong> SHORT RANGE TRANSIT PLAN<br />
Page 5 - 14<br />
WILBUR SMITH ASSOCIATES
SERVICE IMPROVEMENT PROGRAM<br />
The growth in the region’s economy in <strong>Santa</strong> Clara County and the availability of other regional and national<br />
transportation modes not found in <strong>Santa</strong> <strong>Cruz</strong> (Amtrak, Caltrain, International Airport, etc.) have created a<br />
transportation need between the two counties that <strong>METRO</strong> has filled with the Highway 17 Express bus<br />
service. This service was originally implemented following the earthquake in 1989, which has steadily grown<br />
in ridership, and is quickly becoming one of the most productive routes in the system.<br />
The topography and infrastructure in the San Lorenzo Valley provides challenges for <strong>METRO</strong> drivers.<br />
Narrow rights-of-way and sharp turning radii make this service difficult to operate with traditional 40 foot<br />
buses.<br />
Scheduling<br />
Routes 31, 32 and 35/35A are, for the most part, interlined with other services including intercity and UCSC<br />
services. This interlining is possible because these three routes all start and end at the Downtown <strong>METRO</strong><br />
Center. The other routes servicing the San Lorenzo Valley and <strong>Santa</strong> Clara County do not all start and end at<br />
the Downtown Center. Scheduling of these routes are all done within their own blocks, similar to the<br />
previously cited route 71 example.<br />
Service Characteristics<br />
The San Lorenzo Valley routes have lower ridership and are overall lower performing routes compared to its<br />
peer routes servicing major corridors in the County. The rural setting in which these routes operate makes it<br />
difficult to compete with other routes in terms of productivity. These routes do, however, provide necessary<br />
transit service to a significant portion of the County, meeting other performance goals of <strong>METRO</strong>.<br />
The Highway 17 service to <strong>Santa</strong> Clara County is supplying one of <strong>METRO</strong>’s fastest growing markets and<br />
efforts should be made to continue its use. The service is currently commuter-based but its connectivity to<br />
other transportation options which provide links to the San Francisco Bay Area and the East Bay attract<br />
multiple users to the service. The lengthy trip duration on this route makes it more sensitive to standing<br />
loads and pass-ups. A high level of bike use is also experienced on the Highway 17 service, highlighting the<br />
importance of adequate bike storage on this service.<br />
Service Delivery<br />
Route 35/35A currently operates 30 minute service from 6:30 AM to midnight during the weekdays and<br />
every 30 minutes from 7:30 AM to midnight on the weekends. Although this route is classified as an intercity<br />
route, the majority of local service to the San Lorenzo Valley communities is delivered by this route. Aside<br />
from route 35/35A, service to these parts of the County is limited to a few AM and PM peak hour trips.<br />
Service to <strong>Santa</strong> Clara County on the Highway 17 express service occurs approximately every hour with peak<br />
hour periods having 20-30 minute frequencies. Five AM trips to <strong>Santa</strong> Clara County are currently offered<br />
from the Soquel and Highway 1 Park and Ride lot that do not service the Downtown Metro Center and two<br />
AM trips are offered from the Metro Center that do not serve the Park and Ride lot. Inbound service in the<br />
PM has a selected four trips that serve Scotts Valley Drive. Outbound trips from <strong>Santa</strong> <strong>Cruz</strong> County are<br />
scheduled to allow transfers to the VTA, ACE and Amtrak commuter and regional rail services.<br />
Restructuring<br />
Increasing transit demands and traffic congestion along the Highway 17 corridor makes it a prime candidate<br />
for high frequency transit service. The trunk line service running to the San Lorenzo Valley should mimic the<br />
current 35/35A alignment but terminate in the north at the intersection of Highway 9 and Lomond Street in<br />
Boulder Creek. Frequencies and span of services on the 35/35A would be improved to provide a higher level<br />
of transit service to the San Lorenzo Valley. It appears that the current Highway 17 Express service would<br />
not be included in the trunk recommendation due to the different fare structure and vehicle fleet needs.<br />
101015<br />
SANTA CRUZ <strong>METRO</strong> SHORT RANGE TRANSIT PLAN<br />
Page 5 - 15<br />
WILBUR SMITH ASSOCIATES
SERVICE IMPROVEMENT PROGRAM<br />
However, opportunities to increase operations along Highway 17 and avoid any future congestion should be<br />
explored. These improvements, including designation of HOV lanes during peak hours or operating on the<br />
shoulder, would benefit both services operating in this portion of the trunk line corridor.<br />
It should be noted that the proposed trunk service between <strong>Santa</strong> <strong>Cruz</strong> and Watsonville would serve the<br />
existing Soquel Park and Ride lot, allowing a connection to the Highway 17 service at Water and Ocean<br />
Street. This would permit the Highway 17 service to operate shorter runtimes and provide more service from<br />
the Downtown <strong>METRO</strong> Center. Currently, there is a gap in the AM peak from 6:45 to 7:30 where no<br />
Highway 17 Express buses operate from the Downtown Center. Service could be added during this critical<br />
travel time with the new trunk and feeder system.<br />
Proposed Trunk Line Operation<br />
If the existing 35/35A were transitioned into a high frequency trunk line service, the concept would be to<br />
operate 16 hours during the weekday and 14 hours during the weekends with frequencies of 15 minutes<br />
during the weekday and 30 minutes on the weekend. Currently, nearly 23,000 service hours are assigned to<br />
the Route 35/35A. Estimates of providing 15 minute weekday and 30 minute weekend frequencies along this<br />
corridor would be just over 40,000 hours. This would require a significant increase in hours to achieve.<br />
Given the high demand for service in the previous two corridors, it would appear that consideration for trunk<br />
line status in this corridor would have a lower priority and be based on an ongoing review of demand<br />
including another transfer point at Water and Ocean referenced above as well as in Scotts Valley at the<br />
Cavallaro <strong>Transit</strong> Center on Kings Village Road. This park and ride lot would be the preferred location of a<br />
transfer location to the commuter drive-in populations. Future efforts should look to improve the location of<br />
this transfer point, moving it closer to Highway 17 and requiring less deviation for the Highway 17 service.<br />
Highway 17 Express service should be focused in the near term for operational improvements. Additional<br />
peak hour trips from Downtown <strong>Santa</strong> <strong>Cruz</strong> to San Jose should be added as resources become available. It is<br />
estimated that two additional AM and PM trips in both directions would require approximately 2,200 hours<br />
of new service.<br />
FEEDER SERVICES<br />
Feeder services will provide the key links for transit users with origins and destinations outside the three<br />
trunk line services. These services will focus less on speed and capacity and more on reliability and proximity<br />
to ensure passengers are not waiting excessively long for a bus or having to walk uncomfortable distances to<br />
reach a bus stop location.<br />
The results of the outreach showed a significant challenge for <strong>METRO</strong> is its ability to run reliable service.<br />
This is currently being evaluated by <strong>METRO</strong> with a recent technological upgrade that will allow a more<br />
precise runtime to be calibrated for each route. These runtimes will then be applied to the scheduling process<br />
to create a more precise scheduling match. While this process is anticipated to improve reliability and on-time<br />
performance, it will likely require a “cushion” to the existing service to a point where runtimes are accurate.<br />
The point has been made that improving the reliability of the existing service should be accomplished before<br />
other service improvements are implemented.<br />
In addition to cushioning the existing service, feeder routes may also consider a restructuring to allow more<br />
connectivity to key transfer points along the trunk routes. Table 5-6 below shows where these key transfer<br />
points are anticipated to occur along these new services. Upgrades may need to occur at some of these<br />
locations to ensure adequate passenger facilities are available.<br />
101015<br />
SANTA CRUZ <strong>METRO</strong> SHORT RANGE TRANSIT PLAN<br />
Page 5 - 16<br />
WILBUR SMITH ASSOCIATES
SERVICE IMPROVEMENT PROGRAM<br />
Table 5-6: Key Transfer Locations from Feeder to Trunk Services<br />
<strong>Santa</strong> <strong>Cruz</strong> – Watsonville<br />
Watsonville <strong>Transit</strong> Center<br />
(Watsonville)<br />
<strong>Santa</strong> <strong>Cruz</strong> – UCSC<br />
Bay & High<br />
(<strong>Santa</strong> <strong>Cruz</strong>)<br />
<strong>Santa</strong> <strong>Cruz</strong> to San Lorenzo<br />
Valley<br />
Highway 9 & Lomond<br />
(Boulder Creek)<br />
Green Valley & Main<br />
(Watsonville)<br />
Cabrillo College<br />
(Aptos)<br />
Soquel & 41st<br />
(Capitola)<br />
Soquel & Capitola<br />
(<strong>Santa</strong> <strong>Cruz</strong>)<br />
Water & Ocean<br />
(<strong>Santa</strong> <strong>Cruz</strong>)<br />
Downtown <strong>METRO</strong> Center<br />
(<strong>Santa</strong> <strong>Cruz</strong>)<br />
Bay & Mission<br />
(<strong>Santa</strong> <strong>Cruz</strong>)<br />
Downtown <strong>METRO</strong> Center<br />
(<strong>Santa</strong> <strong>Cruz</strong>)<br />
Felton Faire<br />
(Felton)<br />
Cavallaro <strong>Transit</strong> Center<br />
(Scotts Valley)<br />
Downtown <strong>METRO</strong> Center<br />
(<strong>Santa</strong> <strong>Cruz</strong>)<br />
The service improvement program focuses on implementing a strategy to phase in the trunk and feeder<br />
concept with minimal disruption on the existing routes. Very few changes to the existing local routes are<br />
suggested as part of this plan. However, the SRTP does outline a performance monitoring plan that can be<br />
used by <strong>METRO</strong> staff to assess how service is being delivered/consumed and allow modifications to be<br />
considered based on performance. While this process may not result in immediate service changes in the<br />
next fiscal year, future changes should result in improved efficiency and effectiveness.<br />
FARE RELATED ISSUES<br />
The trunk and feeder system service plan is designed to help improve the availability of transit and improve<br />
operational efficiencies for <strong>METRO</strong>, but the new system will also logically result in an increase in transfers<br />
for passengers. As a result there will be fare related implications that will logically be necessary to address,<br />
similar to the development of specific performance measurement techniques.<br />
As background, the current <strong>METRO</strong> fare structure requires passengers to pay ($1.50) every time they board.<br />
Thus an increase in transfers creates an increase in cost of transit. A day pass is also currently offered priced<br />
at the cost of three one-way trips ($4.50) which encourages passengers to purchase a pass if a roundtrip trip is<br />
needed and transfers are required. A five day pass ($22.00) and monthly passes ($50.00) are also available<br />
which allow unlimited rides during their respective time periods. Pre-purchased passes of any type not only<br />
reduce the cost of riding for transit passengers but also reduce dwell times for transit during<br />
boarding/alighting, thus reducing overall travel times.<br />
There are a number of possibilities <strong>METRO</strong> could pursue with the implementation of the new trunk and<br />
feeder concept. Since the concept would be implemented gradually, <strong>METRO</strong> could consider modifications<br />
to the day pass such as reducing the day pass slightly to encourage more riders to purchase this form of<br />
media.<br />
101015<br />
SANTA CRUZ <strong>METRO</strong> SHORT RANGE TRANSIT PLAN<br />
Page 5 - 17<br />
WILBUR SMITH ASSOCIATES
SERVICE IMPROVEMENT PROGRAM<br />
<strong>METRO</strong> may also need to revisit and possibly restructure its contract with Cabrillo College and UCSC that<br />
reimburses <strong>METRO</strong> on a per trip basis for riders completed by students and staff. Thus increasing the<br />
number of transfers would also increase the number of billable trips.<br />
PHASING<br />
The financial analysis presented in Chapter 6 details the amount of funding and estimates of future revenue<br />
sources for <strong>METRO</strong>. To fully implement the proposed trunk and feeder concept, additional financial and<br />
staffing resources will be needed. The proposed service hours column in Table 5-7 shows estimated hours<br />
that <strong>METRO</strong> can expect to add in each of the five fiscal years based on future revenue estimates compared to<br />
FY07-08.<br />
Table 5-7: Estimated Service Hours (FY09-FY12)<br />
Year<br />
Estimated New Revenue<br />
(from year previous)<br />
Estimated Change in Service Hours*<br />
(from year previous)<br />
Proposed<br />
Service Hour<br />
Allocation<br />
FY 08-09 $ 2,855,752 +14,279 ~ 12,000<br />
FY 09-10 $ 818,967 +4,095 0<br />
FY 10-11 $ (1,257,497) -6,287 0<br />
FY 11-12 $ 1,121,076 +5,605 ~5,000<br />
* Estimates for future service hours were determined using a future rate of $200 per service hour. Current rate are closer to $180 per<br />
service hours but projections for future expenses estimated by <strong>METRO</strong> show these costs rising in future years.<br />
Revenues shown in Table 5-7 are based on the <strong>METRO</strong>’s financial projections for FY 08-09 and FY 09-10<br />
and Option 2 of the consultant’s recommendations which are fully detailed in the Financial Analysis (Chapter<br />
6) chapter of this report. These trends show increasing revenue streams for FY 08-09, FY 09-10 and FY 11-<br />
12 and a decrease in FY 10-11 primarily due to the loss of operating reserves that are expected to be used in<br />
FY 08-09 and FY 09-10.<br />
The proposed service hour allocation identifies how much new service would be delivered based on the<br />
revenue projections through FY 11-12. Since resources will fluctuate over the next four years, service should<br />
be phased to assure future service cuts will not need to occur if resources are anticipated to be reduced. For<br />
example, since a reduction in revenues is programmed in FY 10-11, it would be illogical to add the maximum<br />
number of service hours available during FY 08-09 and FY 09-10 and then reduce those hours the next year.<br />
Figure 5-4 shows how the proposed hours compare to the available hours through FY 10-11 using the<br />
assumption that FY 07-08 hours will equal those reported in FY 06-07. This future analysis does not<br />
consider any carryover of unused revenues that may be transferred from one year to the next.<br />
101015<br />
SANTA CRUZ <strong>METRO</strong> SHORT RANGE TRANSIT PLAN<br />
Page 5 - 18<br />
WILBUR SMITH ASSOCIATES
SERVICE IMPROVEMENT PROGRAM<br />
Figure 5-4: Proposed Service Hours Allocation vs. Available Hours<br />
205,000<br />
200,000<br />
195,000<br />
Annual Service Hours<br />
190,000<br />
185,000<br />
180,000<br />
175,000<br />
170,000<br />
FY 07-08 FY 08-09 FY 09-10 FY 10-11 FY 11-12<br />
Available Hours<br />
Proposed Hours<br />
A number of the modifications suggested in the service improvement program can be completed through<br />
restructuring of service that do not require additional service hours while others are dependent upon new<br />
financial resources. Table 5-8 shows the various phases of implementation, their anticipated service hours,<br />
and suggested time of implementation. Based on input from <strong>METRO</strong> staff, the initial priority would be to<br />
restore a higher level of reliability to the existing service. An estimate of 1.5% of the total service hours from<br />
FY07-08, or nearly 2,750 service hours, would be allocated for these purposes in FY 08-09.<br />
Table 5-8: Proposed Phasing Timeline<br />
Service Improvement<br />
Hours Allocated<br />
Estimated New<br />
Hours Needed<br />
FY FY FY FY<br />
08-09 09-10 10-11 11-12<br />
Restore Reliability of Existing Service 2,750 2,768 0 0 0<br />
Highway 17 and Weekend Service 2,200 2,200 0 0 0<br />
<strong>Santa</strong> <strong>Cruz</strong>-Watsonville Trunk 7,000 7,000 0 0 0<br />
<strong>Santa</strong> <strong>Cruz</strong>-UCSC Trunk 5,000 0 0 0 5,000<br />
Total 16,100 11,968 0 0 5,000<br />
Once these current reliability issues are addressed, another relatively minor adjustment would be to allocate<br />
additional peak hour service on the Highway 17 Express service. Although this route includes multiple<br />
funding partners and, to some degree is almost a separate service, increasing demands on this regional service<br />
support consideration of improvements to this route. Resources available in FY 08-09 should be sufficient to<br />
make these improvements.<br />
101015<br />
SANTA CRUZ <strong>METRO</strong> SHORT RANGE TRANSIT PLAN<br />
Page 5 - 19<br />
WILBUR SMITH ASSOCIATES
SERVICE IMPROVEMENT PROGRAM<br />
The Watsonville to <strong>Santa</strong> <strong>Cruz</strong> conversion to a trunk service, which would be a major change to service<br />
delivery, can be completed if nearly all existing hours on the <strong>Santa</strong> <strong>Cruz</strong>-Watsonville intercity routes are<br />
allocated. The connection between this trunk service and Capitola Mall would need to be replaced by a new<br />
local service or upgrading the existing local services. In total, approximately 7,000 additional service hours<br />
would be needed to implement this trunk line service and supporting local service improvements. Based on<br />
the estimated operating revenues available to <strong>METRO</strong>, this implementation could occur in FY 08-09.<br />
The next priority would be strengthening the UCSC to Downtown <strong>Santa</strong> <strong>Cruz</strong> connection. An estimated<br />
25,000 hours would be needed to run 10 minute weekday and 15 minute weekend service. Consolidating the<br />
existing routes 13, 15 and 16 hours into this service, an additional 5,000 hours would be needed. These hours<br />
are anticipated to be available by FY 11-12.<br />
The final trunk line running from <strong>Santa</strong> <strong>Cruz</strong> to San Lorenzo would require the most hours of new service.<br />
It is estimated that these hours would not be available to implement this service over the duration of this<br />
service plan but should be considered for future planning efforts.<br />
CONCLUSION<br />
<strong>METRO</strong> is currently working to develop solutions to improve the existing system and alleviate issues with<br />
reliability and on-time performance. Once resources have been used to address these existing issues,<br />
<strong>METRO</strong> should look to build upon its regional and intercity connections. Table 5-9 shows how future<br />
resources could be allocated based on estimates for available service hours.<br />
Table 5-9: Allocation of Service Hours (FY08-FY13)<br />
Classifications<br />
Type<br />
FY<br />
07-08*<br />
FY<br />
08-09<br />
FY<br />
09-10<br />
FY<br />
10-11<br />
FY<br />
11-12<br />
Rural Existing 8,972 9,100 9,100 9,100 9,100<br />
Local/Feeder Existing 34,926 45,500 45,500 45,500 45,500<br />
Intercity Existing 85,617 23,900 23,900 23,900 23,900<br />
UCSC Existing 36,654 37,200 37,200 37,200 17,200<br />
Regional Existing 16,963 19,400 19,400 19,400 19,400<br />
<strong>Santa</strong> <strong>Cruz</strong>-Watsonville New Trunk 0 60,000 60,000 60,000 60,000<br />
<strong>Santa</strong> <strong>Cruz</strong>-UCSC New Trunk 0 0 0 0 25,000<br />
Total Allocated 183,132 195,100 195,100 195,100 200,100<br />
Total Available 183,132 197,411 201,506 195,219 200,824<br />
* Anticipated year end FY 07-08 data assumes the same service hour as that reported in FY 06-07.<br />
The trunk and feeder service plan concept would also allow <strong>METRO</strong> to formally identify and prioritize<br />
transit corridors within the County to help increase operational efficiencies and, for example, begin to identify<br />
locations for future transit-supportive development. This could include seeking local jurisdictions support in<br />
including these corridors in their planning processes and also potentially incorporating a land use policy to<br />
focus transit-supportive uses and densities along these corridors. As indicated previously, consideration of<br />
101015<br />
SANTA CRUZ <strong>METRO</strong> SHORT RANGE TRANSIT PLAN<br />
Page 5 - 20<br />
WILBUR SMITH ASSOCIATES
SERVICE IMPROVEMENT PROGRAM<br />
transit-preferential treatments along these corridors, including bus stop improvements, signal priority and<br />
rights of way, should be considered.<br />
ANCILLARY ISSUES<br />
Although not directly related to service improvement, there are several other issues and/or recommendations<br />
that are included in this chapter, including organizational structure recommendations and a discussion of the<br />
complementary paratransit service.<br />
Organizational Structure<br />
During the stakeholder meetings there was substantial input from other agency staff regarding the need for an<br />
additional staff person that could work with these agencies, especially regarding planning issues, that would<br />
provide additional policy level input similar to that received from the General Manager or Assistant General<br />
Manager.<br />
In addition, as part of the internal review of agency functions and responsibilities, it appeared that the ability<br />
to move forward with some planning, policy and process activities was also impacted by the availability of the<br />
GM or AGM to review and act on all issues and activities. Furthermore, there also appeared to be an<br />
opportunity for a senior level person to interact more directly with Operations personnel regarding<br />
scheduling, routing and issues related to interface with operators.<br />
Finally, if the service improvement program recommendations are implemented there will be an increased<br />
demand for internal coordination, external communication and interagency connectivity. Thus, it is<br />
recommended that a <strong>Plan</strong>ning Manager position be added to the Office of the General Manager, which<br />
would perform the functions discussed above and supervise the existing <strong>Transit</strong> <strong>Plan</strong>ner, <strong>Transit</strong> Surveyor,<br />
<strong>Plan</strong>ning Intern as well as the Grants/Legislative Analyst.<br />
In addition, this position would take the lead in the internal development of the SRTP process, including such<br />
activities as providing the updates regarding the performance measurement recommendations, the planning<br />
and process interaction of any new or modified technological programs and coordination with the paratransit<br />
program.<br />
Complementary Paratransit <strong>Plan</strong><br />
As discussed with senior management at the outset of the SRTP, the focus of this analysis was the fixed route<br />
service. As such, the current operations and activities of the Para<strong>Cruz</strong> service have not been analyzed. Those<br />
activities and operations could be affected, however, by the implementation of the service improvement<br />
program in several ways.<br />
First, since the requirement to provide ADA complementary paratransit for those persons with disabilities<br />
that cannot access the fixed route system is directly linked to the routing and span of service of the fixed<br />
route system, any increase or decrease in service as a result of the service improvement plan could also affect<br />
Para<strong>Cruz</strong> availability. Also, if some flexible destination services were implemented as part of the feeder<br />
service concept, then it could be possible to combine the ADA paratransit clientele and other passengers by<br />
offering curb to curb operation. Clearly, additional planning would be required in order to conceptualize any<br />
operational modifications. However, the cost for modifications to the fixed route service should also take into<br />
account a similar impact on the paratransit service and should be included in the overall service improvement<br />
plan.<br />
101015<br />
SANTA CRUZ <strong>METRO</strong> SHORT RANGE TRANSIT PLAN<br />
Page 5 - 21<br />
WILBUR SMITH ASSOCIATES
CHAPTER 6: FINANCIAL ANALYSIS AND CAPITAL NEEDS<br />
FINANCIAL ANALYSIS<br />
The purpose of this chapter is to develop an operating revenue forecast and identify capital needs for the<br />
<strong>Santa</strong> <strong>Cruz</strong> Metropolitan <strong>Transit</strong> District’s <strong>Short</strong> <strong>Range</strong> <strong>Transit</strong> <strong>Plan</strong>. The annual operating revenue forecasts<br />
described in detail below were used in the development of the service plan outlined in the previous chapter.<br />
As described below, the operating revenue forecasts were developed based on a review of: historic data, the<br />
region’s current economic conditions, and short range revenue forecasts developed by <strong>Santa</strong> <strong>Cruz</strong><br />
Metropolitan <strong>Transit</strong> District (<strong>METRO</strong>) staff. Based on this review, two alternative operating revenue<br />
forecast options were developed and compared to the two projections developed by <strong>METRO</strong> staff. From<br />
this comparison a recommended option was identified. Appendix E contains additional tables to supplement<br />
the information found in this chapter.<br />
SHORT RANGE PLAN OPERATING REVENUE PROJECTION PROCESS<br />
This following is an overview of the historic information used as the basis to develop revenue projections for<br />
the FY 2009 to 2012 period. The discussion includes a summary of the data sources researched and reviewed,<br />
identification of the agency’s key revenue sources, analysis of historic annual growth rates of each key source,<br />
and a review of recent trends in local and state sales tax collection.<br />
Data Sources<br />
The following documents, reports, and spreadsheets were reviewed and analyzed to develop the alternative<br />
FY 2009 to 2012 operating revenue forecasts.<br />
• <strong>Santa</strong> <strong>Cruz</strong> Metropolitan <strong>Transit</strong> District (<strong>METRO</strong>) Recommended Final Budgets: FY 1999 through<br />
FY 2007;<br />
• <strong>METRO</strong>’s global monthly ridership statistics spreadsheet for the period July 2002 through<br />
September 2006;<br />
• <strong>METRO</strong>’s service hours and miles, by route spreadsheet for the period FY 2004 through 2006;<br />
• <strong>METRO</strong>’s historic sales and use tax levels for the period 1995 to 2006;<br />
• <strong>METRO</strong>’s FY 2005-2006 Fact Sheet spreadsheet;<br />
• <strong>METRO</strong>’s Operating and Capital Budget Framework for the period FY 2007 through FY 2012;<br />
• <strong>METRO</strong>’s National <strong>Transit</strong> Database (NTD) submittals from the Federal <strong>Transit</strong> Administration’s<br />
website for the period 2001 through 2006;<br />
• <strong>METRO</strong>’s archived Board Agenda reports from the agency’s website to obtain year end receipt levels<br />
for the key revenue sources;<br />
• <strong>METRO</strong>’s March 2008 Draft FY 2009 and 2010 Operating and Capital Budget and the May Revised<br />
Draft FY 2009 and 2010 Operating and Capital Budget reports to the Board;<br />
• The City of <strong>Santa</strong> <strong>Cruz</strong> Sales Tax Update Report for the second and third quarter 2007.<br />
101015<br />
SANTA CRUZ <strong>METRO</strong> SHORT RANGE TRANSIT PLAN<br />
Page 6 - 1<br />
WILBUR SMITH ASSOCIATES
FINANCIAL ANALYSIS AND CAPITAL NEEDS<br />
Key Revenue Analysis<br />
<strong>METRO</strong> separates operating revenue into three general categories: operating revenue, non-operating revenue,<br />
and one time revenue.<br />
• Operating revenue includes passenger fares, special transit fares (contracts for University of<br />
California <strong>Santa</strong> <strong>Cruz</strong>, Cabrillo, and special shuttle services, and the employer pass program),<br />
paratransit fares, and fares and payments related to the Highway 17 service;<br />
• Non-operating revenue includes the half-cent local transit sales tax, State Transportation<br />
Development Act (TDA) funds, Federal <strong>Transit</strong> Administration (FTA) Section 5307 funds,<br />
advertising income, rent income, interest income, commissions, FTA Section 5311 rural operating<br />
assistance, and transfers from capital;<br />
• One time revenue includes a one time advance of FTA Section 5307 funds; carryover funds from<br />
the previous year, transfers from reserves, and transfers from the insurance reserve.<br />
Figure 6-1 provides an overview of the budgeted operating revenues over the FY 2003 to FY 2008 period.<br />
<strong>METRO</strong>’s budgeted operating revenues grew from $24.5 million in FY 2003 to $29.1 million in FY 2008,<br />
which reflects an average annual growth rate of 3.4 percent per year. As shown in Figure 6-1, non-operating<br />
revenue represents the primary operating revenue source for the agency, accounting for 76 percent of total<br />
revenues over this period.<br />
Figure 6-1: Operating Revenue Categories FY 2003 through 2008 (in millions)<br />
One Time Revenue<br />
$6.9<br />
3%<br />
Operating Revenue<br />
$44.4<br />
21%<br />
Non-Operating Revenue<br />
$160.0<br />
76%<br />
A review of historic budgets revealed that four key funding sources account for approximately 82 percent of<br />
<strong>METRO</strong>’s total operating revenue. As shown in Figure 6-2, over the last five years, the key revenue sources<br />
are the half-cent transit sales tax (46.6 percent), State Transportation Development Act (TDA) funds (16.5<br />
percent), passenger fares (10.4 percent) and FTA Section 5307 funds (8.7 percent).<br />
101015<br />
SANTA CRUZ <strong>METRO</strong> SHORT RANGE TRANSIT PLAN<br />
Page 6 - 2<br />
WILBUR SMITH ASSOCIATES
FINANCIAL ANALYSIS AND CAPITAL NEEDS<br />
Figure 6-2: Operating Revenue Sources FY 2003 through 2008 (in millions)<br />
All Other Sources<br />
11.1%<br />
Special <strong>Transit</strong> Fares<br />
6.7%<br />
FTA Section 5307<br />
8.7%<br />
Sales Tax<br />
46.6%<br />
Passenger Fares<br />
10.4%<br />
Transportation<br />
Development Act Funds<br />
16.5%<br />
Source: <strong>Santa</strong> <strong>Cruz</strong> Metropolitan <strong>Transit</strong> District Adopted Budgets FY 2003 through FY 2008.<br />
A trend analysis of historic data was the starting point for development of annual growth rate projections for<br />
the FY 2009 to 2012 period. The two data sets used for the key revenue source trend analysis were <strong>METRO</strong>’s<br />
FY 2003 to 2008 adopted budget estimates and the agency’s annual year end receipts for each source over<br />
this same period.<br />
<strong>METRO</strong>’s Adopted Budget Data<br />
Table 6-1 and Figure 6-3 summarize the budget estimates for the four key operating revenue sources over the<br />
FY 2003 to FY 2008 period. As shown in the table, the agency’s budgeted revenues for these four sources<br />
combined grew from $27.9 million to $30.7 million over the 2003 to 2008 period. Over the five-year period,<br />
these sources grew at a compound annual growth rate of 1.9 percent, with the growth rate for 2007 to 2008<br />
being slightly lower at 1 percent.<br />
The annual budgeted revenue levels for each of the four key sources between 2003 and 2008 reflect a similar<br />
reduction in the annual growth in revenue over 2007 to 2008:<br />
• Sales tax increased from $15.8 million to $17.6 million over the five year period which represents a<br />
2.3 percent compound annual growth rate with a 1.8 percent increase over the last year;<br />
• TDA funds increased from $5.4 million in 2003 to $6.4 million in 2008 with a five year compound<br />
annual growth rate of 3.4 percent and a 1.8 percent growth rate from 2007 to 2008;<br />
• Passenger fares decreased over the last five year from $3.9 million to $3.5 million which reflects a -<br />
2.2 percent compound annual rate with a -5.5 percent decrease budgeted between 2007 and 2008;<br />
and<br />
101015<br />
SANTA CRUZ <strong>METRO</strong> SHORT RANGE TRANSIT PLAN<br />
Page 6 - 3<br />
WILBUR SMITH ASSOCIATES
FINANCIAL ANALYSIS AND CAPITAL NEEDS<br />
• FTA Section 5307 funds increased from $2.8 million to $3.2 million with a compound annual growth<br />
rate of 3 percent over the period but a -1.2 percent decrease budgeted for FY 2008.<br />
Table 6-1: Key Revenue Sources Annual Adopted Budget Levels FY 2003-2008 (in millions)<br />
Annual Growth Rate<br />
2003 2004 2005 2006 2007 2008<br />
5 year 3 year 1 year<br />
Sales Tax $15.8 $15.4 $15.8 $16.6 $17.3 $17.6 2.3% 3.6% 1.8%<br />
TDA Funds $5.4 $5.4 $5.7 $5.9 $6.1 $6.4 3.4% 3.9% 1.8%<br />
Passenger Fares $3.9 $3.9 $3.6 $3.6 $3.7 $3.5 -2.2% -1.2% -5.5%<br />
FTA Section 5307 Funds $2.8 $3.0 $3.1 $3.1 $3.3 $3.2 3.0% 1.6% -1.2%<br />
Key Revenue Total $27.9 $27.7 $28.2 $29.2 $30.4 $30.7 1.9% 3.5% 1.0%<br />
Note: Although not shown in Table 6-1, historic budget data was provided from 1998 to 2008. The ten year average annual growth rates for the key revenue<br />
sources are as follows: sales tax: 3.3 percent; TDA funds: 3.3 percent; passenger revenue: 1.8 percent; and Section 5307 funds: 20.7 percent.<br />
Figure 6-3: <strong>METRO</strong>’s Key Revenue Sources FY 2003-2008 (in millions)<br />
$20.0<br />
$18.0<br />
$16.0<br />
$14.0<br />
$12.0<br />
$10.0<br />
$8.0<br />
$6.0<br />
$4.0<br />
$2.0<br />
$0.0<br />
2003 2004 2005 2006 2007 2008<br />
Sales Tax TDA Funds Passenger Fares Special <strong>Transit</strong> Fares FTA Section 5307 Funds<br />
101015<br />
SANTA CRUZ <strong>METRO</strong> SHORT RANGE TRANSIT PLAN<br />
Page 6 - 4<br />
WILBUR SMITH ASSOCIATES
FINANCIAL ANALYSIS AND CAPITAL NEEDS<br />
<strong>METRO</strong>’s Year End Actual Revenue<br />
Table 6-2 summarizes the actual level of revenue <strong>METRO</strong> received from the four key operating sources over<br />
the FY 2003 to FY 2007 period. Please note that the 2008 year end figure is an estimate provided in the draft<br />
FY 2009 and 2010 Capital Operating and Revenue budget presented to the <strong>METRO</strong> Board of Directors in<br />
May 2008.<br />
As shown in the table, total revenue received from the key funding sources grew from $24.6 million to $30.7<br />
million over the 2003 to 2008 period. The average annual growth rate over the five year period was 4.4<br />
percent. However, the projected growth rate for 2007 to 2008 is 1 percent. The annual revenue levels actually<br />
received from the four key revenue sources between 2003 and 2007 and projected for 2008 reflect a similar<br />
slower annual growth in 2007 to 2008:<br />
• Sales tax increased from $15.2 million to $17.6 million with a 3.0 percent compound annual growth<br />
rate over the five year period but a -0.2 percent decrease projected between 2007 and 2008;<br />
• TDA funds increased from $5.1 million to $6.4 million with a five year compound annual growth<br />
rate of 4.4 percent and a 3.2 percent increase over the last year;<br />
• Passenger fares increased from $3.1 million to $3.5 million which represents a 2.5 percent compound<br />
annual increase over the five year period and a 1.3 percent increase for the last year; and<br />
• FTA Section 5307 funds increased from $1.2 million to $3.2 million which represents a 20.7 percent<br />
compound annual growth rate over the last five years, mainly attributable to the 2004 initial year of<br />
SAFETEA-LU. Over the most recent three years the rate was 2.2 percent and over the last year it<br />
decreased to 0.7 percent.<br />
Table 6-2: Key Revenue Sources Year End Actuals FY 2003-2008 (in millions)<br />
Annual Growth Rate<br />
2003 2004 2005 2006 2007 2008<br />
5 year 3 year 1 year<br />
Sales Tax $15.2 $15.2 $15.7 $16.7 $17.7 $17.6 3.0% 4.0% -0.2%<br />
TDA Funds $5.1 $5.3 $5.4 $5.7 $6.2 $6.4 4.4% 5.5% 3.2%<br />
Passenger Fares $3.1 $3.8 $3.5 $3.0 $3.4 $3.5 2.5% -0.8% 1.3%<br />
FTA Section 5307 Funds $1.2 $2.8 $3.0 $3.0 $3.1 $3.2 20.7% 2.2% 0.7%<br />
Key Revenue Total $24.6 $27.1 $27.6 $28.4 $30.4 $30.7 4.4% 4.1% 1.0%<br />
Recent Regional and Statewide Sales Tax Trends<br />
The City of <strong>Santa</strong> <strong>Cruz</strong> produces a quarterly Sales Tax Report that summarizes city, county and state sales tax<br />
revenue trends compared to the prior year. At the time of this analysis, reports for the second and third<br />
quarters of 2007 were available for review. According to the City’s reports, over this time period sales tax<br />
revenue for the county was relatively flat compared to the same period in 2006. While fourth quarter 2007<br />
and initial projections for 2008 were not available, the third quarter report indicated that statewide, sales tax<br />
revenue is projected to decrease through early 2008 and there is uncertainty as to when sales tax revenue on<br />
the state level will increase.<br />
The reduction in sales tax revenue at the state level is expected to impact on the level of TDA funds that<br />
<strong>METRO</strong> and other transit agencies are projected to receive. As documented in the Draft FY 2009 and 2010<br />
Operating and Capital Budget, the <strong>Santa</strong> <strong>Cruz</strong> County Regional Transportation Commission has informed<br />
<strong>METRO</strong> that its TDA funding is projected to decrease 5.8 percent compared to last year.<br />
101015<br />
SANTA CRUZ <strong>METRO</strong> SHORT RANGE TRANSIT PLAN<br />
Page 6 - 5<br />
WILBUR SMITH ASSOCIATES
FINANCIAL ANALYSIS AND CAPITAL NEEDS<br />
<strong>METRO</strong> STAFF BASELINE BUDGET PROJECTIONS<br />
Over the course of developing the <strong>Short</strong> <strong>Range</strong> <strong>Transit</strong> <strong>Plan</strong>, <strong>METRO</strong> staff prepared two budget projection<br />
reports. The results from these reports provided baseline revenue levels to compare to the <strong>Short</strong> <strong>Range</strong> <strong>Plan</strong><br />
projections.<br />
• Baseline 1: November 2007 Framework <strong>Plan</strong> for <strong>METRO</strong>’s Capital and Operating Budgets for the<br />
FY 2007 to 2012 period: This document, developed annually, provides the Board an overview of key<br />
short term projects, operating conditions and cost and revenue projections. For the purposes of<br />
providing a basis to compare annual revenue to SRTP forecasts, the FY 2009 to 2012 revenue<br />
estimates for Baseline 1 were forecasted using the growth rates developed for the Framework <strong>Plan</strong><br />
and projected from the estimated FY 08 year totals from the May 9, 2008 Board Packet.<br />
• Baseline 2: May 2008 Draft FY 2009 and 2010 Operating and Capital Budget: The draft budget<br />
document (as revised) provides revenue estimates for 2009 and 2010 only. For the purposes of this<br />
analysis, Baseline 2 assumed the Draft Budget’s 2009 and 2010 estimates and used the annual growth<br />
rates from the Framework <strong>Plan</strong> for 2011 and 2012.<br />
As shown in Table 6-3, between the November 2007 Framework <strong>Plan</strong> Report to the Board and the May 2008<br />
Draft 2009 and 2010 Budget, the agency’s forecasts for FY 2009 and 2010 sales tax and State Transportation<br />
Development Account (TDA) funds have decreased significantly due to the current economic conditions.<br />
• Local sales tax revenues for FY 2009 are projected to be only 0.3 percent higher than in FY 08,<br />
compared to a 3.0 percent increase reported last November.<br />
• As stated earlier, TDA funds for FY 2009 are projected to decrease 5.8 percent based on information<br />
from the <strong>Santa</strong> <strong>Cruz</strong> County Regional Transportation Commission, compared to a projected 4<br />
percent increase reported last November.<br />
Both sources are projected to return to growth rates similar to historic levels in FY 2010.<br />
Table 6-3: Comparison of Baseline Projections<br />
2008 2009 2010 2011 2012<br />
Sales Tax<br />
Baseline 1 $17.21 $17.64 $18.08 $18.53 $18.99<br />
Baseline 2 $17.21 $17.26 $17.78 $18.32 $18.87<br />
TDA Funds<br />
Baseline 1 $6.31 $6.50 $6.70 $6.90 $7.11<br />
Baseline 2 $6.31 $5.98 $6.16 $6.34 $6.53<br />
Passenger Fares<br />
Baseline 1 $3.45 $3.52 $3.59 $3.66 $3.73<br />
Baseline 2 $3.45 $3.52 $3.59 $3.66 $3.73<br />
FTA Section 5307 Funds<br />
Baseline 1 $3.22 $3.29 $3.35 $3.42 $3.49<br />
Baseline 2 $3.22 $3.50 $3.64 $3.72 $3.79<br />
Key Revenue Sources Total<br />
Baseline 1 $30.19 $30.95 $31.72 $32.51 $33.32<br />
Baseline 2 $30.19 $30.26 $31.17 $32.04 $32.92<br />
101015<br />
SANTA CRUZ <strong>METRO</strong> SHORT RANGE TRANSIT PLAN<br />
Page 6 - 6<br />
WILBUR SMITH ASSOCIATES
FINANCIAL ANALYSIS AND CAPITAL NEEDS<br />
RECOMMENDED SRTP BUDGET PROJECTION<br />
Based on the above analyses a recommended budget projection was developed and shown in Table 6-4. This<br />
projection assumes the following:.<br />
o The updated FY 2008 Final Budget (as of May 9, 2008) as the base year.<br />
o Annual operating revenues will experience no and/or low rates of growth over FY 2009 and<br />
FY 2010, and will return to rates closer to their pre-2008 actual growth levels in FY 2011 and<br />
2012.<br />
Table 6-4: Recommended SRTP Annual Projection Growth Rate Assumptions<br />
2009 2010 2011 2012<br />
Sales Tax 0.5% 1.0% 3.0% 3.0%<br />
TDA Funds -5.3% 1.0% 3.0% 3.0%<br />
Passenger Fares 2.0% 2.0% 2.0% 2.0%<br />
Section 5307 Funds 1.0% 2.0% 2.0% 2.0%<br />
Based on the review of historic data and the current economic conditions, a more conservative approach to<br />
growth rates for the sales tax, TDA, and Section 5307 funds was considered to be appropriate for FY 2009<br />
and FY 2010 with a return to SCMTD’s more traditional growth rates in FY 2011 and FY 2012. With regard<br />
to passenger revenues, a higher projected growth rate, 2 percent, than recent actual trends is supportable<br />
given the increased costs for gas combined with potential ridership growth resulting from anticipated service<br />
improvements associated with the <strong>Plan</strong>.<br />
Table 6-5 provides a comparison of the annual growth rate projections assumed in the alternative forecasts,<br />
while Table 6-6 summarizes the annual revenue levels under each alternative. Of key importance is the<br />
comparison between the recommended growth rates and Baseline 2 (May 2008 Draft FY 2009 and FY 2010<br />
Budget).<br />
Table 6-5: Comparison of Baseline and Alternative Options Growth Rate Assumptions<br />
2009 2010 2011 2012<br />
Sales Tax<br />
Baseline: MTD 5 Year Framework 3.0% 3.0% 3.0% 3.0%<br />
Recommended Annual Projection 0.5% 1.0% 3.0% 3.0%<br />
Baseline 2: FY 09 MTD Budget Projection (05/09/08) 0.3% 3.0% 3.0% 3.0%<br />
TDA Funds<br />
Baseline: MTD 5 Year Framework 3.0% 3.0% 3.0% 3.0%<br />
Recommended Annual Projection -5.3% 1.0% 3.0% 3.0%<br />
Baseline 2: FY 09 MTD Budget Projection (05/09/08) -5.3% 3.0% 3.0% 3.0%<br />
Passenger Fares<br />
Baseline: MTD 5 Year Framework 2.0% 2.0% 2.0% 2.0%<br />
Recommended Annual Projection 2.0% 2.0% 2.0% 2.0%<br />
Baseline 2: FY 09 MTD Budget Projection (05/09/08) 2.0% 2.0% 2.0% 2.0%<br />
Section 5307 Funds<br />
Baseline: MTD 5 Year Framework 4.0% 4.0% 4.0% 4.0%<br />
Recommended Annual Projection 1.0% 2.0% 2.0% 2.0%<br />
Baseline 2: FY 09 MTD Budget Projection (05/09/08) 8.5% 4.2% 4.0% 4.0%<br />
101015<br />
SANTA CRUZ <strong>METRO</strong> SHORT RANGE TRANSIT PLAN<br />
Page 6 - 7<br />
WILBUR SMITH ASSOCIATES
FINANCIAL ANALYSIS AND CAPITAL NEEDS<br />
Table 6-6: Comparison of the Projected Total Revenue from <strong>METRO</strong>’s Key Sources<br />
2009 2010 2011 2012 Total<br />
Sales Tax<br />
Baseline: MTD 5 Year Framework $17.64 $18.08 $18.53 $18.99 $73.24<br />
Recommended Annual Projection $17.29 $17.47 $17.99 $18.53 $71.28<br />
Baseline 2: FY 09 MTD Budget Projection (5/09/08) $17.26 $17.78 $18.32 $18.87 $72.23<br />
TDA Funds<br />
Baseline: MTD 5 Year Framework $6.50 $6.70 $6.90 $7.11 $27.21<br />
Recommended Annual Projection $5.98 $6.04 $6.22 $6.41 $24.64<br />
Baseline 2: FY 09 MTD Budget Projection (5/09/08) $5.98 $6.16 $6.34 $6.53 $25.01<br />
Passenger Fares<br />
Baseline: MTD 5 Year Framework $3.52 $3.59 $3.66 $3.73 $14.50<br />
Recommended Annual Projection $3.52 $3.59 $3.66 $3.73 $14.50<br />
Baseline 2: FY 09 MTD Budget Projection (5/09/08) $3.52 $3.59 $3.66 $3.73 $14.50<br />
Section 5307 Funds<br />
Baseline: MTD 5 Year Framework $3.29 $3.35 $3.42 $3.49 $13.55<br />
Recommended Annual Projection $3.26 $3.32 $3.39 $3.46 $13.42<br />
Baseline 2: FY 09 MTD Budget Projection (5/09/08) $3.50 $3.64 $3.72 $3.79 $14.65<br />
Key Revenue Source Total<br />
Baseline: MTD 5 Year Framework $30.95 $31.72 $32.51 $33.32 $128.50<br />
Recommended Annual Projection $30.05 $30.42 $31.26 $32.13 $123.85<br />
Baseline 2: FY 09 MTD Budget Projection (5/09/08) $30.26 $31.17 $32.04 $32.92 $126.39<br />
Figure 6-4 and Table 6-7 provide a comparison of the total annual operating revenues projected based on the<br />
growth rates assumed in the alternative scenarios. As shown in the figure and table, the Recommended<br />
Annual Projection Option results in lower levels of total revenue over the FY 2009 to FY 2012 compared to<br />
<strong>METRO</strong>’s FY 2009 and 2010 Budget report. This is due to a lower growth rate for FTA Section 5307 funds<br />
in 2009 and more conservative assumptions for sales and TDA funds to rebound in FY 2010. It should be<br />
noted that all scenarios assume a carryover of operating revenues in 2009 and 2010, as reflected in <strong>METRO</strong>’s<br />
FY 2009 and 2010 Budget report, with no carryover reflected in 2011 and 2012.<br />
101015<br />
SANTA CRUZ <strong>METRO</strong> SHORT RANGE TRANSIT PLAN<br />
Page 6 - 8<br />
WILBUR SMITH ASSOCIATES
FINANCIAL ANALYSIS AND CAPITAL NEEDS<br />
Figure 6-4: Comparison of Projected Total Annual Operating Revenues (in Millions) FY's 2009 - 2012<br />
$41.00<br />
$40.50<br />
$40.00<br />
$39.50<br />
$39.00<br />
$38.50<br />
$38.00<br />
$37.50<br />
$37.00<br />
$36.50<br />
$36.00<br />
$35.50<br />
$35.00<br />
2007 2008 2009 2010 2011 2012<br />
Baseline: MTD 5 Year Framework<br />
Baseline 2: FY 09 MTD Budget Projection (5/09/08)<br />
Recommended Annual Projection<br />
Note: FY 2008 reflects a carryover of $2.06 million to FY 2009. <strong>METRO</strong> considers the carryover from FY 2008 as a negative. FY 2010 includes approximately<br />
$1.9 million in transfers to the operating budget based on expense projections in the Draft 2009 and 2010 budget. At this time costs have not been developed for<br />
2011 and 2012. As a result no carryover or transfer funds are included in 2011 and 2012 projections.<br />
Table 6-7: Comparison of Projected Total Annual Operating Revenues (in Millions)<br />
2007 2008 2009 2010 2011 2012<br />
Baseline: MTD 5 Year Framework $36.84 $35.55 $39.10 $39.77 $39.22 $40.29<br />
Recommended Annual Projection $36.84 $35.55 $38.20 $38.47 $37.97 $39.09<br />
Baseline 2: FY 09 MTD Budget Projection<br />
(5/09/08)<br />
$36.84 $35.55 $38.41 $39.23 $38.75 $39.89<br />
Note: FY 2008 reflects a carryover of $2.06 million to FY 2009. <strong>METRO</strong> considers the carryover from FY 2008 as a negative. FY 2010 includes approximately<br />
$1.9 million in transfers to the operating budget based on expense projections in the Draft 2009 and 2010 budget. At this time costs have not been developed for<br />
2011 and 2012. As a result no carryover or transfer funds are included in 2011 and 2012 projections.<br />
101015<br />
SANTA CRUZ <strong>METRO</strong> SHORT RANGE TRANSIT PLAN<br />
Page 6 - 9<br />
WILBUR SMITH ASSOCIATES
FINANCIAL ANALYSIS AND CAPITAL NEEDS<br />
CAPITAL NEEDS<br />
The primary components of a capital needs are vehicles, facilities, and transit amenities/technology.<br />
VEHICLES<br />
<strong>METRO</strong> has a complex fleet of fixed-route vehicles that includes 40 and 35 foot vehicles, diesel and CNG<br />
engines, high and low floor entry as well as the 41 foot suburban vehicles for longer distance travel. The<br />
average age of the fixed route vehicles is approximately 10 years, which includes 22 of the 113 vehicles that<br />
are 19 or 20 years old. Newer low floor CNG models have been added beginning in 2002. From a paratransit<br />
vehicle perspective, 24 of those 34 vehicles have been acquired since 2003.<br />
The service plan recommendation for trunk and feeder service could potentially impact vehicle acquisition<br />
strategies in the future. Although <strong>METRO</strong> does not plan to operate longer vehicles, such as articulated buses,<br />
within the planning horizon of this plan, reallocation and purchase of smaller vehicles to more accurately<br />
match demand should be considered. This would include allocating 40 foot vehicles to any trunk line or<br />
regional service and reserving existing 35 foot or future smaller vehicles that may be acquired for local<br />
services.<br />
Vehicle needs arise from the replacement of existing vehicles and the demand for vehicles based on added<br />
service. The replacement schedule is based on vehicles that exceed the FTA 12 year useful life span guideline<br />
or those diesel vehicles that will need to be replaced by 2012 to meet state law. Including a recent<br />
procurement of 13 CNG vehicles, <strong>METRO</strong> currently has 63 non-diesel vehicles or a peak hour roll out of 55<br />
vehicles for fixed route service. In order to meet the current peak hour pull out of 83 buses, <strong>METRO</strong> would<br />
need to acquire an additional 28 non-diesel vehicles over the next four years.<br />
In addition, the proposed service plan includes recommendations that would likely require <strong>METRO</strong> to<br />
purchase new vehicles. The vehicle requirements needed to decouple the existing interlined service and<br />
improve reliability, as noted in the prior chapter, (by universally adding hours) is difficult to estimate. Since<br />
the existing interlining scheduling is designed to maximize resources, it is estimated that at least two<br />
additional vehicles will be needed.<br />
The additional peak hour trip on the Highway 17 service recommended in the service plan would require one<br />
vehicle to operate. The Watsonville to <strong>Santa</strong> <strong>Cruz</strong> trunk line service will utilize the existing 40 foot buses<br />
used on the existing intercity routes but will require an additional two vehicles to meet the peak hour<br />
demands. In addition, two smaller vehicles will be needed to serve the new Capitola local routes connecting<br />
the trunk line service to the Capitola Mall. The <strong>Santa</strong> <strong>Cruz</strong> trunk line service could operate with the existing<br />
fleet and would not require any new vehicles to be purchased. In fact, the consolidation of routes would free<br />
up one vehicle for use elsewhere in the network. Table 6-8 below shows the schedule of new bus purchases<br />
and their estimated costs.<br />
101015<br />
SANTA CRUZ <strong>METRO</strong> SHORT RANGE TRANSIT PLAN<br />
Page 6 - 10<br />
WILBUR SMITH ASSOCIATES
FINANCIAL ANALYSIS AND CAPITAL NEEDS<br />
Table 6-8: Estimated Vehicle Needs<br />
Vehicle Needs<br />
FY 08-09 FY 09-10 FY 10-11 FY 11-12<br />
Vehicle Size: 40’ 35’/30’ 40’ 35’/30’ 40’ 35’/30’ 40’ 35’/30’<br />
Vehicle Replacement 3 - 8 - 8 - 8 -<br />
Restore Reliability of<br />
Existing Service<br />
2 - - - - - - -<br />
Highway 17 and<br />
Weekend Service<br />
1 - - - - - - -<br />
<strong>Santa</strong> <strong>Cruz</strong>-Watsonville<br />
Trunk<br />
2 2 - - - - - -<br />
<strong>Santa</strong> <strong>Cruz</strong>-UCSC<br />
Trunk<br />
- - - - - - (-1) -<br />
Total 8 2 8 - 8 - 7 -<br />
Cost Per CNG Vehicle $380,000 $370,000 $393,300 $382,950 $407,066 396,353 $421,313 $410,226<br />
$3,040,000 $740,000 $3,146,400 $0 $3,256,528 $0 $2,949,191 $0<br />
Total Cost $3,780,000 $3,146,400 $3,256,528 $2,949,191<br />
Paracruz will also need replacement vehicles through FY 11-12. Table 6-9 shows these anticipated<br />
replacements. In addition to Paracruz and those vehicles listed in Table 6-8, three Goshen local<br />
buses will need to be purchased in 2010 at a total cost of $700,000.<br />
Table 6-9: Paracruz Vehicle Replacement Schedule<br />
Paracruz Van<br />
Replacements<br />
Vehicle Needs<br />
FY 08-09 FY 09-10 FY 10-11 FY 11-12<br />
7 3 5 3<br />
Cost Per Paracruz Van $80,000 $80,000 $80,000 $80,000<br />
Total Cost $560,000 $240,000 $400,000 $240,000<br />
FACILITIES<br />
Four transit centers are currently used by <strong>METRO</strong> as hub or transfer locations for their fixed routes services.<br />
The two primary centers where nearly all routes converge are the <strong>Santa</strong> <strong>Cruz</strong> <strong>Transit</strong> Center or <strong>METRO</strong><br />
Center located in Downtown <strong>Santa</strong> <strong>Cruz</strong> and the Watsonville <strong>Transit</strong> Center located in Downtown<br />
Watsonville. Both of these facilities contain a large number of bus bays to allow layover and transferring<br />
activities to occur. They also include a high level of customer amenities including food vendors, customer<br />
service agents and seating.<br />
The secondary transit centers are located in Scotts Valley and Capitola. The Cavallaro <strong>Transit</strong> Center is<br />
located on Kings Village Road, just north of Mt. Hermon Road in Scotts Valley. The Capitola <strong>Transit</strong> Center<br />
is located at the Capitola Mall on 41st Street. Both of these facilities have fewer customer amenities but<br />
101015<br />
SANTA CRUZ <strong>METRO</strong> SHORT RANGE TRANSIT PLAN<br />
Page 6 - 11<br />
WILBUR SMITH ASSOCIATES
FINANCIAL ANALYSIS AND CAPITAL NEEDS<br />
provide key transfer points for <strong>METRO</strong>’s fixed routes services. The implementation of the trunk and feeder<br />
service may result in other connection points that could benefit from additional facility improvements, such<br />
as:<br />
• Green Valley Road and Main Street (Watsonville)<br />
• Cabrillo College (Aptos)<br />
• Soquel and 41 st (<strong>Santa</strong> <strong>Cruz</strong>)<br />
• Water and Ocean Street (<strong>Santa</strong> <strong>Cruz</strong>)<br />
• Felton Faire (Felton)<br />
The District is also in the process of constructing the new MetroBase <strong>Transit</strong> facility on River Street and Golf<br />
Course Drive. The new facility will be the central location for operations and maintenance of <strong>METRO</strong>’s bus<br />
fleet. The facility will contain the following components:<br />
• Liquified Compression Natural Gas (LCNG) fueling station<br />
• Bus washing structure<br />
• A second story addition to the current building<br />
• Reconfigured parking and circulation<br />
From an operational perspective the MetroBase plan would require modifications if larger capacity vehicles<br />
were added to the fleet.<br />
Two significant capital expenditures are scheduled for FY 2008-09 and FY 2011-12 which include<br />
27 million for the new Operations Building and Parking and 10 million for the Paracruz Operations<br />
Building, respectively. Bus stop improvements are allocated $400,000 in FY 2008-09 and $500,000<br />
in FY 2010-11.<br />
TRANSIT AMENITIES AND TECHNOLOGY<br />
Improved passenger amenities, including widely distributed bus shelters and improved route signage, a system<br />
map, improved web site and improved timetables are an important component of the marketing and attention<br />
to customers that are important tools in the efforts to provide viable mobility options which are easy to use<br />
and understand by existing and potential new transit riders. . These transit amenities improve the experience<br />
of using transit for patrons and have proven to be valuable throughout the industry as components of<br />
enhancing communication, information and comfort for passengers. At this time, however, given the current<br />
financial uncertainties and the forecast for potentially reduced resources, it would appear that many of the<br />
amenities may be deferred. We believe, however, that investing in enhanced communication and technology<br />
would be a positive benefit for <strong>METRO</strong>, its customers and the communities it serves.<br />
As part of the monitoring and evaluation process, there have been recommendations to expand technology to<br />
include more use of automatic passenger counters and automatic vehicle locators. These systems would<br />
enable the ability to quickly and accurately collect data that would be used in the performance monitoring<br />
process and reduce data collection resources. This is also an important investment in the future of <strong>METRO</strong>.<br />
As previously discussed the potential for higher demand on the trunk corridors could then lead to the use of<br />
higher capacity vehicles that could operate in a Bus Rapid <strong>Transit</strong> mode. BRT applications typically have<br />
included a number of technology improvements such as:<br />
101015<br />
SANTA CRUZ <strong>METRO</strong> SHORT RANGE TRANSIT PLAN<br />
Page 6 - 12<br />
WILBUR SMITH ASSOCIATES
FINANCIAL ANALYSIS AND CAPITAL NEEDS<br />
• Traffic signal preference or priority<br />
• Real time bus arrival information<br />
• Off board automated fare media<br />
• Docking and maneuvering software<br />
• Etc.<br />
If <strong>METRO</strong> decides to pursue the BRT feasibility, sufficient technology infrastructure should be examined as<br />
part of the capital cost estimation. FY 2007-08 allocates $5 million for an AVL system and another $500,000<br />
for a telecommunications system. Improvements to the farebox in FY 2008-09 are allocated $1 million<br />
dollars.<br />
101015<br />
SANTA CRUZ <strong>METRO</strong> SHORT RANGE TRANSIT PLAN<br />
Page 6 - 13<br />
WILBUR SMITH ASSOCIATES
CHAPTER 7: ADDENDUM<br />
In July of this year the Board was presented with a draft of the service portion of the <strong>Short</strong> <strong>Range</strong> <strong>Transit</strong> <strong>Plan</strong><br />
(SRTP). At that meeting concern was raised by members of the Board regarding the proposal to move towards a<br />
“trunk and feeder” concept within the five-year planning horizon of the <strong>Short</strong> <strong>Range</strong> <strong>Transit</strong> Program. At that<br />
meeting, the concept was presented for discussion.<br />
The staff the looked at specific ways that the concept could be implemented, laying out a revised routing structure in<br />
the corridor from <strong>Santa</strong> <strong>Cruz</strong> to Watsonville. Staff developed a routing scenario that would restructure the service to<br />
a trunk and feeder concept and then compared this service levels and coverage that exists today.<br />
In the scenario developed by the staff, the service would require 89,475 hours of service, to replace the existing<br />
76,408 hours now being provided. This is an increase of 17%, which in 2008 dollars is approximately $850,000.<br />
Implementation of the trunk and feeder service would also require a review of the current <strong>METRO</strong> fare structure to<br />
understand the impact of potentially increasing the number of transfers in the system. One potential recommendation<br />
for the fare structure would be the implementation of a day pass on the system.<br />
In addition to the increased operating costs, there are a range of capital items which <strong>METRO</strong> staff recognizes would<br />
be necessary for the successful implementation of the trunk and feeder service. These capital investments would be<br />
in the area of customer information and technology, and in vehicle and station infrastructure. Each of these items are<br />
discussed below.<br />
FARE STRUCTURE AND FAREBOX INFRASTRUCTURE<br />
One of the impacts of moving to a trunk and feeder concept is that the number of transfers may increase as people<br />
may be required to transfer to complete a trip. Today, <strong>METRO</strong> charges a fare each time a passenger boards a bus,<br />
unless a Day Pass is purchased, or the rider has a Monthly Pass. Currently the Day Pass is priced at 3 times the base<br />
fare. In this instance if your trip is served by 1 bus in each direction, it is cheaper for a person to simply pay for<br />
individual rides. In the case of a trunk and feeder system, with more potential transfers, it is recommended that<br />
<strong>METRO</strong> consider reviewing the revenue impact of pricing the day pass at 2 times the base fare to avoid an indirect<br />
fare increase to the public. While moving to a trunk and feeder concept would probably increase ridership, <strong>METRO</strong><br />
should quantify the lost revenue from moving to a revised fare structure. Another technique related to fares and<br />
enhanced boarding at stops. <strong>METRO</strong> should consider the use of SMART CARD technology to allow fast and easy<br />
boarding on the vehicles. <strong>METRO</strong> staff has requested capital funding for this system with FTA.<br />
101015<br />
SANTA CRUZ <strong>METRO</strong> SHORT RANGE TRANSIT PLAN<br />
Page 7 - 1<br />
WILBUR SMITH ASSOCIATES
ADDENDUM<br />
AVL AND PASSENGER INFORMATION SYSTEM<br />
Another important component to making a trunk and feeder operate efficiently from a passenger perspective is to<br />
ensure that all connections with the trunk are as seamless as can be. For this to occur, schedule coordination<br />
becomes critical. With existing traffic conditions in the <strong>Santa</strong> <strong>Cruz</strong> to Watsonville corridor, <strong>METRO</strong> is aware that<br />
there are already delays to the service, which was one factor which lead to the discussion of a trunk and feeder<br />
system to allow for services in the communities to be less impacted by congestion and delay on the highway 1<br />
service. The implementation of an Automated Vehicle Location (AVL) system is necessary to put the dispatcher in<br />
the role of an air traffic controller to hold various buses to make these connections. Such a system is recommended<br />
even without a move to the trunk and feeder service, as current on time performance is one of the critical areas of<br />
customer concern which needs improvement in the <strong>METRO</strong> service. Without real time information available<br />
<strong>METRO</strong> dispatch and management are at a disadvantage in providing information to customers. With the<br />
implementation of a trunk and feeder service, real time information becomes even more critical to passenger<br />
convenience, as they wait to make service connections. An AVL system for <strong>METRO</strong> would cost approximately $5.0<br />
million and would provide <strong>METRO</strong> would many benefits, well beyond what is discussed above. In addition, it is<br />
recommended that real time information signposts be installed at each of the feeder connections to the trunk route so<br />
that passengers would know when the next bus was going to arrive. Knowing that a bus is arriving in 3 minutes<br />
when you can’t see it is very comforting and it takes away from rider concerns. A minimalist system to accomplish<br />
just the signage without a full AVL system might be purchased for approximately $200,000, based upon<br />
conversations with a vendor at the recent APTA Expo in San Diego.<br />
CONTINGENCY FUNDS FOR OPERATIONS<br />
In order for such a major change to occur, <strong>METRO</strong> should have an amount of contingency funds available to be able<br />
to deal with any problems that would arise after implementation. Should this concept prove to be successful, and<br />
ridership grows, causing various routes to be overcrowded, <strong>METRO</strong> would have to have reserve capacity available<br />
to supplement service. A fund of 5% is recommended for consideration.<br />
VEHICLES AND STATION INFRASTRUCTURE<br />
In some areas where transit agencies have moved to this concept, transit agencies have “branded” the buses with a<br />
different paint scheme to create attention for the new service. This was done for example in San Jose for the Rapid<br />
bus line along El Camino. In many cases, separate fleets of buses were ordered with amenities that are markedly<br />
different that the regular fleet to clearly differentiate that this is a different experience. In these instances the<br />
services provided have been very successful and have exceeded initial projections. Additionally, the major transfer<br />
points along the routes should be considered for capital investments and upgrades to allow for enhanced customer<br />
amenities in place of the typical <strong>METRO</strong> bench or shelter, as these would be heavily used bus stops and would need<br />
to accommodate at least 2 buses at a time to allow for easy transfers.<br />
101015<br />
SANTA CRUZ <strong>METRO</strong> SHORT RANGE TRANSIT PLAN<br />
Page 7 - 2<br />
WILBUR SMITH ASSOCIATES
ADDENDUM<br />
TRAFFIC CONGESTION/HOV LANE<br />
<strong>METRO</strong> buses operate on the local streets and highways. As traffic congestion has continued to increase in the<br />
county, it takes <strong>METRO</strong> vehicles longer to complete their routes. This “delay factor” presents <strong>METRO</strong> with only<br />
two options. First we can add additional buses to make up for the delays. This would be an additional cost to<br />
<strong>METRO</strong> for which there is currently no funding. The reality is that these traffic congestion costs result in service<br />
cuts, since it take the same bus longer to navigate its route, resulting in less trips. For the trunk and feeder concept<br />
to operate at a higher level of service, and not be slowed down by traffic, it is necessary that the High Occupancy<br />
Lane Project for Highway 1 be implemented. The impact of this improvement is that traffic on local streets would<br />
also flow better with the added capacity on the highway.<br />
ECONOMY<br />
At the time that the initial study was being performed, economic conditions were very different. <strong>METRO</strong> staff was<br />
projecting that there would be an additional amount of $1 million of new service that could be added to the system<br />
in each of the next three years. These increased revenues would have provided a needed cushion that would have<br />
potentially supported a revised system of service delivery. When changing to a different form of service delivery,<br />
the system has to have a financial reserve to be able to deal with any service issues that might arise – both successes<br />
and failures. Quick response can mean the difference between success and failure of a change. Unfortunately, the<br />
economy in the nation has taken a severe turn and as a result, sales tax projections are actually below what was<br />
collected in the prior year. The likelihood of a quick recovery does not appear to be good at this time, and most<br />
economists are predicting a slow recovery. As a result of this, it is not anticipated <strong>METRO</strong> will be in a financial<br />
position to move to a trunk and feeder concept with the five year horizon of a <strong>Short</strong> <strong>Range</strong> <strong>Transit</strong> <strong>Plan</strong>.<br />
It is the recommendation of staff that following actions be taken:<br />
• Add to the SRTP this discussion and revise the discussion on the trunk and feeder concept to reflect that it<br />
will not be pursued in the planning horizon of this plan.<br />
• Adopt the revised SRTP with no revision being made to the service delivery model in use by <strong>METRO</strong><br />
• Revisit the service delivery issue in future updates to the SRTP<br />
101015<br />
SANTA CRUZ <strong>METRO</strong> SHORT RANGE TRANSIT PLAN<br />
Page 7 - 3<br />
WILBUR SMITH ASSOCIATES
APPENDIX A: HISTORY OF <strong>METRO</strong><br />
The <strong>Santa</strong> <strong>Cruz</strong> Metropolitan <strong>Transit</strong> District was formed in 1968 following the approval of a countywide<br />
vote to establish such a district with taxing authority. The initial boundaries of the transit served were<br />
developed around the communities of <strong>Santa</strong> <strong>Cruz</strong>, Capitola, and Live Oak. The boundaries were later<br />
expanded to include the rest of the populate area in the County.<br />
The first operations were contracted to the <strong>Santa</strong> <strong>Cruz</strong> <strong>Transit</strong> Co. in September of 1970. Service was<br />
composed of five local <strong>Santa</strong> <strong>Cruz</strong> lines and one suburban route to Capitola. The district then took over<br />
operations in 1971 with the purchase of six new General Motors coaches. At this time service was provided<br />
to the old Mission Street, County Hospital, DeLaveaga Park, and Capitola. The original five lines were<br />
soon expanded to include service to the University, Aptos via Soquel and the Natural Bridges State Park.<br />
Continued service expansion, including weekend and night service in selected areas, occurred during the<br />
early part of the 1970’s to meet the escalating demands from the University and areas east of Aptos<br />
including La Selva Beach.<br />
Service to Watsonville was taken over by <strong>METRO</strong> from the privately operated Watsonville Bus Lines in<br />
February of 1974. Initial service included the extension of the Cabrillo College-Aptos route and the<br />
establishments of two new local services, Airport and East Lake. That same year, a new line was opened to<br />
serve Scotts Valley and the San Lorenzo Valley. The following year extensions to Boulder Creek and Felton<br />
were added.<br />
Funding sources took a significant shift in June of 1979 when voters approved “Measure G” which changed<br />
the basis of transit support in the County from property tax to a ½ cent sales tax. As a result, new buses<br />
where purchased and service expansion continued including rural service to Davenport, Bonny Doon,<br />
Branciforte Drive, Glen Canyon, and Old San Jose Road. Three summer recreational routes also starting,<br />
providing park & ride shuttle service to the Capitola and <strong>Santa</strong> <strong>Cruz</strong> beachfronts. Extensive service<br />
improvements in March of 1980 including renumbering the routes to correspond to the geographical<br />
regions they served: (1-29) <strong>Santa</strong> <strong>Cruz</strong>, (30-39) San Lorenzo Valley, (40-49) North Coast, (50-69) Mid<br />
County, and (70-79) South County.<br />
Productivity indicators were first introduced by the District in 1981 to improve the efficiency of the routes<br />
in service. Four productivity indicators and operational standards were developed which included farebox<br />
recovery, passengers per hour, passengers per mile, and a utilization ratio. Routes were then assigned to<br />
one of three classifications - urban collector/express routes, urban local routes, and rural routes. Each<br />
category of route had an appropriate operational standard from which staff could identify unproductive or<br />
unwarranted service from.<br />
Funding cuts and rising operating costs continued throughout the 1980’s, forcing <strong>METRO</strong> to cut staffing,<br />
alter service, and increase bus fares. The biggest hit came in 1989 when the regions was struck with the<br />
Loma Prieta earthquake, wiping out many of roads and bridges leading into the area, including the two<br />
major state highway – Highway 1 and Highway 17. The Watsonville Bus Maintenance and Operating<br />
Facility was also lost in the earthquake and the <strong>Santa</strong> <strong>Cruz</strong> Operating Facility was severely damaged. The<br />
Highway 17 Express service was soon implemented as an emergency bus service jointly operated by the<br />
District and <strong>Santa</strong> Clara <strong>Transit</strong>.<br />
The earthquake’s economic impacts on the retail market resulted in a significant reduction in the sales tax,<br />
which accounted for 50% of the District’s operation budget. In March of 1990, the District was forced to<br />
raise base fares to $1.00, cut expenses, and lay off managerial, administrative, and operations personnel.<br />
101015<br />
SANTA CRUZ SHORT RANGE TRANSIT PLAN<br />
Page A - 1<br />
WILBUR SMITH ASSOCIATES
APPENDIX A: HISTORY OF <strong>METRO</strong><br />
Service was then reduced by 28% in December of 1990 and a systemwide redesign was implemented that<br />
affected virtually every route in the system.<br />
In 2005, <strong>METRO</strong> experienced a driver’s strike that resulted in service not operating for the month of<br />
October. Ridership following this event significantly dropped and has been in recovery ever since. The<br />
compromise reached following the strike outlined mandatory break times for the drivers during an eight<br />
hour work shift. To meet these new requirements, <strong>METRO</strong> was forced to tighten its scheduling practices<br />
and minimize any lost time in the existing schedules.<br />
101015<br />
SANTA CRUZ SHORT RANGE TRANSIT PLAN<br />
Page A - 2<br />
WILBUR SMITH ASSOCIATES
APPENDIX B: FLEET INVENTORY<br />
REVENUE VEHICLES<br />
(data as of April 11 th , 2008)<br />
Vehicle # Manufacturer Veh. Type Year VIN License # Model YTD MILES<br />
8075 NEW FLYER Bus 1988 XJU013217 E-200899 D35 99,775<br />
8076 NEW FLYER Bus 1988 1JU013218 E-200898 D35 969,651<br />
8077 NEW FLYER Bus 1988 3JU013219 E-431948 D35 822,396<br />
8078 NEW FLYER Bus 1988 XJU013220 E-484800 D35 846,984<br />
8079 NEW FLYER Bus 1988 1JU013221 E-484799 D35 811,947<br />
8080 NEW FLYER Bus 1988 3JU013222 E-484798 D35 769,293<br />
8081 NEW FLYER Bus 1988 5JU013223 E-484797 D35 649,086<br />
8082 NEW FLYER Bus 1988 7JU013224 E-484796 D35 723,304<br />
8083 NEW FLYER Bus 1988 9JU013225 E-484795 D35 735,263<br />
8084 NEW FLYER Bus 1988 0JU013226 E-484794 D35 761,353<br />
8085 NEW FLYER Bus 1988 2JU013227 E-484793 D35 745,904<br />
8090 NEW FLYER Bus 1988 6JU013232 E-484789 D35 876,234<br />
8091 NEW FLYER Bus 1988 8JU013233 E-484788 D35 864,798<br />
8092 NEW FLYER Bus 1988 XJU013234 E-484787 D35 814,507<br />
8095 NEW FLYER Bus 1988 5JU013237 E-484784 D35 890,364<br />
Fleet Age 20 Diesel 35' Count 15 758,724<br />
8100 NEW FLYER Bus 1989 C01KU013468 E-114011 D40 929,360<br />
8101 NEW FLYER Bus 1989 C03KU013469 E-114010 D40 1,005,448<br />
8102 NEW FLYER Bus 1989 C0XKU013470 E-114012 D40 914,037<br />
8103 NEW FLYER Bus 1989 C01KU013471 E-114013 D40 928,895<br />
8105 NEW FLYER Bus 1989 C05KU013473 E-114018 D40 932,255<br />
8106 NEW FLYER Bus 1989 C07KU013474 E-114016 D40 935,307<br />
8107 NEW FLYER Bus 1989 C09KU013475 E-114019 D40 924,098<br />
Fleet Age 19 Diesel 40' Count 7 938,486<br />
9801 NEW FLYER Bus 1998 5FYD2SL04WU018344 E-1019702 D35LF 465,725<br />
9802 NEW FLYER Bus 1998 5FYD2SL06WU018345 E-1019703 D35LF 527,380<br />
9803 NEW FLYER Bus 1998 5FYD2SL08WU018346 E-1019704 D35LF 468,236<br />
9804 NEW FLYER Bus 1998 5FYD2SL0XWU018347 E-1019705 D35LF 495,374<br />
9805 NEW FLYER Bus 1998 5FYD2SL01WU018348 E-1019706 D35LF 470,330<br />
9806 NEW FLYER Bus 1998 5FYD2SL03WU018349 E-1019707 D35LF 449,139<br />
9807 NEW FLYER Bus 1998 5FYD2SL0XWU018350 E-1019708 D35LF 469,515<br />
9808 NEW FLYER Bus 1998 5FYD2SL01WU018351 E-1019709 D35LF 445,550<br />
9809 NEW FLYER Bus 1998 5FYD2SL03WU018352 E-1019710 D35LF 443,768<br />
9810 NEW FLYER Bus 1998 5FYD2SL05WU018353 E-1019711 D35LF 442,405<br />
9811 NEW FLYER Bus 1998 5FYD2SL07WU018354 E-1019712 D35LF 488,231<br />
9812 NEW FLYER Bus 1998 5FYD2SL09WU018355 E-1019713 D35LF 454,099<br />
9813 NEW FLYER Bus 1998 5FYD2SL00WU018356 E-1019714 D35LF 469,922<br />
101015<br />
SANTA CRUZ <strong>METRO</strong> SRTP<br />
Page B - 1<br />
WILBUR SMITH ASSOCIATES
APPENDIX B: FLEET INVENTORY<br />
Vehicle # Manufacturer Veh. Type Year VIN License # Model YTD MILES<br />
9814 NEW FLYER Bus 1998 5FYD2SL02WU018357 E-1019715 D35LF 468,314<br />
9815 NEW FLYER Bus 1998 5FYD2SL04WU018358 E-1019716 D35LF 458,365<br />
9816 NEW FLYER Bus 1998 5FYD2SL06WU018359 E-1019717 D35LF 492,736<br />
9817 NEW FLYER Bus 1998 5FYD2SL02WU018360 E-1019718 D35LF 495,004<br />
9818 NEW FLYER Bus 1998 5FYD2SL04WU018361 E-1019719 D35LF 496,264<br />
Fleet Age 10 Diesel 35' Count 18 472,242<br />
9819 NEW FLYER Bus 1998 5FYD2LL09WU018362 E-1011093 D40LF 491,531<br />
9820 NEW FLYER Bus 1998 5FYD2LL00WU018363 E-1011094 D40LF 463,583<br />
9821 NEW FLYER Bus 1998 5FYD2LL02WU018364 E-1011095 D40LF 427,374<br />
9822 NEW FLYER Bus 1998 5FYD2LL04WU018365 E-1011096 D40LF 435,821<br />
9823 NEW FLYER Bus 1998 5FYD2LL06WU018366 E-1011097 D40LF 419,864<br />
9824 NEW FLYER Bus 1998 5FYD2LL08WU018367 E-1011098 D40LF 480,025<br />
9825 NEW FLYER Bus 1998 5FYD2LL0XWU018368 E-1011099 D40LF 457,096<br />
9826 NEW FLYER Bus 1998 5FYD2LL01WU018369 E-1019700 D40LF 428,861<br />
9827 NEW FLYER Bus 1998 5FYD2LL08WU018370 E-1019701 D40LF 406,416<br />
9828 NEW FLYER Bus 1998 5FYD2LL0XWU018371 E-1019722 D40LF 447,792<br />
9829 NEW FLYER Bus 1998 5FYD2LL01WU018372 E-1019720 D40LF 437,271<br />
9830 NEW FLYER Bus 1998 5FYD2LL03WU018373 E-1019721 D40LF 434,301<br />
Fleet Age 10 Diesel 40' LowFloor Count 12 444,161<br />
9831 GILLIG, 1984 Bus 2000 15GCD081XE1080814 E-445937 40TB/96 480,679<br />
9832 GILLIG, 1984 Bus 2000 15GCD0814E1080787 E-445941 40TB/96 497,361<br />
9833 GILLIG, 1984 Bus 2000 15GCD0813E1080790 E-445975 40TB/96 503,818<br />
9834 GILLIG, 1984 Bus 2000 15GCD0817E1080792 E-445977 40TB/96 490,139<br />
9835 GILLIG, 1984 Bus 2000 15GCD081DE1080800 E-445984 40TB/96 445,948<br />
9836 GILLIG, 1984 Bus 2000 15GCD0816E1080803 E-445987 40TB/96 439,713<br />
9837 GILLIG, 1984 Bus 2000 15GCD081XE1080805 E-445993 40TB/96 449,897<br />
9838 GILLIG, 1984 Bus 2000 15GCD0816E1080807 E-445991 40TB/96 450,711<br />
9839 GILLIG, 1984 Bus 2000 15GCD0814E1080811 E-445940 40TB/96 466,293<br />
9840 GILLIG, 1984 Bus 2000 15GCD0816E1080812 E-445939 40TB/96 459,029<br />
Fleet Age 8 Diesel 40' Count 10 468,359<br />
2201 NEW FLYER Bus 2002 5FYC2LP092U024047 1133345 C40LF 247,059<br />
2202 NEW FLYER Bus 2002 5FYC2LP002U024048 1133346 C40LF 230,821<br />
2203 NEW FLYER Bus 2002 5FYC2LP022U024049 1133347 C40LF 205,086<br />
2204 NEW FLYER Bus 2002 5FYC2LP092U024050 1133348 C40LF 196,349<br />
2205 NEW FLYER Bus 2002 5FYC2LP002U024051 1133349 C40LF 159,111<br />
2206 NEW FLYER Bus 2002 5FYC2LP022U024052 1139300 C40LF 197,953<br />
2207 NEW FLYER Bus 2002 5FYC2LP042U024053 1139301 C40LF 205,876<br />
2208 NEW FLYER Bus 2002 5FYC2LP062U024054 1139302 C40LF 199,388<br />
Fleet Age 6 CNG 40' LowFloor Count 8 205,205<br />
101015<br />
SANTA CRUZ <strong>METRO</strong> SRTP<br />
Page B - 2<br />
WILBUR SMITH ASSOCIATES
APPENDIX B: FLEET INVENTORY<br />
Vehicle # Manufacturer Veh. Type Year VIN License # Model YTD MILES<br />
10 CHANCE TROL/REP 2002 1C9S2CCS62W535135 E-1139326 AH-28 8145<br />
Fleet Age 6 CNG 32' replica Count 1 8,145<br />
2210 NEW FLYER Bus 2003 5FYD2GL082U024705 1161769 D35LFC 230,913<br />
2211 NEW FLYER Bus 2003 5FYD2GL0X2U024706 1156746 D35LFC 252,508<br />
2212 NEW FLYER Bus 2003 5FYD2GL012U024707 1156749 D35LFC 247,820<br />
2213 NEW FLYER Bus 2003 5FYD2GL032U024708 1161750 D35LFC 224,994<br />
2214 NEW FLYER Bus 2003 5FYD2GL052U024709 1161773 D35LFC 281,229<br />
2215 NEW FLYER Bus 2003 5FYD2GL012U024710 1161774 D35LFC 252,429<br />
2216 NEW FLYER Bus 2003 5FYD2GL032U024711 1161761 D35LFC 229,224<br />
2217 NEW FLYER Bus 2003 5FYD2GL052U024712 1161775 D35LFC 348,762<br />
2218 NEW FLYER Bus 2003 5FYD2GL072U024713 1161757 D35LFC 244,240<br />
2219 NEW FLYER Bus 2003 5FYD2GL092U024714 1161770 D35LFC 457,567<br />
2220 NEW FLYER Bus 2003 5FYD2GL002U024715 1161762 D35LFC 233,892<br />
2221 NEW FLYER Bus 2003 5FYD2GL022U024716 1161767 D35LFC 216,200<br />
2222 NEW FLYER Bus 2003 5FYD2GL042U024717 1161763 D35LFC 251,987<br />
2223 NEW FLYER Bus 2003 5FYD2GL062U024718 1161766 D35LFC 232,504<br />
2224 NEW FLYER Bus 2003 5FYD2GL082U024719 1161764 D35LFC 253,025<br />
Fleet Age 5 Diesel/CNG 35' Low Count 15 263,820<br />
2225 NEW FLYER Bus 2003 5FYD2LL052U024640 1156748 D40LFC 260,155<br />
2226 NEW FLYER Bus 2003 5FYD2LL072U024641 1156747 D40LFC 207,078<br />
2227 NEW FLYER Bus 2003 5FYD2LL092U024642 1161765 D40LFC 200,070<br />
2228 NEW FLYER Bus 2003 5FYD2LL002U024643 1161755 D40LFC 238,433<br />
2229 NEW FLYER Bus 2003 5FYD2LL022U024644 1161776 D40LFC 225,822<br />
2230 NEW FLYER Bus 2003 5FYD2LL042U024645 1161771 D40LFC 235,486<br />
2231 NEW FLYER Bus 2003 5FYD2LL062U024646 1161754 D40LFC 193,228<br />
2232 NEW FLYER Bus 2003 5FYD2LL082U024647 1161753 D40LFC 174,414<br />
2233 NEW FLYER Bus 2003 5FYD2LL0X2U024648 1161768 D40LFC 200,428<br />
2234 NEW FLYER Bus 2003 5FYD2LL012UO24649 1161772 D40LFC 168,609<br />
2235 NEW FLYER Bus 2003 5FYD2LL082U024650 1161779 D40LFC 125,504<br />
2236 NEW FLYER Bus 2003 5FYD2LL0X2U024651 1161756 D40LFC 144,689<br />
2237 NEW FLYER Bus 2003 5FYD2LL012U024652 1161777 D40LFC 158,896<br />
2238 NEW FLYER Bus 2003 5FYD2LL032U024653 1161778 D40LFC 182,513<br />
Fleet Age 5 Diesel/CNG 40' Low Count 14 193,952<br />
2301 ORION BUS 2003 1VHAH3A2536502006 1119644 V 267,742<br />
2302 ORION BUS 2003 1VHAH6A2936502141 1179154 V 211,483<br />
2303 ORION BUS 2003 1VHAH6A2036502142 1179155 V 242,866<br />
2304 ORION BUS 2003 1VHAH6A2236502143 1179156 V 263,570<br />
2305 ORION BUS 2003 1VHAH6A2436502144 1179157 V 247,533<br />
2306 ORION BUS 2003 1VAHA6A2636502145 1179161 V 222,808<br />
2307 ORION BUS 2003 1VHAH6A2836502146 1179163 V 223,257<br />
2308 ORION BUS 2003 1VHAH6A2X36502147 1179162 V 190,863<br />
2309 ORION BUS 2003 1VHAH6A2136502148 1179164 V 224,236<br />
101015<br />
SANTA CRUZ <strong>METRO</strong> SRTP<br />
Page B - 3<br />
WILBUR SMITH ASSOCIATES
APPENDIX B: FLEET INVENTORY<br />
Vehicle # Manufacturer Veh. Type Year VIN License # Model YTD MILES<br />
2310 ORION BUS 2003 1VHAH6A2336502149 1179165 V 201,862<br />
2311 ORION BUS 2003 1VHAH6A2X36502150 1179166 V 189,381<br />
Fleet Age 5 Diesel Suburban 41' Count 11 225,964<br />
2405 FORD/GOSHEN BUS 2003 1FDXE45S53HB85231 1172517 GCII 18,297<br />
2406 FORD/GOSHEN BUS 2003 1FDXE45S33HB85227 1172520 GCII 23,653<br />
Fleet Age 5 Gas 25' Cutout Count 2 20,975<br />
2601 NEW FLYER BUS 2006 5FYC4FP076C030758 1263658 C40LF 37026<br />
2602 NEW FLYER BUS 2006 5FYC4FP096C030759 1263657 C40LF 27548<br />
Fleet Age 2 CNG 40' LowFloor Count 2 32,287<br />
Avg. Age 9 Total Ct. 115 411,988<br />
All Buses:<br />
GenFare registering fareboxes, solid-state circuitry, probe enabled, one each<br />
DR500 Talking Bus - Bus Stop annunciator linked with visible scrolling text bar<br />
Twin Vision / Luminator destination curtain (external)<br />
Motorola Maritrak 2-Way Radio Set<br />
Sportworks - front-mounted, 2-position bike racks (incrementally updating to 3-position)<br />
Air Conditioning: 8100-8107, 9831-9840, 2201 - 2238 fleets<br />
Kneeling and Wheelchair Accessible - Lift or low-floor w/ramp.<br />
101015<br />
SANTA CRUZ <strong>METRO</strong> SRTP<br />
Page B - 4<br />
WILBUR SMITH ASSOCIATES
APPENDIX B: FLEET INVENTORY<br />
PARATRANSIT VEHICLES<br />
(data as of April 11 th , 2008)<br />
Vehicle # Manufacturer Model Year VIN License # Mileage Location<br />
104 CHEVROLET VENTURE 2001 1GNDX03E71D157031 E-1060819 106078 SCT<br />
105 CHEVROLET VENTURE 2001 1GNDX03E61D156713 E-1060820 90293 SCT<br />
106 CHEVROLET VENTURE 2001 1GNDX03E11D157316 E-1060818 108626 SCT<br />
107 CHEVROLET VENTURE 2001 1GNDX03E31D158077 E-1060822 108241 CCAB<br />
108 CHEVROLET VENTURE 2001 1GNDX03E31D162095 E-1060821 107270 CCAB<br />
109 CHEVROLET VENTURE 2001 1GNDX03EX1D160120 E-1060825 95769 Para<strong>Cruz</strong><br />
110 CHEVROLET VENTURE 2001 1GNDX03E11D157428 E-1100004 94514 CCAB<br />
Fleet Age 7 Count 7 101,542 Avg.Mi.<br />
205 CHEVROLET VENTURE 2002 1GNDX03E62D158429 E-1120726 119885 Para<strong>Cruz</strong><br />
206 CHEVROLET VENTURE 2002 1GNDX03E22D155107 E-1120725 111311 Para<strong>Cruz</strong><br />
207 CHEVROLET VENTURE 2002 1GNDX03E32D155195 E-1101687 115086 Para<strong>Cruz</strong><br />
208 CHEVROLET VENTURE 2002 1GNDX03E72D155667 E-1101688 116406 Para<strong>Cruz</strong><br />
209 CHEVROLET VENTURE 2002 1GNDX03E42D156016 E-1146494 70942 Para<strong>Cruz</strong><br />
Fleet Age 6 Count 5 106,726 Avg.Mi.<br />
305 CHEVROLET VENTURE 2003 1GBDX23E13D263860 E-1150932 86497 Para<strong>Cruz</strong><br />
306 CHEVROLET VENTURE 2003 1GBDX23E93D266425 E-1150996 56520 Para<strong>Cruz</strong><br />
307 CHEVROLET VENTURE 2003 1GBDX23E63D266169 E-1150926 56433 Para<strong>Cruz</strong><br />
308 CHEVROLET VENTURE 2003 1GBDX23E73D266505 E-1150925 81532 Para<strong>Cruz</strong><br />
309 CHEVROLET VENTURE 2003 1GBDX23E83D263595 E-1150993 85059 Para<strong>Cruz</strong><br />
310 CHEVROLET VENTURE 2003 1GBDX23E13D265592 E-1163039 94026 Para<strong>Cruz</strong><br />
311 CHEVROLET VENTURE 2003 1GBDX23E43D267367 E-1150995 101343 Para<strong>Cruz</strong><br />
312 CHEVROLET VENTURE 2003 1GBDX23E63D264812 E-1150923 101908 Para<strong>Cruz</strong><br />
313 CHEVROLET VENTURE 2003 1GBDX23E33D266713 E-1150924 104410 Para<strong>Cruz</strong><br />
314 CHEVROLET VENTURE 2003 1GBDX23E83D263872 E-1150992 96786 Para<strong>Cruz</strong><br />
315 CHEVROLET VENTURE 2003 1GBDX23E33D264556 E-1150991 102828 Para<strong>Cruz</strong><br />
316 CHEVROLET VENTURE 2003 1GBDX23E93D265470 E-1163040 95919 Para<strong>Cruz</strong><br />
317 CHEVROLET VENTURE 2003 1GBDX23EX3D263288 E-1163038 95412 Para<strong>Cruz</strong><br />
318 CHEVROLET VENTURE 2003 1GBD23XE53D263845 E-1163037 102305 Para<strong>Cruz</strong><br />
319 CHEVROLET VENTURE 2003 1GBDX23E33D265786 E-1150994 102011 Para<strong>Cruz</strong><br />
320 CHEVROLET VENTURE 2003 1GBDX23E03D263848 E-1150933 99574 Para<strong>Cruz</strong><br />
321 CHEVROLET VENTURE 2003 1GBDX23E83D264830 E-1150930 92817 Para<strong>Cruz</strong><br />
Fleet Age 5 Count 17 91,493 Avg.Mi.<br />
2401 FORD/GOSHEN GCII 2003 1FDXE45S43HB85219 E-1172516 65770 Para<strong>Cruz</strong><br />
2402 FORD/GOSHEN GCII 2003 1FDXE45S23HB85221 E-1172519 82297 Para<strong>Cruz</strong><br />
2403 FORD/GOSHEN GCII 2003 1FDXE45S63HB85240 E-1172515 70242 Para<strong>Cruz</strong><br />
101015<br />
SANTA CRUZ <strong>METRO</strong> SRTP<br />
Page B - 5<br />
WILBUR SMITH ASSOCIATES
APPENDIX B: FLEET INVENTORY<br />
Vehicle # Manufacturer Model Year VIN License # Mileage Location<br />
2404 FORD/GOSHEN GCII 2003 1FDXE45S E-1172518 39774 Para<strong>Cruz</strong><br />
Fleet Age 5 Count 4 34,981 Avg.Mi.<br />
2603 FORD/AEROTECH Aerotech 2006 E- 40773 Para<strong>Cruz</strong><br />
Fleet Age 2 Count 1 40,773 Avg.Mi.<br />
2604 FORD/Transporter Transporter 2007 E- 2949 Para<strong>Cruz</strong><br />
2701 FORD/Transporter Transporter 2007 E- 3313 Para<strong>Cruz</strong><br />
Fleet Age 1 Count 2 40,773 Avg.Mi.<br />
Avg. Age 6 Total 34 92,135 Avg.Mi.<br />
101015<br />
SANTA CRUZ <strong>METRO</strong> SRTP<br />
Page B - 6<br />
WILBUR SMITH ASSOCIATES
APPENDIX B: FLEET INVENTORY<br />
NON-REVENUE VEHICLES<br />
(data as of April 11 th , 2008)<br />
Vehicle # Manufacturer Veh. Type Year VIN License # YTD MILES<br />
121 GMC Parade Bus 1951 TGH3101496 E-1002012 N/A<br />
842 GMC Bus 1976 T6H4523N2342 E-681577 861,848<br />
900 RDSTR Trailer 1984 1M6FERE18E1001099 E-323227 N/A<br />
901 SPCNS Trailer 1986 CA470970 E-322019 N/A<br />
902 DARGO Trailer 2003 5HGBC10173M001068 915190 N/A<br />
8026 INTERNATIONAL Service Truck 1985 HTLDMJL6GHA15346 E-484756 144,425<br />
8027 CHEVROLET Sedan 1986 GIAW19WOG6142820 E-484717 86,844<br />
9700 FORD Van 1997 1FMCA11U7VZC24625 E-994290 230,606<br />
9850 FORD Sedan 1998 1FAFP66Z6WK259982 E-041545 45,549<br />
9950 FORD Cargo Van 1999 1FTNE24Z6XHB94217 E-1032379 47,127<br />
9951 FORD Cargo Van 1999 1FTNS24Z7XHB94218 E-1032382 69,906<br />
001 FORD Van 2000 1FMNE31M3YHA99299 E-1047405 129,720<br />
002 FORD Van 2000 1FMNE31M6YHA99300 E-1047406 130,180<br />
003 GMC Van 2000 1GKDM19WXYB545419 E-1087779 78,348<br />
101 FORD Flat Bed Truck 2001 1FDWF36S81EA24730 E-1087782 25,875<br />
102 DODGE Van 2001 2B4JB25T41K517327 E-1087781 107,170<br />
103 FORD Service Body 2001 1FTNF20L51EA53355 E-1087780 34,810<br />
116 TOYOTA Sedan 2001 JT2BK12U710037002 E-1035705 25,143<br />
201 FORD Explorer 2002 1FMZU63E22UA23812 E-1087798 214,804<br />
202 FORD Explorer 2002 1FMZU63E42UA23813 E-1087797 184,792<br />
203 TOYOTA Sedan 2002 JT2BK18U020042342 E-1120610 13,016<br />
301 FORD Van 2003 1FDNE31MX3HA85716 E-1161798 81,580<br />
302 FORD Van 2003 1FDNE31M13HA85717 E-1161797 84,802<br />
303 FORD Van 2003 1FDNE31M33HA85718 E-1161796 87,892<br />
304 FORD Van 2003 1FDNE31M53HA85719 E-1161795 84,118<br />
401 CHEVROLET P/up Truck 2004 1GCEC14T34E338282 E-1168859 19,011<br />
501 HONDA Sedan 2005 JHMES96625S014802 E-1192214 16,132<br />
502 HONDA Sedan 2005 JHMES96645S014803 E-1192215 7,787<br />
503 FORD Explorer 2005 1FMZU63E75ZA68655 E-1192233 102,867<br />
504 CHEVROLET P/up Truck 2005 1GCGC24U85E265158 E-1192234 12,863<br />
505 CHEVROLET P/up Truck 2005 1GCGC29UX5E266014 E-1209457 12,498<br />
601 CHEVROLET P/up Truck 2006 1GCCS146968298943 E-1226369 17,491<br />
602 FORD Explorer 2006 1FMEU63E56ZA19504 E-1226386 44,304<br />
603 FORD Service Body 2006 1FDNF20547EA22958 E-1241259 6,760<br />
705 FORD Sedan 2007 1FAHP34N17W183475 E-1263659 27,002<br />
706 FORD Sedan 2007 1FAHP34N37W183476 E-1263660 27,594<br />
707 FORD Sedan 2007 1FAHP34N57W183477 E-1263661 25,974<br />
708 FORD Service Truck 2007 1FDAF56Y77EB28208 E-1253042 8,869<br />
709 FORD Sedan 2007 1FAHP34N57W312544 E-1263688 14,595<br />
101015<br />
SANTA CRUZ <strong>METRO</strong> SRTP<br />
Page B - 7<br />
WILBUR SMITH ASSOCIATES
APPENDIX C: <strong>METRO</strong> WEBSITE EVALUATION<br />
The use of websites by transit agencies has gone from a technical option to an important component<br />
of it’s information system. This change is a direct reflection of how the internet is now a mainstream<br />
form of real-time information for today’s society. The latest US Census household survey 1 found<br />
that 70 million American households, or 62% of total households, had one or more computers and<br />
nearly 60% of households use the internet on those computers. This statistic is part of an upward<br />
trend in computer ownership that started at only 8% in 1984 and grew 12.6% between 2001 and<br />
2003. Most recently, broadband technologies have sped up the internet connections making surfing<br />
the web more accessible and convenient than ever before.<br />
<strong>Santa</strong> <strong>Cruz</strong> <strong>METRO</strong>, like many other transit agencies across the country, should use this resource to<br />
inform its current riders of available service options and updates and as a tool to attract new riders.<br />
For many transit users the agency’s website is the primary source of information, and often times<br />
provides the initial representation of the agency. Providing and maintaining an updated, accurate<br />
website that is informative and easy to use for the general public, should be a high priority for<br />
<strong>METRO</strong> staff.<br />
A number of resources are available to help transit agencies in developing a successful website. This<br />
following analysis used a combination of resources to assess <strong>METRO</strong>’s current website and in the<br />
development of recommendations for the website.<br />
BACKGROUND MATERIALS<br />
General website design heuristics were taken from the practice of usability engineering and human<br />
factors engineering. These materials provide guidance of user interface design for websites that lead<br />
to increased user efficiency and satisfaction with web-based interfaces. These materials included the<br />
useit.com website, Usabilty Engineering (Nielsen, 1994), and Human Factors Engineering (Wickens,<br />
Gordon, Liu, 1997).<br />
The <strong>Transit</strong> Cooperative Research Program (TCRP) Synthesis 43 Report: Effective Use of <strong>Transit</strong><br />
Websites provides a summary of information collected from 47 transit agencies across the US.<br />
Information was collected from transit website managers, analysis of server logs showing website<br />
usage, market research results from various agencies, and relevant literature.<br />
The Intelligent Transportation Systems (ITS) division of the U.S. Department of Transportation has<br />
developed an on-line handbook for the development of public transit websites. This site is located at<br />
www.its.dot.gov/transit_dev/guidelines/main.asp and provides a summary of design principles for<br />
the development of transit websites. The checklist for website recommendation from this sources<br />
has been included at the end of this Appendix.<br />
The Federal <strong>Transit</strong> Administration (FTA) and <strong>METRO</strong> magazine regularly recognize top websites<br />
with the transit industry and publish the results. Due to the rapidly developing nature of website<br />
design and the constantly changing interfaces by many of the most advanced transit websites, many<br />
have been modified since they were first recognized. A select number of these sites were used and<br />
referenced as best in industry examples.<br />
1 Data is from the Computer and Internet Use Supplement to the October 2003 Current Population Survey.<br />
101015<br />
SANTA CRUZ <strong>METRO</strong> SRTP<br />
Page C - 1<br />
WILBUR SMITH ASSOCIATES
APPENDIX C: <strong>METRO</strong> WEBSITE REVIEW<br />
Results from <strong>METRO</strong>’s current online survey were also used to obtain <strong>METRO</strong>-specific usage<br />
patterns and preferences. Seventy-five of the most recent results were obtained and coded for use in<br />
the analysis.<br />
WEBSITE CONTENT AND USAGE<br />
The role of web-based communication through an online website is an extremely useful tool in<br />
providing direct information to those individuals with access to the internet. This tool has been<br />
found to be useful in automating several tasks that were traditionally time consuming and costly for<br />
many transit agencies 2 . These tasks include the printing of route schedules, publishing of job listings,<br />
and advertising of job procurement opportunities. Web page use has also reduced call volumes to<br />
customer service agents, minimizing the time spent in answering questions related to the transit<br />
operations and scheduling.<br />
<strong>Transit</strong> website features and their use differ between agencies. According to the results obtained<br />
from 33 transit agencies as reported in the TCRP Synthesis 43 report on Effective Use of <strong>Transit</strong><br />
Websites, the most common content provided on websites by transit agencies include:<br />
Content<br />
% of Agency Websites Displaying<br />
Content<br />
Fares 100%<br />
Schedules 97%<br />
Route maps 94%<br />
Accessibility information 91%<br />
ADA (paratransit) services 88%<br />
Employment 85%<br />
Press information/service updates 82%<br />
System map 79%<br />
Special event information 79%<br />
Procurement information 70%<br />
What’s new 67%<br />
Links to other transportation sites 67%<br />
The most commonly used content features are schedules/timetables and maps which can be<br />
classified as primary information. The same TCRP report cited that server logs and survey responses<br />
from 28 transit agencies found that 96% of all usage was for schedules or timetables and 61% for<br />
maps. The other content, or secondary information, which received at least 1% of hits in this study<br />
included:<br />
• Fares<br />
• Pass information<br />
• “About the agency” pages<br />
• Employment<br />
• Trip planner<br />
• Various “how to ride” pages<br />
2 TCRP Synthesis 43: Effective Use of <strong>Transit</strong> Websites<br />
101015<br />
SANTA CRUZ <strong>METRO</strong> SRTP<br />
Page C - 2<br />
WILBUR SMITH ASSOCIATES
APPENDIX C: <strong>METRO</strong> WEBSITE REVIEW<br />
• News<br />
• Events<br />
• Service expansion information<br />
Similar results for website content preferences were displayed by <strong>METRO</strong> website users. Figure 1<br />
shows the “Print Your Own Schedule” page was the most commony accessed page within the<br />
website followed by the “How to Ride” and “Fare” page. The usage is much more balanced than the<br />
results of the agencies surveyed in the TCRP publication.<br />
Figure 1: Page by page usage by the respondents<br />
100%<br />
90%<br />
80%<br />
70%<br />
65%<br />
Percent of Responses<br />
60%<br />
50%<br />
40%<br />
30%<br />
59%<br />
56%<br />
52%<br />
49%<br />
33%<br />
29%<br />
20%<br />
21%<br />
10%<br />
0%<br />
Print Your Own Schedule<br />
How to Ride<br />
Fares<br />
News<br />
Tell Us<br />
Board Minutes<br />
Jobs<br />
Bids<br />
Response<br />
ANALYSIS OF CURRENT WEBSITE SURVEY<br />
The current <strong>METRO</strong> website offers users the ability to complete a web-based survey to solicit<br />
feedback on their use and satisfaction with the current website. The link that takes you to the survey<br />
simply tells the user “Click Here to Take a Survey”. The website then presents the user with 23<br />
questions (less for those who haven’t ridden a bus or used the site to plan their transit trip) to be<br />
answered toward completion of the survey. An open ended comments box is also available at the<br />
end of the survey.<br />
The use of the survey results was felt to be important because it was feedback from primary users of<br />
the site. A few things should be kept in mind when reviewing the results. The first is the fact that<br />
five of the questions on the survey have default responses that indicate favorable preferences. (what<br />
do we know about favorable preferences? Cite example) If the user decides not to participate in the<br />
survey and hits the Submit Info button at the bottom of the page, these responses would be added<br />
the overall results. The motivation of those using the survey may also impact the results. Since the<br />
101015<br />
SANTA CRUZ <strong>METRO</strong> SRTP<br />
Page C - 3<br />
WILBUR SMITH ASSOCIATES
APPENDIX C: <strong>METRO</strong> WEBSITE REVIEW<br />
survey is voluntary, those choosing to participate may be users that are angry or upset about a certain<br />
aspect of the service and want to use the link to vent their comments.<br />
With that said, the most recent 75 website survey responses were obtained and used as the sample<br />
population. These survey results were coded and analyzed and are presented in chart form in at the<br />
end of this Appendix. The key findings from this analysis showed the following:<br />
• Almost half of all users are frequent users of the website (visited the site more than 10 times)<br />
• The most common reason for the website visit was to find bus schedule information (64% of<br />
responses)<br />
• Ease of navigation through <strong>METRO</strong>’s site was average, compared to other websites, (42% of<br />
responses)<br />
• The majority of respondents felt the webpages loaded quickly (72% of responses)<br />
• 87% of respondents had previously ridden a <strong>METRO</strong> bus<br />
• 73% of respondents used the information from the website to plan a trip on a <strong>METRO</strong> bus<br />
• Of those who used the website to plan a trip, 59% felt the information was very<br />
accurate while the remaining 41% felt it was somewhat accurate<br />
• Of those who used the website to plan a trip, 88% said they would use it again for that<br />
purpose<br />
• 67% of respondents who have never ridden a <strong>METRO</strong> bus said the presence of information<br />
on the web would increase their likelihood to ride a <strong>METRO</strong> bus in the future<br />
• 92% plan to visit the <strong>METRO</strong> website again<br />
• 91% have access to a computer at home<br />
• 88% have access to a computer at work or school<br />
• 57% of respondents are females and 43% are males<br />
• 45% of respondents live in the city of <strong>Santa</strong> <strong>Cruz</strong><br />
• Over half of the respondents are between the ages of 18 and 35, with another 23% between<br />
46 and 55.<br />
Overall, the respondents seemed relatively content with the performance of the website. As<br />
mentioned earlier, the default settings for some of the questions may have resulted in misleading<br />
results which should be kept in mind when drawing conclusions from the results.<br />
The general comments portion at the end of the survey was a mixture of complaints resulting from<br />
poor on-time performance to suggestions for service improvements. Those relating to the content<br />
of the website were the following:<br />
• Include a trip planning tool that creates a transit itinerary based on an origin and destination<br />
input<br />
• Give the site a more professional look/update website graphics<br />
• Provide a system map showing all routes<br />
101015<br />
SANTA CRUZ <strong>METRO</strong> SRTP<br />
Page C - 4<br />
WILBUR SMITH ASSOCIATES
APPENDIX C: <strong>METRO</strong> WEBSITE REVIEW<br />
• Allow bus passes to be purchased online<br />
EVALUATION OF THE CURRENT <strong>METRO</strong> SITE<br />
Using the background materials listed above, the following is an assessment and evaluation of the<br />
current website offered by <strong>METRO</strong>. The end of this Appendix provides screenshots of well<br />
designed websites that display organizational and functional features that <strong>METRO</strong> should<br />
incorporate into their site.<br />
Inefficient Site Design<br />
<strong>METRO</strong>’s current website is not lacking in content, but the layout and overall look and feel of the<br />
site is cluttered and clumsy. The current interface is text heavy and does not lead the user toward the<br />
primary information of interest. The long loading time of the home page, low graphic resolution,<br />
and lack of organization are areas <strong>METRO</strong> should improve upon.<br />
Lack of Trip <strong>Plan</strong>ning Tools<br />
Frustration may arise from new users during their visit. The lack of a trip planner or system map<br />
does not allow new users (student, resident, tourist, etc.) to find out which route they can take to get<br />
from their origin to their destination. This could result in a missed opportunity for a new rider or a<br />
loss of a current rider.<br />
Untimely Information Updates<br />
The website fails to provide consistently updated information for its users. According to the site<br />
monitor located at the bottom of the home page, the current homepage was last updated July 9 th ,<br />
2001. Other pages have experienced more recent updates, such as the News page updated on<br />
January 4 th , 2007. The lack of updating these pages shows users the site is unmaintained and deters<br />
users from relying on the site for scheduling or service changes that could significantly affect their<br />
trip.<br />
Lack of a Professional Image<br />
The current website is quickly becoming outdated.(source – example) With the rapid development<br />
of the website design industry and flash technology, today’s websites are much more advanced than<br />
those of just a few years back. <strong>METRO</strong>’s website reflects the look and feel of a website of the past.<br />
This representation of the agency on web portrays an unprofessional image for <strong>METRO</strong> that should<br />
be addressed in future builds.<br />
Difficult Usability of Website<br />
Usability gives the site its functionality for the user, which is a key measure of how good the site<br />
really is. In the context of web design, usability is commonly defined by; the ease of learning how to<br />
use the site, the efficiency of the use at the site, the memorability of functionality within the site, the<br />
minimization of errors while using the site, and the overall satisfaction of use at the site. <strong>METRO</strong>’s<br />
current site displays characteristics such as inconsistent navigation bar locations and an abundance of<br />
text that decrease the usability and extend search times for the user.<br />
RECOMMENDATIONS FOR <strong>METRO</strong><br />
<strong>METRO</strong>’s current website is becoming outdated and lacks many of the modern design features and<br />
heuristics that are common among today’s transit websites. (for example) The following<br />
recommendations were developed using the results of <strong>METRO</strong>’s current online survey, results from<br />
101015<br />
SANTA CRUZ <strong>METRO</strong> SRTP<br />
Page C - 5<br />
WILBUR SMITH ASSOCIATES
APPENDIX C: <strong>METRO</strong> WEBSITE REVIEW<br />
other transit agency’s experiences with website use, and usability engineering principles as they relate<br />
to website design.<br />
<strong>METRO</strong>’s current website survey results were used alongside industry best-practice standards<br />
(developed by…)to develop recommendations <strong>METRO</strong> can use to update and/or recreate its<br />
current website. These recommendations are presented below in the areas of interface design, site<br />
functionality, and marketing.<br />
Interface Design<br />
To improve the usability of <strong>METRO</strong>’s site and increase the aesthetic and professional image of the<br />
page, the following recommendations are suggested. To help illustrate these recommendations, five<br />
transit agency home web pages have been provided at the end of this Appendix. These sites were<br />
recognized by either the FTA or <strong>METRO</strong> magazine as good examples for transit websites.<br />
1. Brand the site to reflect the identity of the agency (<strong>METRO</strong>). Displaying a nice clean<br />
logo and maintaining a color scheme representative of the agency (yellow and blue) will give<br />
the site a look and feel that is representative of the agency.<br />
2. Provide a universal navigation bar and prioritize its contents. The home page should<br />
set the standard for the navigation bars and they should not change appearance or location<br />
within the other pages of the website. This standardized navigation will help the user keep<br />
track of where they are on the site and improve navigability.<br />
Information presented in the navigation menu should be prioritized based on use. Results<br />
from the <strong>METRO</strong> website usage shows route/system map and schedule information<br />
account for 70% of all primary uses of the website. Research from other website usage<br />
revealed that these functions accounted for nearly 96% of all activity on transit websites.<br />
These results highlight the importance of these functions which should be given priority in<br />
the navigation element of the site’s design.<br />
Secondary use information should be located further down (vertical design) or to the right of<br />
(horizontal design) the primary functionality on the navigation bar. Secondary and primary<br />
information links should also be located at the bottom of all webpages. Placing these links<br />
in both places will allow the user to navigate at the top of the page and at the bottom if the<br />
page extends further than one screen.<br />
3. Incorporate icons. Icon use increases the legibility or a site which will lead to a reduction<br />
in search time and user frustration. Icons are also universal in language which can<br />
communicate to a larger audience.<br />
4. Improve readability and legibility. If text is appropriate on the page, be sure to maintain<br />
a good contrast between it and the background. This usually means a dark text on a white<br />
background or a reverse out using a white text on a dark background. The white<br />
background tends to be the preferred method but both are effective. The use of serif fonts<br />
should also be avoided.<br />
Site Functionality<br />
The usefulness of the site to the user varies based upon the functions available to them.<br />
Technological advances now allow transit websites to offer full trip planning application and real-<br />
101015<br />
SANTA CRUZ <strong>METRO</strong> SRTP<br />
Page C - 6<br />
WILBUR SMITH ASSOCIATES
APPENDIX C: <strong>METRO</strong> WEBSITE REVIEW<br />
time monitoring services. These advances in technology have changed the role of websites from a<br />
static posting board of information to a dynamic streaming source of information, increasing the<br />
overall usefulness of the site, as well as the cost and amount of programming required.(what amount<br />
of time/energy/$ needed to update site on ongoing basis?) Today’s Internet user commonly expects<br />
this level of functionality and <strong>METRO</strong> should make efforts to include these in its website update.<br />
The following recommendations are suggested for <strong>METRO</strong> to incorporate in their updated website:<br />
1. Include the option of dynamic trip-planning tools. Trip planning tools found on transit<br />
agency websites allow users to enter an origin, destination, and departure or arrival time and<br />
have a detailed trip itinerary be produced. This tool should provide this information for the<br />
service area and also refer the user to other agency trip planning tools (511.org, MST trip<br />
planner, Greyhound, etc.) if the origin or destination is outside <strong>METRO</strong>’s service area.<br />
Trip planning tools range in sophistication based upon the software capabilities of the<br />
agency. The more advanced tools allow the user to input a specific origin and destination<br />
address, start or end time of day for the trip, and fare category and then provide estimated<br />
travel costs and travel times for all modes included in the trip including walk time to the<br />
transit station and transfer wait times. Less expensive (do we know range of costs?) tools<br />
simply provide the user with a pre-determined list of origins and destinations within the<br />
service area and options for departure/arrival times from which an itinerary will be produced<br />
based on a simple query function. (what does it take to put that info together – both time<br />
and cost – who did current site?)<br />
One option for implementing this tool would be to purchase a module to interface with<br />
<strong>METRO</strong>’s current scheduling software. HASTUS, <strong>METRO</strong>’s current scheduling software,<br />
offers modules that allow trip planning functionality to be used with a web browser. The<br />
HASTINFO module for trip planning can work with <strong>METRO</strong>’s current HASTUS database<br />
to provide its customers with this functionality. Agencies currently using this trip planning<br />
tool online include Orange County Transportation Authority (OCTA), Kansas City Area<br />
Transportation Authority (KCATA), Mississauga <strong>Transit</strong> in Ontario, Canada, and Charlotte<br />
Area <strong>Transit</strong> System (CATS).<br />
<strong>METRO</strong> should also consider interfacing with Google <strong>Transit</strong> Trip <strong>Plan</strong>ner to provide<br />
trip scheduling functionality for its users. HASTUS announced last December that their<br />
interface is now compatible with the Google <strong>Transit</strong> program, allowing a direct feed of<br />
the necessary information to the application. <strong>METRO</strong> should consider pursuing this option<br />
and providing a link to Google <strong>Transit</strong> from their website for those users interested in the<br />
trip planning functionality. Nine of the current twelve transit agencies that use Google<br />
<strong>Transit</strong> are HASTUS users, demonstrating the high degree of compatibility between the two<br />
systems.<br />
2. Allow email exchange to occur between <strong>METRO</strong> and its users. Email is a key method<br />
of communication in today’s society and an easy way for <strong>METRO</strong> to keep connected with<br />
its riders. This form of communication requires <strong>METRO</strong> to obtain email addresses from its<br />
users. These addresses can be obtained though a number of different methods including a<br />
link on their website or an on-board flyer. <strong>METRO</strong> can also incorporate a question into<br />
other survey forms that asks the user for their email and whether or not they would like to<br />
receive updates via email. This communication method allows <strong>METRO</strong> to keep their riders<br />
informed of immediate service issues such as construction delays and community outreach<br />
events.<br />
101015<br />
SANTA CRUZ <strong>METRO</strong> SRTP<br />
Page C - 7<br />
WILBUR SMITH ASSOCIATES
APPENDIX C: <strong>METRO</strong> WEBSITE REVIEW<br />
3. Allow schedules and route maps to be downloaded to a portable wireless device.<br />
Many transit websites allow schedules, route maps, stop information, and system updates to<br />
be downloaded directly to a portable device such as a PDA, cell phone, or Apple iPOD.<br />
Agencies with GPS equipped vehicles and wireless transmittal technology also offer NextBus<br />
technology that provides real-time information of bus and rail cars location to the user in the<br />
field via their wireless device.<br />
A wide range of functionality exists between the various ways agencies provide this tool.<br />
Although <strong>METRO</strong> currently does not posses the GPS technology required for many of<br />
these web-based tools to exist, it should be a future goal of the agency. The more<br />
sophisticated websites use NextBus technology which provides up to the minute<br />
information showing where a current bus is located along its route and when it is anticipated<br />
to arrive at a specified stop. Less sophisticated tools simply provide the user with a screen<br />
shot of their vehicle monitoring screen which shows the location of all the vehicles within<br />
the system. The updating properties are based upon the specified refresh rate of the webbased<br />
application. (more info on cost etc.)<br />
4. Design for the <strong>METRO</strong> user. <strong>METRO</strong>’s passenger profile data from the recent fixed<br />
route on-board survey shows that nearly half of passengers using the system are between the<br />
ages of 18-23. These ages tend to rely on the Internet for their primary source of<br />
information and media. Enhancements to the current site will be appreciated by these users.<br />
Although many of the current users may be computer/Internet savvy, the site should also<br />
accommodate those who are not as familiar with the internet including the elderly<br />
population and/or speak Spanish as their primary language. To meet the needs of these<br />
users, the website’s interface should be relatively simple and intuitive. Text, icons, and<br />
hyperlinks should be legible and simple to read. The site, or another form of the site, should<br />
also be available in Spanish for those who do not speak English as their primarily language.<br />
(ask UCSC and Cabrillo students for ideas? Can any of tech stuff be done by UCSC??)<br />
5. Provide schedules and maps that are user-friendly. Due to the high demand of<br />
schedules and map information on transit agency websites, their presentation on the website<br />
should be carefully designed. As stated earlier, the link to their location should be given<br />
priority on the home page and may even warrant a separate link outside the standard<br />
navigation bar.<br />
The formatting of maps and schedules should be provided in both html and pdf formats.<br />
The html format loads quicker and should be the default setting for the website. The pdf<br />
format allows the maps and schedules to be formatted to a printable version and allows<br />
additional functionality provided by the third party (Adobe) software such as zooming<br />
capabilities.<br />
The website’s maps should be easy to use and provide the user with reference points to<br />
assist in the legibility. Displaying the major roadway network, local streets which the route<br />
operates on, adjacent routes, all designated stops (either on the map or in a list), transfer<br />
locations, and major landmarks to orient the rider of the routes location should be a goals of<br />
these maps.<br />
101015<br />
SANTA CRUZ <strong>METRO</strong> SRTP<br />
Page C - 8<br />
WILBUR SMITH ASSOCIATES
APPENDIX C: <strong>METRO</strong> WEBSITE REVIEW<br />
MARKETING<br />
The website should be used as a tool for <strong>METRO</strong> in its pursuit to recruiting and retaining transit<br />
users. The interface design and site functionality recommendations will give <strong>METRO</strong> a website that<br />
meets the needs of the transit user. The marketing component of this tool will help increase it<br />
exposure and use. The following recommendations were collected from the background reference<br />
materials listed above and should be considered by <strong>METRO</strong>.<br />
1. Advertise the site. The website URL address should be included on all marketing material<br />
and displayed alongside the mailing address in the agencies contact information. This<br />
address could also be displayed on the agency’s vehicles, fare medium, and schedules/system<br />
map. (example)<br />
2. Link the site. <strong>METRO</strong> should create links to complimentary sites including regional transit<br />
providers, higher learning institution, car-share vendors, and tourist-related websites in <strong>Santa</strong><br />
<strong>Cruz</strong> and the greater service area. An effort should then be made to have these outside<br />
website include <strong>METRO</strong>’s link on their website.<br />
3. Meet the needs of special user groups. <strong>METRO</strong> should consider design special features<br />
into the website that addresses the specific needs of certain user groups such as college<br />
students, tourists, and over the hill commuters.and disability community – aren’t there<br />
standards for disability comm users?/)These pages can provide these users with specific<br />
resources that will help them plan their trip with <strong>METRO</strong> and increase ridership<br />
systemwide.<br />
101015<br />
SANTA CRUZ <strong>METRO</strong> SRTP<br />
Page C - 9<br />
WILBUR SMITH ASSOCIATES
APPENDIX C: <strong>METRO</strong> WEBSITE REVIEW<br />
US DOT INTELLIGENT TRANSPORTATION SYSTEMS HANDBOOK<br />
RECOMMENDATIONS FOR TRANSIT WEBSITE DEVELOPMENT<br />
Available online at: www.its.dot.gov/transit_dev/guidelines/main.asp<br />
STRUCTURE AND CONTENT<br />
□<br />
□<br />
Item<br />
Information on where and when service is provided is grouped together and subdivided as<br />
Itinerary Maker, System Map, Route Maps, Schedules, and Place Directory<br />
Each of these may be on different pages and use different menu items, but they should still<br />
be near each other.<br />
System Map is provided.<br />
Not necessary for transit systems with one or less scheduled routes.<br />
Itinerary maker or place directory provided.<br />
An itinerary maker displays an itinerary using information obtained through an electronic form<br />
for origin, destination, and times.<br />
□<br />
A place directory is a list of all places (e.g., streets) in the service region with the routes that<br />
serve them. An itinerary maker is preferred but tends to be more expensive.<br />
Not necessary for transit systems with one or fewer scheduled routes.<br />
All route-specific information together organized by route.<br />
All transit systems with scheduled routes should have schedules (timetables) on the site.<br />
Any routes with more than two stops should have a route map on the site.<br />
□<br />
May also include:<br />
• Descriptions of each stop including its exact location, map (e.g., of a large station),<br />
parking availability, bicycle or pedestrian access, and accessibility.<br />
• The real-time state of elements of the transit system, such as the location of each<br />
train, or the estimated time for the next bus at a particular stop. As long as the<br />
resulting page is not too long, the route map, schedule, and other route information<br />
may all be one page.<br />
□<br />
Information across modes grouped together.<br />
For example, the site should not be divided into bus and subway service.<br />
101015<br />
SANTA CRUZ <strong>METRO</strong> SRTP<br />
Page C - 10<br />
WILBUR SMITH ASSOCIATES
APPENDIX C: <strong>METRO</strong> WEBSITE REVIEW<br />
Item<br />
Information about fares grouped together.<br />
As applicable for the transit system, this should include:<br />
• Cost information<br />
• Available discounts including details of any limitations.<br />
• Transfer policies.<br />
□<br />
• Available types of fare media.<br />
• Payment options, both when paying on the transit vehicle and when purchasing fare<br />
media.<br />
• Locations where fare media can be purchased.<br />
May include a capability to purchase fare media on line.<br />
Explicitly say that the fare is free if that is the case<br />
Rules, policies, regulations, and tips for transit customers all grouped together.<br />
This should include:<br />
□<br />
• Policies and regulations for using the service.<br />
• Advice and explanations on using it (e.g., how to read a schedule, how to signal a<br />
bus, dates when service is attenuated or suspended, places or procedures to get<br />
printed copies of maps and schedules).<br />
Accessibility information grouped together.<br />
This includes any demand-response service provided to the disabled or elderly. If such<br />
service is provided, the site should provide:<br />
• Geographic region serviced, and times and dates provided.<br />
□<br />
• Qualifications a customer must possess to qualify for service, including detail on<br />
any documentation the customer must provide.<br />
• The application procedure a customer follows to seek approval to use service. May<br />
include contact information and application forms for downloading or on-line<br />
submittal.<br />
The site may also provide an explanation or feature for requesting service for a particular trip,<br />
including a means to check and cancel requests. An on-line request feature typically needs<br />
101015<br />
SANTA CRUZ <strong>METRO</strong> SRTP<br />
Page C - 11<br />
WILBUR SMITH ASSOCIATES
APPENDIX C: <strong>METRO</strong> WEBSITE REVIEW<br />
Item<br />
to be provided in a secure portion of the site.<br />
All business and administration information grouped together.<br />
This should include:<br />
• Employment opportunities in the transit system, the procedure for applying, and any<br />
necessary contact information.<br />
• Likewise for contracting opportunities.<br />
• Announcements of public meetings.<br />
This part of the site may also include:<br />
□<br />
• Press releases and general announcements other than those immediately affecting<br />
trip planning (e.g., appointment of new personnel, approval of a new budget, start of<br />
new construction, purchase of new vehicles).<br />
• Management, personnel, and institutions charged with operating the transit system.<br />
• History of the transit system.<br />
• Operating statistics of the transit system (e.g., average riders per day, annual<br />
budget).<br />
None of this information should be on the home page, and the link for this information should<br />
not be on the menu.<br />
Contact Information grouped together.<br />
□<br />
This includes phone numbers, email, and physical mail addresses for comments,<br />
compliments, complaints, or questions about the transit service or the web site.<br />
All web sites should at least have a telephone number.<br />
The following content is also recommended:<br />
• Rider alerts that immediately affect trip planning, such as permanent or transitory changes in<br />
schedules, routes, or fares.<br />
• Search feature that lists links to all pages that contain user-entered words (recommended if<br />
over 100 pages in the site).<br />
• Site index or outline of links to all pages in the site (recommended if over 20 pages in the<br />
site).<br />
101015<br />
SANTA CRUZ <strong>METRO</strong> SRTP<br />
Page C - 12<br />
WILBUR SMITH ASSOCIATES
APPENDIX C: <strong>METRO</strong> WEBSITE REVIEW<br />
• Links to web sites likely of interested to transit system customers. These includes sites for<br />
o Other transit systems in the same area.<br />
o Intercity train or bus terminals.<br />
o Airports.<br />
o Ferry services.<br />
o Traffic information.<br />
Riders may also appreciate links to common destinations such as schools, universities, parks,<br />
sports arenas, or tourist attractions.<br />
Some transit web sites also choose to have a "Kid's Zone" with games, quizzes, and facts aimed at<br />
young children.<br />
Menu and Labels<br />
Item<br />
A menu is provided for accessing the site's most used information for trip planning.<br />
□<br />
Typically, the menu includes links for Home, the Itinerary Maker, System Map ("Complete<br />
Map"), Route Maps, Schedules, Place Directory, Fares, Rules and Tips, and Contact<br />
Information.<br />
It generally does not include links to administrative information or to demand response<br />
services (when scheduled services are provided).<br />
□<br />
□<br />
□<br />
□<br />
□<br />
□<br />
The menu is on all pages.<br />
It is placed either at the top or along the left side of the page.<br />
A selected menu item looks different than a menu item you are pointing to.<br />
Link to the home page is in upper left corner of every page.<br />
The logo of the transit system is often effective for this.<br />
Itinerary maker labeled as "Itinerary Maker," with an icon of a list coming from a computer.<br />
The System Map is identified as "Complete Map," with an icon of a paper system map.<br />
The term "system map" should never appear anywhere in the site.<br />
Route information labeled "Routes" along with an icon of a single solid arrow following a<br />
path.<br />
Pages that show only the route map without a schedule should be labeled "Route Maps."<br />
101015<br />
SANTA CRUZ <strong>METRO</strong> SRTP<br />
Page C - 13<br />
WILBUR SMITH ASSOCIATES
APPENDIX C: <strong>METRO</strong> WEBSITE REVIEW<br />
□<br />
□<br />
□<br />
□<br />
□<br />
Item<br />
Schedules labeled as "Schedules" or "Timetables," with an icon of a clock face.<br />
Use either "schedule" or "timetable" consistently throughout your site.<br />
Place directory labeled as " Directory" with an icon of a signs pointing<br />
directions to places.<br />
For example, a directory of streets would be labeled "Street Directory."<br />
Fare information labeled as "Fares," with an icon of a dollar sign.<br />
Rules and tips labeled as "Rules & Tips" with an icon of the international "No" symbol.<br />
Contact information labeled as "Contact Us", with an icon of a telephone handset.<br />
The other content is labeled as follows:<br />
• "Special Services": Services for the elderly and disabled.<br />
• "About Us": Administrative information.<br />
• "Rider Alerts": Changes to routes or fares<br />
□<br />
• "Kid Zone": Content for young children.<br />
• "Site Directory": Site index.<br />
• "Links": Link lists.<br />
These should be links on the home page, not on the menu for every page.<br />
101015<br />
SANTA CRUZ <strong>METRO</strong> SRTP<br />
Page C - 14<br />
WILBUR SMITH ASSOCIATES
APPENDIX C: <strong>METRO</strong> WEBSITE REVIEW<br />
ALL PAGES<br />
To expedite the evaluation, these items may be checked while also checking the home page, itinerary<br />
planner, maps, schedules, and place directory using the subsequent items for those Specific Pages.<br />
□<br />
□<br />
Item<br />
Place information collections on moderately sized pages.<br />
As a rough rule, no page should be longer than about 30 brief paragraphs.<br />
Location of the page in the site is indicated.<br />
For example, a heading shows the section and sub-section the page is in.<br />
You can link to a more general page.<br />
□<br />
□<br />
□<br />
□<br />
□<br />
□<br />
□<br />
□<br />
□<br />
□<br />
□<br />
□<br />
□<br />
□<br />
□<br />
□<br />
For example, you can link up from a particular schedule to a list of all schedules without<br />
using the Back button.<br />
When at the bottom of the page, you can link to site's main areas without scrolling.<br />
The "main areas" are the same as those linked with the menu.<br />
Title bar title is the transit system name followed by page label.<br />
Each page has a uniquely displayed title bar title and URL.<br />
Pages are easily read on a 600x800 screen.<br />
Page completely downloads in 10 seconds or less when using a dial-up modem.<br />
Flash, Acrobat (PDF), and other plug-ins are only used when absolutely necessary.<br />
Large amounts of text are neatly broken up and labeled.<br />
Most important and general information is first on the page.<br />
A balance of emphasis visually indicates the page structure.<br />
Color, boldness, and size of letters makes the outline of the page clear.<br />
Page produces interpretable printouts.<br />
For example, tables are not cropped when printed.<br />
Page is free of technical errors.<br />
For example, no "page cannot be found " or other error messages<br />
All text strongly contrasts with background colors.<br />
Background graphics or colors limited use, size, and intensity.<br />
Graphics content is as simple as possible.<br />
All words are text not graphics.<br />
101015<br />
SANTA CRUZ <strong>METRO</strong> SRTP<br />
Page C - 15<br />
WILBUR SMITH ASSOCIATES
APPENDIX C: <strong>METRO</strong> WEBSITE REVIEW<br />
Item<br />
You should be able to select and copy any word.<br />
□<br />
□<br />
No animation and other moving imagery.<br />
All text is large and easy to read including text in maps and other graphics.<br />
All normal text should be at least this large.<br />
This is too small<br />
□<br />
□<br />
□<br />
□<br />
□<br />
□<br />
□<br />
□<br />
All text is mixed case not ALL CAPITALS.<br />
Lists sorted to make scanning as fast as possible.<br />
Text communicates key information with the fewest words.<br />
Links are only to frequently needed pages for the current page.<br />
Any information referred in the page should be linked.<br />
Links and only links use underlining and a specific color.<br />
All links should be one color, and that color should not be used for any other text.<br />
You can tell what you are selecting when using a link in a graphic<br />
Each link labeled with the specific name of its destination.<br />
For example, no links labeled "Next" or "Top of Page."<br />
It is clear when a link goes to another site.<br />
SPECIFIC PAGES<br />
Home Page<br />
Item<br />
Home page fully utilized to provide information and links useful for trip planning.<br />
□<br />
A home page should not be dominated by decorative graphics or marketing language.<br />
□<br />
□<br />
□<br />
□<br />
<strong>Transit</strong> system and region served clearly identified.<br />
Links provided, as applicable, for Special Services, Administration ("About Us"), Children's<br />
Section ("Kid Zone"), the Site Directory, and link lists.<br />
Information such as this should be accessed from the home page, not the menu used on<br />
every page.<br />
Any specific schedule can be accessed in two clicks or less.<br />
Rider alerts are shown on the home page as headlines with date, affected route(s), and<br />
brief summary of the change.<br />
101015<br />
SANTA CRUZ <strong>METRO</strong> SRTP<br />
Page C - 16<br />
WILBUR SMITH ASSOCIATES
APPENDIX C: <strong>METRO</strong> WEBSITE REVIEW<br />
A single "Rider Alert" link to a page of such headlines is not sufficient<br />
Maps<br />
To expedite the evaluation, you can check just two or three representative route maps.<br />
Item<br />
Map images must not be too large to view on a 800x600 screen or download in less than 10<br />
seconds, but text and symbols must not be too small to be easily legible<br />
□<br />
□<br />
□<br />
□<br />
□<br />
□<br />
□<br />
□<br />
□<br />
In most transit systems, a low-detail summarizing map of the entire system links to<br />
progressively more detailed maps until stops can be shown, but simple transit systems may<br />
be able to have a single reasonably-sized and readable map of the system that has enough<br />
detail.<br />
All maps have North up.<br />
Each map includes significant roads, places, and other features to indicate scale and<br />
location.<br />
For example, it is not sufficient to show only the portions of roads on which a bus operates.<br />
Routes on system maps are distinguishable by being shown in different shades and colors.<br />
Maps include a legend showing how routes are represented.<br />
Clicking a map shows more detail at the place you clicked.<br />
You can move among maps geographically laterally.<br />
For example, when a detailed system map is divided among pages, links on each page take<br />
you to adjacent map pieces<br />
The effect of clicking on a map is indicated somehow.<br />
With each route map, there is a consistently structured text description of the route.<br />
Itinerary Maker<br />
Item<br />
□ The electronic form includes instructions, examples, and specific control labels.<br />
Ambiguous or imprecise locations are handled effectively.<br />
□<br />
For example, the itinerary planner lists the best matches of a location entered by a user.<br />
□<br />
□<br />
□<br />
The Results page shows the itinerary planner's interpretation of your input.<br />
Multiple alternative itineraries are generated that all approximately fit your input.<br />
The steps of an itinerary are in chronological order.<br />
101015<br />
SANTA CRUZ <strong>METRO</strong> SRTP<br />
Page C - 17<br />
WILBUR SMITH ASSOCIATES
APPENDIX C: <strong>METRO</strong> WEBSITE REVIEW<br />
Schedules<br />
To expedite the evaluation, you can check just two or three representative routes.<br />
Item<br />
□<br />
Rider alert links or information is shown for the schedule they apply to.<br />
Such a link or information should only be for an alert that pertains to the displayed schedule<br />
□<br />
□<br />
□<br />
□<br />
□<br />
□<br />
There is no more than one link between a route's schedule and map.<br />
There is no more than one link between a route's schedule and fare information that<br />
pertains to that route.<br />
A guide for how to read the schedule (or a link to such a guide) is provided from the<br />
schedule page<br />
Schedules are compact but legible.<br />
For example, column headers should not stretch the table out unnecessarily.<br />
Table column headers are always in view when the schedule is shown on a 800x600 screen.<br />
You should not have to scroll up to see what stop a particular time is for.<br />
Approximately every fifth table row has a divider.<br />
Every row should not have a rule.<br />
Place Directory<br />
Item<br />
Place directory is an alphabetically sorted list of places of the same type as the stops.<br />
□<br />
For example, a bus route with stops along the street has a list of streets, while a commuter<br />
rail route with stops in various outlying towns has a list of towns.<br />
All major geographic places in the service region are included in the list.<br />
□<br />
□<br />
The list is not limited to places the routes travel on or stop at. For a street directory, the street<br />
index of a commercially available map of your region is a good approximation of the<br />
necessary content of a street index.<br />
Places that may be referred to by more than one name are listed under all such names.<br />
For example, North Maple St. is found under both "North Maple" and "Maple, North."<br />
Places served by more than one route list each route distinctly.<br />
□<br />
Indicate how each route serves the place differently (e.g., one train is an express, or bus is<br />
best for Maple St between 14th and 18th Ave. only).<br />
101015<br />
SANTA CRUZ <strong>METRO</strong> SRTP<br />
Page C - 18<br />
WILBUR SMITH ASSOCIATES
APPENDIX C: <strong>METRO</strong> WEBSITE REVIEW<br />
A concise description of key features of the transit system structure is given.<br />
□<br />
This should include information useful for narrowing down the choice of routes, especially for<br />
users that cannot use a system map.<br />
101015<br />
SANTA CRUZ <strong>METRO</strong> SRTP<br />
Page C - 19<br />
WILBUR SMITH ASSOCIATES
APPENDIX C: <strong>METRO</strong> WEBSITE REVIEW<br />
<strong>METRO</strong> WEBSITE SURVEY RESULTS<br />
What is the primary reason that you visite <strong>METRO</strong>'s online web site today?<br />
70%<br />
64%<br />
60%<br />
Percent of Responses<br />
50%<br />
40%<br />
30%<br />
20%<br />
17%<br />
To find Metro BUS Schedule Information<br />
10%<br />
7% 5%<br />
3%<br />
0% 1% 2%<br />
0%<br />
To Find Out About Bus Fares<br />
To View a Map of a Bus Route<br />
To Contact <strong>METRO</strong> Personnel<br />
To Learn to Ride Metro Buses<br />
To Find Information on Metro Special Services<br />
Response<br />
Just Browsing<br />
Other<br />
About how many times have you visited <strong>METRO</strong> online?<br />
50%<br />
45%<br />
45%<br />
40%<br />
35%<br />
Percent of Responses<br />
30%<br />
25%<br />
20%<br />
20%<br />
15%<br />
13% 13%<br />
10%<br />
10%<br />
5%<br />
0%<br />
2 or 3 times<br />
4 or 5 times<br />
6 to 10 times<br />
More than 10 times<br />
This is my first time<br />
Response<br />
101015<br />
SANTA CRUZ <strong>METRO</strong> SRTP<br />
WILBUR SMITH ASSOCIATES<br />
Page C - 20
APPENDIX C: <strong>METRO</strong> WEBSITE REVIEW<br />
Compared to other web sites that you visit, did you find it easy of difficult to navigate through<br />
<strong>METRO</strong>'s web site to the information that you wanted?<br />
45%<br />
42%<br />
40%<br />
35%<br />
Percent of Responses<br />
30%<br />
25%<br />
20%<br />
15%<br />
10%<br />
22%<br />
17%<br />
12%<br />
7%<br />
5%<br />
0%<br />
Much Easier than Most Web Sites<br />
Easier Than Most Web Sites<br />
Response<br />
About Average<br />
More Difficult than Most Web Sites<br />
Much More Difficult Than Most Web Sites<br />
While navigating through the <strong>METRO</strong> web site, how fast and responsive did you find it?<br />
80%<br />
70%<br />
72%<br />
Percent of Responses<br />
60%<br />
50%<br />
40%<br />
30%<br />
20%<br />
27%<br />
10%<br />
0%<br />
0% 1%<br />
Pages Loaded Quickly<br />
Pages Loaded with Average Speed<br />
Pages Loaded Too Slowly<br />
Response<br />
Blank<br />
101015<br />
SANTA CRUZ <strong>METRO</strong> SRTP<br />
Page C - 21<br />
WILBUR SMITH ASSOCIATES
APPENDIX C: <strong>METRO</strong> WEBSITE REVIEW<br />
Have you ever ridden a <strong>METRO</strong> bus?<br />
12%<br />
NO<br />
YES<br />
87%<br />
Have you ever used the information from <strong>METRO</strong>'s web site to plan a trip on a <strong>METRO</strong> bus?<br />
22%<br />
NO<br />
YES<br />
73%<br />
101015<br />
SANTA CRUZ <strong>METRO</strong> SRTP<br />
Page C - 22<br />
WILBUR SMITH ASSOCIATES
APPENDIX C: <strong>METRO</strong> WEBSITE REVIEW<br />
If you have used the <strong>METRO</strong> web site to plan a trip, how accurate was the information<br />
provided?<br />
70%<br />
60%<br />
59%<br />
Percent of Responses<br />
50%<br />
40%<br />
30%<br />
20%<br />
41%<br />
10%<br />
0%<br />
0%<br />
Very Accurate<br />
Somewhat Accurate<br />
Not at all Accurate<br />
Response<br />
If you have used the <strong>METRO</strong> web site to plan a trip, will you use it again for trip planning?<br />
60%<br />
50%<br />
50%<br />
Percent of Responses<br />
40%<br />
30%<br />
20%<br />
33%<br />
13%<br />
10%<br />
1%<br />
3%<br />
0%<br />
Defiantly Yes<br />
Probably Yes<br />
Not Sure or Undecided<br />
Probably No<br />
Defiantly No<br />
Response<br />
101015<br />
SANTA CRUZ <strong>METRO</strong> SRTP<br />
Page C - 23<br />
WILBUR SMITH ASSOCIATES
APPENDIX C: <strong>METRO</strong> WEBSITE REVIEW<br />
How useful was the following source of information on the <strong>METRO</strong> website?<br />
"Print Your Own Schedule"<br />
45%<br />
40%<br />
35%<br />
35%<br />
41%<br />
Percent of Responses<br />
30%<br />
25%<br />
20%<br />
15%<br />
20%<br />
10%<br />
5%<br />
0%<br />
1%<br />
3%<br />
Did Not Use This Feature<br />
Not at all Useful<br />
Not Very Useful<br />
Response<br />
Somewhat Useful<br />
Very Useful<br />
How useful was the following source of information on the <strong>METRO</strong> website?<br />
"How To Ride Information"<br />
45%<br />
40%<br />
41%<br />
35%<br />
Percent of Responses<br />
30%<br />
25%<br />
20%<br />
15%<br />
21%<br />
28%<br />
10%<br />
9%<br />
5%<br />
1%<br />
0%<br />
Did Not Use This Feature<br />
Not at all Useful<br />
Not Very Useful<br />
Response<br />
Somewhat Useful<br />
Very Useful<br />
101015<br />
SANTA CRUZ <strong>METRO</strong> SRTP<br />
Page C - 24<br />
WILBUR SMITH ASSOCIATES
APPENDIX C: <strong>METRO</strong> WEBSITE REVIEW<br />
How useful was the following source of information on the <strong>METRO</strong> website?<br />
"Fares Information"<br />
50%<br />
45%<br />
44%<br />
40%<br />
Percent of Responses<br />
35%<br />
30%<br />
25%<br />
20%<br />
15%<br />
22%<br />
32%<br />
10%<br />
5%<br />
1% 1%<br />
0%<br />
Did Not Use This Feature<br />
Not at all Useful<br />
Not Very Useful<br />
Response<br />
Somewhat Useful<br />
Very Useful<br />
How useful was the following source of information on the <strong>METRO</strong> website?<br />
"<strong>METRO</strong> News"<br />
60%<br />
50%<br />
48%<br />
Percent of Responses<br />
40%<br />
30%<br />
20%<br />
26%<br />
21%<br />
10%<br />
3% 3%<br />
0%<br />
Did Not Use This Feature<br />
Not at all Useful<br />
Not Very Useful<br />
Response<br />
Somewhat Useful<br />
Very Useful<br />
101015<br />
SANTA CRUZ <strong>METRO</strong> SRTP<br />
Page C - 25<br />
WILBUR SMITH ASSOCIATES
APPENDIX C: <strong>METRO</strong> WEBSITE REVIEW<br />
If you've never ridden a <strong>METRO</strong> bus, does the presence of <strong>METRO</strong> information on the web<br />
increase the likelihood that you will ride <strong>METRO</strong> buses?<br />
33%<br />
NO<br />
YES<br />
67%<br />
How useful did you find the following source of information not relating to bus service on the<br />
<strong>METRO</strong> website?<br />
"Tell Us Customer Service Report"<br />
60%<br />
50%<br />
51%<br />
Percent of Responses<br />
40%<br />
30%<br />
20%<br />
24%<br />
16%<br />
10%<br />
5%<br />
4%<br />
0%<br />
Did Not Use This Feature<br />
Not at all Useful<br />
Not Very Useful<br />
Response<br />
Somewhat Useful<br />
Very Useful<br />
101015<br />
SANTA CRUZ <strong>METRO</strong> SRTP<br />
Page C - 26<br />
WILBUR SMITH ASSOCIATES
APPENDIX C: <strong>METRO</strong> WEBSITE REVIEW<br />
How useful did you find the following source of information not relating to bus service on the<br />
<strong>METRO</strong> website?<br />
"Jobs Page"<br />
80%<br />
70%<br />
71%<br />
60%<br />
Percent of Responses<br />
50%<br />
40%<br />
30%<br />
20%<br />
10%<br />
0%<br />
1%<br />
6%<br />
10%<br />
12%<br />
Did Not Use This Feature<br />
Not at all Useful<br />
Not Very Useful<br />
Response<br />
Somewhat Useful<br />
Very Useful<br />
How useful did you find the following source of information not relating to bus service on the<br />
<strong>METRO</strong> website?<br />
"Bid Page"<br />
90%<br />
80%<br />
79%<br />
70%<br />
Percent of Responses<br />
60%<br />
50%<br />
40%<br />
30%<br />
20%<br />
10%<br />
2%<br />
5% 5%<br />
10%<br />
0%<br />
Did Not Use This Feature<br />
Not at all Useful<br />
Not Very Useful<br />
Response<br />
Somewhat Useful<br />
Very Useful<br />
101015<br />
SANTA CRUZ <strong>METRO</strong> SRTP<br />
Page C - 27<br />
WILBUR SMITH ASSOCIATES
APPENDIX C: <strong>METRO</strong> WEBSITE REVIEW<br />
How useful did you find the following source of information not relating to bus service on the<br />
<strong>METRO</strong> website?<br />
"Board Minutes"<br />
70%<br />
67%<br />
60%<br />
Percent of Responses<br />
50%<br />
40%<br />
30%<br />
20%<br />
10%<br />
2%<br />
7%<br />
11%<br />
13%<br />
0%<br />
Did Not Use This Feature<br />
Not at all Useful<br />
Not Very Useful<br />
Response<br />
Somewhat Useful<br />
Very Useful<br />
Do you plan to visit the <strong>METRO</strong> web site again?<br />
8%<br />
NO<br />
YES<br />
92%<br />
101015<br />
SANTA CRUZ <strong>METRO</strong> SRTP<br />
Page C - 28<br />
WILBUR SMITH ASSOCIATES
APPENDIX C: <strong>METRO</strong> WEBSITE REVIEW<br />
At work or school, do you have access to a computer linked to the internet?<br />
13%<br />
NO<br />
YES<br />
88%<br />
At home, do you have access to a computer linked to the internet?<br />
9%<br />
NO<br />
YES<br />
91%<br />
101015<br />
SANTA CRUZ <strong>METRO</strong> SRTP<br />
Page C - 29<br />
WILBUR SMITH ASSOCIATES
APPENDIX C: <strong>METRO</strong> WEBSITE REVIEW<br />
Are you?<br />
60%<br />
57%<br />
50%<br />
43%<br />
Percent of Responses<br />
40%<br />
30%<br />
20%<br />
10%<br />
0%<br />
Male<br />
Response<br />
Female<br />
What is your age?<br />
30%<br />
25%<br />
25%<br />
26%<br />
23%<br />
Percent of Responses<br />
20%<br />
15%<br />
10%<br />
11%<br />
9%<br />
5%<br />
3%<br />
3%<br />
0%<br />
Less than 18<br />
18 to 25<br />
26 to 35<br />
36 to 45<br />
Response<br />
46 to 55<br />
56 to 65<br />
More than 65<br />
101015<br />
SANTA CRUZ <strong>METRO</strong> SRTP<br />
Page C - 30<br />
WILBUR SMITH ASSOCIATES
APPENDIX C: <strong>METRO</strong> WEBSITE REVIEW<br />
Where do you live?<br />
50%<br />
45%<br />
45%<br />
40%<br />
Percent of Responses<br />
35%<br />
30%<br />
25%<br />
20%<br />
15%<br />
11%<br />
23%<br />
17%<br />
10%<br />
5%<br />
0%<br />
2%<br />
1%<br />
<strong>Santa</strong> <strong>Cruz</strong><br />
Watsonville<br />
Capitola<br />
Response<br />
Scotts Valley<br />
Other <strong>Santa</strong> <strong>Cruz</strong><br />
Outside of <strong>Santa</strong> <strong>Cruz</strong> County<br />
101015<br />
SANTA CRUZ <strong>METRO</strong> SRTP<br />
Page C - 31<br />
WILBUR SMITH ASSOCIATES
APPENDIX C: <strong>METRO</strong> WEBSITE REVIEW<br />
EXAMPLE WEBSITES<br />
There are a number of transit websites that have developed pages that achieve many of the<br />
recommendations listed above for <strong>METRO</strong>. The FTA and <strong>METRO</strong> magazine both have programs<br />
that recognize best examples of transit websites. These site can be used a model for <strong>METRO</strong> in<br />
updating/developing their current site.<br />
<strong>Santa</strong> Monica Big Blue Bus<br />
www.bigbluebus.com<br />
Portland Streetcar<br />
www.portlandstreetcar.org<br />
<strong>Santa</strong> Clara Valley Transportation Authority (VTA)<br />
www.vta.org<br />
San Francisco Municipal Railways (MUNI)<br />
www.sfmuni.com<br />
Omnitrans (San Bernardino County <strong>Transit</strong>)<br />
www.omnitrans.org<br />
Massachusetts Bay Transportation Authority<br />
www.mbta.com<br />
101015<br />
SANTA CRUZ <strong>METRO</strong> SRTP<br />
Page C - 32<br />
WILBUR SMITH ASSOCIATES
APPENDIX C: <strong>METRO</strong> WEBSITE REVIEW<br />
101015<br />
SANTA CRUZ <strong>METRO</strong> SRTP<br />
Page C - 33<br />
WILBUR SMITH ASSOCIATES
APPENDIX C: <strong>METRO</strong> WEBSITE REVIEW<br />
2<br />
101015<br />
SANTA CRUZ <strong>METRO</strong> SRTP<br />
Page C - 34<br />
WILBUR SMITH ASSOCIATES
APPENDIX C: <strong>METRO</strong> WEBSITE REVIEW<br />
101015<br />
SANTA CRUZ <strong>METRO</strong> SRTP<br />
Page C - 35<br />
WILBUR SMITH ASSOCIATES
101015<br />
SANTA CRUZ SHORT RANGE TRANSIT PLAN WILBUR SMITH ASSOCIATES<br />
Page C - 36
APPENDIX C: <strong>METRO</strong> WEBSITE REVIEW<br />
101015<br />
SANTA CRUZ SHORT RANGE TRANSIT PLAN WILBUR SMITH ASSOCIATES<br />
Page C - 37
APPENDIX C: <strong>METRO</strong> WEBSITE REVIEW<br />
101015<br />
SANTA CRUZ SHORT RANGE TRANSIT PLAN WILBUR SMITH ASSOCIATES<br />
Page C - 38
APPENDIX D: OUTREACH RESULTS<br />
STAKEHOLDER INTERVIEWS<br />
The WSA team conducted the majority of stakeholder interviews during the 2nd week of January, 2007.<br />
Follow up interviews with remaining stakeholders were conducted in February and March 2007. These<br />
interviews were conducted with a number of stakeholder including elected officials, regional and<br />
community agencies, local business community, educational institutions, and MAC members. Table A-1<br />
shows the stakeholders who were identified by <strong>METRO</strong> and were available to be interviewed as part of this<br />
outreach effort. Our understanding with each of the stakeholders interviewed was that their individual<br />
responses would be confidential, but that we would include all of the important comments as part of an<br />
overall evaluation.<br />
Table A-1: Interviewed Stakeholders<br />
Organization Name Title<br />
City of <strong>Santa</strong> <strong>Cruz</strong> Mark Dettle Public Works Director<br />
City of <strong>Santa</strong> <strong>Cruz</strong> Jim Burr Transportation Manager<br />
City of <strong>Santa</strong> <strong>Cruz</strong> Matt Farrell Parking Program Manager<br />
City of <strong>Santa</strong> <strong>Cruz</strong> Emily Reilly Mayor, <strong>METRO</strong> Board Member & BRT<br />
Committee<br />
City of Watsonville Marcela Tavantzis Assistant City Manager, <strong>METRO</strong> Board<br />
City of Capitola Steve Jesberg Public Works Director<br />
City of Capitola Michael Termini Mayor<br />
City of Scotts Valley Ken Anderson Public Work Director<br />
UCSC Larry Pageler Co-Director, TAPS<br />
UCSC Donna Blitzer Director, Government & Community Relations<br />
Appointed Ex-Officio on <strong>METRO</strong> Board<br />
Cabrillo College Manuel Osorio Vice President, Student Services<br />
Cabrillo College Brian King President<br />
SCCRTC George Dondero Executive Director<br />
AMBAG Todd Muck <strong>Plan</strong>ner<br />
TMA Ginny Johnson TMA Board of Directors<br />
<strong>Santa</strong> <strong>Cruz</strong> Chamber of Bill Tysseling<br />
Executive Director<br />
Commerce<br />
MAC Naomi Gunther Board Member, appointed<br />
MAC Paul Marcelin-Sampson Board Member, appointed<br />
TFTF Fred Keeley Facilitator<br />
Seaside Joann Dlott Ocean Beach Developer (Parking Lots)<br />
Survey Results<br />
The results of the stakeholder interviews were recorded and organized into the four general categories, as<br />
presented below.<br />
Extended/Long Distance Service<br />
Highway 17 service is particularly well received and viewed as an important component of the <strong>METRO</strong><br />
family of services. There was some discussion regarding improved connections to access the San Jose<br />
101015<br />
SANTA CRUZ SHORT RANGE TRANSIT PLAN<br />
Page D - 1<br />
WILBUR SMITH ASSOCIATES
APPENDIX D: OUTREACH RESULTS<br />
airport. Long distance service to Watsonville is viewed in general as a good connection, but one with some<br />
opportunity for reduced travel time. Other comments included extending the span of service. There was<br />
some discussion regarding service connections with Scotts Valley and the new Cabrillo College campus.<br />
<strong>Santa</strong> <strong>Cruz</strong> Community<br />
The perception is that most of the service goes to the <strong>METRO</strong> Center and then to the University. There<br />
was some discussion that maybe there were broader community needs which could be met through transit.<br />
These include transportation for the tourists and beach goers in the summer, and service workers.<br />
Other Community<br />
Interest was expressed for more community based services within Watsonville, Capitola, and Scotts Valley.<br />
There was discussion regarding additional access to Cabrillo College on all of its campuses and connections<br />
between Cabrillo and the University.<br />
General Community Issues<br />
Traffic congestion and sustainable financing were the two major points of discussion. There is some<br />
perception that <strong>METRO</strong> has a steady source of revenue through the sales tax and that the Board decision<br />
on the labor contract last year has put the agency in some jeopardy in the future. There is some perception<br />
that the <strong>METRO</strong> staff is spread too thin, with not much time available for planning and outreach. In<br />
general, there was a perception that <strong>METRO</strong> does not do much in the way of advertising or marketing and<br />
therefore not looking to service new potential markets.<br />
In general, there seems to be a potential for <strong>METRO</strong> to get more involved in regional issues and<br />
discussions. There was a desire expressed from many sides to have <strong>METRO</strong> be a participant in some of the<br />
regional conversations.<br />
101015<br />
SANTA CRUZ SHORT RANGE TRANSIT PLAN<br />
Page D - 2<br />
WILBUR SMITH ASSOCIATES
APPENDIX D: OUTREACH RESULTS<br />
ON BOARD SURVEY RESULTS<br />
Figure B-1: Survey Form<br />
101015<br />
SANTA CRUZ SHORT RANGE TRANSIT PLAN<br />
Page D - 3<br />
WILBUR SMITH ASSOCIATES
APPENDIX D: OUTREACH RESULTS<br />
101015<br />
SANTA CRUZ SHORT RANGE TRANSIT PLAN<br />
Page D - 4<br />
WILBUR SMITH ASSOCIATES
APPENDIX D: OUTREACH RESULTS<br />
Questionnaire Results<br />
Q1: Where did you come from on this trip?<br />
# of Responses. % of Total % of Responses<br />
Home 769 40.4% 40.8%<br />
Work 286 15.0% 15.2%<br />
School 458 24.1% 24.3%<br />
Shopping 88 4.6% 4.7%<br />
Visiting friends/family 74 3.9% 3.9%<br />
Medical Appointment 74 3.9% 3.9%<br />
Personal Business 41 2.2% 2.2%<br />
Leisure/Entertainment 58 3.0% 3.1%<br />
Other 36 1.9% 1.9%<br />
No Response 18 0.9% 1.0%<br />
Total 1902 100% 100%<br />
Q2: How did you get from your starting point to the bus you boarded?<br />
# of Responses % of Total % of Responses<br />
Walked 1419 74.6% 77.2%<br />
Drove 68 3.6% 3.7%<br />
Bike 141 7.4% 7.7%<br />
Dropped Off 71 3.7% 3.9%<br />
Taxi 6 0.3% 0.3%<br />
Transferred from Bus 132 6.9% 7.2%<br />
No Response 65 3.4% 3.5%<br />
Total 1902 100.0% 100.0%<br />
Average walking distance is 2.28 blocks<br />
Q3: Where are you going on this trip?<br />
# of Responses % of Total % of Responses<br />
Home 821 43.2% 44.4%<br />
Work 258 13.6% 14.0%<br />
School 371 19.5% 20.1%<br />
Shopping 73 3.8% 4.0%<br />
Visiting friends/family 72 3.8% 3.9%<br />
Medical Appointment 89 4.7% 4.8%<br />
Personal Business 43 2.3% 2.3%<br />
Leisure/Entertainment 85 4.5% 4.6%<br />
Other 36 1.9% 1.9%<br />
No Response 54 2.8% 2.9%<br />
Total 1902 100.0% 100.0%<br />
101015<br />
SANTA CRUZ SHORT RANGE TRANSIT PLAN<br />
Page D - 5<br />
WILBUR SMITH ASSOCIATES
APPENDIX D: OUTREACH RESULTS<br />
Q4: How will you get to your destination from this bus?<br />
# of Responses % of Total % of Responses<br />
Walked 1460 76.8% 80.9%<br />
Drive 49 2.6% 2.7%<br />
Bike 112 5.9% 6.2%<br />
Picked up by someone 35 1.8% 1.9%<br />
Transfer to Metro Route 115 6.0% 6.4%<br />
Other 34 1.8% 1.9%<br />
No Response 97 5.1% 5.4%<br />
Total 1902 100.0% 100.0%<br />
Average walking distance is 2.31 blocks<br />
Q5: How often do you ride the bus?<br />
# of Responses % of Total % of Responses<br />
7 days a week 251 13.2% 15.3%<br />
6 days a week 187 9.8% 11.4%<br />
5 days a week 505 26.6% 30.8%<br />
4 days a week 209 11.0% 12.7%<br />
3 days a week 163 8.6% 9.9%<br />
2 days a week 107 5.6% 6.5%<br />
1 day a week 54 2.8% 3.3%<br />
1 to 5 days per month 28 1.5% 1.7%<br />
6 to 10 days per month 15 0.8% 0.9%<br />
11 to 15 days per month 12 0.6% 0.7%<br />
16 to 20 days per month 20 1.1% 1.2%<br />
21 to 25 days per month 5 0.3% 0.3%<br />
26 to 31 days per month 12 0.6% 0.7%<br />
1 to 10 days per year 10 0.5% 0.6%<br />
11 to 100 days per year 3 0.2% 0.2%<br />
101 to 200 days per year 4 0.2% 0.2%<br />
201 to 365 days per year 7 0.4% 0.4%<br />
Not a regular rider 48 2.5% 2.9%<br />
No Response 262 13.8% 16.0%<br />
Total 1902<br />
101015<br />
SANTA CRUZ SHORT RANGE TRANSIT PLAN<br />
Page D - 6<br />
WILBUR SMITH ASSOCIATES
APPENDIX D: OUTREACH RESULTS<br />
Q6: How did you pay for your ride today?<br />
# of Responses % of Total % of Responses<br />
Monthly Pass 337 17.7% 18.7%<br />
Day Pass 110 5.8% 6.1%<br />
UC Pass 600 31.5% 33.4%<br />
Discount 34 1.8% 1.9%<br />
Cash 473 24.9% 26.3%<br />
5-Day Pass 9 0.5% 0.5%<br />
Cabrillo Pass 199 10.5% 11.1%<br />
Other 36 1.9% 2.0%<br />
No Response 104 5.5% 5.8%<br />
Total 1902 100.0% 100.0%<br />
Q7: For what purposes do you most often use Metro?<br />
# of Responses % of Total % of Responses<br />
Work 668 35.1% 36.1%<br />
School 834 43.8% 45.1%<br />
Shopping 119 6.3% 6.4%<br />
Other 87 4.6% 4.7%<br />
Visiting friends/family 34 1.8% 1.8%<br />
Medical Appointment 31 1.6% 1.7%<br />
Personal Business 41 2.2% 2.2%<br />
Leisure/Entertainment 36 1.9% 1.9%<br />
No Response 52 2.7% 2.8%<br />
Total 1902 100.0% 100.0%<br />
Q8: Do you own a vehicle?<br />
# of Responses % of Total % of Responses<br />
Yes 587 30.9% 32.1%<br />
No 1239 65.1% 67.9%<br />
No Response 76 4.0% 4.2%<br />
Total 1902 100.0% 100.0%<br />
Q9: Do you have access to a vehicle?<br />
# of Responses % of Total % of Responses<br />
Yes 671 35.3% 42.7%<br />
No 901 47.4% 57.3%<br />
No Response 330 17.4% 21.0%<br />
Total 1902 100.0% 100.0%<br />
Q10: Please indicate your gender<br />
# of Responses % of Total % of Responses<br />
Male 877 46.1% 48.3%<br />
Female 937 49.3% 51.7%<br />
No Response 88 4.6% 4.9%<br />
Total 1902 100.0% 100.0%<br />
101015<br />
SANTA CRUZ SHORT RANGE TRANSIT PLAN<br />
Page D - 7<br />
WILBUR SMITH ASSOCIATES
APPENDIX D: OUTREACH RESULTS<br />
Q11: What is your age?<br />
# of Responses % of Total % of Responses<br />
Under 18 151 7.9% 8.8%<br />
18-23 793 41.7% 46.2%<br />
24-35 331 17.4% 19.3%<br />
36-49 205 10.8% 12.0%<br />
50-64 189 9.9% 11.0%<br />
65 and over 46 2.4% 2.7%<br />
No Response 187 9.8% 10.9%<br />
Total 1902 100.0% 100.0%<br />
Q12: Which best describes your employment status?<br />
# of Responses % of Total % of Responses<br />
Employed full-time 449 23.6% 25.2%<br />
Employed part-time 525 27.6% 29.4%<br />
Retired 79 4.2% 4.4%<br />
Not employed 206 10.8% 11.5%<br />
Full-time student 378 19.9% 21.2%<br />
Part-time student 39 2.1% 2.2%<br />
College 85 4.5% 4.8%<br />
High School 24 1.3% 1.3%<br />
No Response 117 6.2% 6.6%<br />
Total 1902 100.0% 100.0%<br />
Q13: What is your yearly household income?<br />
# of Responses % of Total % of Responses<br />
Less than $10,000 698 36.7% 47.5%<br />
$10,000 to $19,999 260 13.7% 17.7%<br />
$20,000 to $29,999 131 6.9% 8.9%<br />
$30,000 to $39,999 97 5.1% 6.6%<br />
$40,000 to $49,999 58 3.0% 3.9%<br />
$50,000 to $59,999 60 3.2% 4.1%<br />
$60,000 to $74,999 42 2.2% 2.9%<br />
$75,000 and over 125 6.6% 8.5%<br />
No Response 431 22.7% 29.3%<br />
Total 1902 100.0% 100.0%<br />
Q14: How would you rate performance on a scale of 1 (unsatisfied) to 5 (very satisfied)<br />
Average<br />
# of Responses Rating*<br />
On time arrivals 1600 3.61<br />
Bus information 1547 4.10<br />
Seat availability 1570 3.72<br />
Bus maintenance 1498 4.17<br />
Service Frequency 1538 3.48<br />
Courtesy of drivers 1533 4.02<br />
Customer service 1417 4.00<br />
Bus cleanliness 1485 4.07<br />
*1=unsatisfied, 5= very satisfied<br />
101015<br />
SANTA CRUZ SHORT RANGE TRANSIT PLAN<br />
Page D - 8<br />
WILBUR SMITH ASSOCIATES
APPENDIX D: OUTREACH RESULTS<br />
ORIGIN-DESTINATION MAPS (BY ORIGIN LOCATION AND TRIP<br />
PURPOSE)<br />
101015<br />
SANTA CRUZ SHORT RANGE TRANSIT PLAN<br />
Page D - 9<br />
WILBUR SMITH ASSOCIATES
APPENDIX D: OUTREACH RESULTS<br />
101015<br />
SANTA CRUZ SHORT RANGE TRANSIT PLAN<br />
Page D - 10<br />
WILBUR SMITH ASSOCIATES
APPENDIX D: OUTREACH RESULTS<br />
101015<br />
SANTA CRUZ SHORT RANGE TRANSIT PLAN<br />
Page D - 11<br />
WILBUR SMITH ASSOCIATES
APPENDIX D: OUTREACH RESULTS<br />
101015<br />
SANTA CRUZ SHORT RANGE TRANSIT PLAN<br />
Page D - 12<br />
WILBUR SMITH ASSOCIATES
101015<br />
SANTA CRUZ SHORT RANGE TRANSIT PLAN WILBUR SMITH ASSOCIATES<br />
Page D - 13
APPENDIX D: OUTREACH RESULTS<br />
BUS DRIVER INTERVIEWS<br />
Wilbur Smith Associates met with the <strong>METRO</strong> bus drivers on May 2, 2007. WSA sent four representatives<br />
(two located in the Operation’s break room, two located in the <strong>METRO</strong> Center break room) to sit down<br />
with drivers and discuss issues they felt were important to include in the <strong>Short</strong> <strong>Range</strong> <strong>Transit</strong> <strong>Plan</strong> process.<br />
The interviewers were equipped with a questionnaire but the drivers were encouraged to discuss any issues<br />
they felt were relative.<br />
Two important ideas were raised:<br />
• An investment by <strong>METRO</strong> in technology to record and measure performance for services would be<br />
beneficial. That way there would be a consistent resource to record information, provide information<br />
to customers and measure and monitor performance. Of particular importance is the ability to record<br />
on time performance. On time performance of services is affected by increasing congestion on major<br />
trunk lines.<br />
• The operators believe that <strong>METRO</strong> service would be enhanced by regular communication forums being<br />
established between planning and operations to discuss route and service opportunities.<br />
101015<br />
SANTA CRUZ SHORT RANGE TRANSIT PLAN<br />
Page D - 14<br />
WILBUR SMITH ASSOCIATES
APPENDIX D: OUTREACH RESULTS<br />
COMMUNITY FOCUS GROUP RESULTS<br />
Watsonville Focus Group results<br />
As part of the community outreach effort included in the development of the <strong>Santa</strong> <strong>Cruz</strong> <strong>METRO</strong>’s 2008-<br />
2012 <strong>Short</strong> <strong>Range</strong> <strong>Transit</strong> <strong>Plan</strong> (SRTP), Wilbur Smith Associates (WSA) conducted a focus groups with nonusers<br />
of the transit service in the community of Watsonville on Wednesday, May 16 2007. The focus group<br />
was held at the La Manzana Community Resources Center, a bilingual, bicultural community resource<br />
center serving mostly low-income residents of Watsonville and Pajaro Valley.<br />
The purpose of this focus group was threefold: 1) to identify if the members of the community were aware<br />
of <strong>METRO</strong> service in the City of Watsonville and the surrounding areas, 2) to identify the major reasons<br />
why <strong>METRO</strong> service is not currently used, and 3) to identify what service changes would increase the use of<br />
transit. The participants were a representative group of the Watsonville community, comprised of users and<br />
non-users, working class and low-income agricultural workers. The participants included the following<br />
individuals:<br />
• (2) working class mid to late 20 year old females (former bus riders)<br />
• (1) working class mid 40’s female (non-user)<br />
• (1) low-income agricultural worker, mid 30’s mother of 4 children (bus rider)<br />
• (1) low-income agricultural worker, late twenties male (occasional bus rider)<br />
• (1) low-income nursery worker, late twenties male (non-user)<br />
• (1) low-income agricultural worker, late 40’s male (non-user)<br />
The focus group began with an introduction and presentation by WSA staff person, Elizabeth <strong>Cruz</strong>, who<br />
gave a brief overview of <strong>METRO</strong>’s SRTP and explained why their participation in the process was<br />
important. Following the presentation, the group was asked a few preliminary questions to establish their<br />
level of familiarity with <strong>METRO</strong> service in Watsonville. The following sections present the participant’s<br />
responses to the questions/topics asked:<br />
Awareness of <strong>METRO</strong> <strong>Transit</strong> Service in Watsonville<br />
In general, participants said they were aware that <strong>METRO</strong> provided services within the City of Watsonville<br />
and to nearby Soquel and <strong>Santa</strong> <strong>Cruz</strong>. However, while focus group participants said they were aware<br />
<strong>METRO</strong> serviced these areas they were unclear of how to take the bus to areas they wanted to go. Several<br />
participants mentioned that a lack of information was one of the biggest reasons why they did not ride the<br />
bus. Notably, they did not know where to seek out bus schedule information as no “headways” were<br />
provided at the Watsonville <strong>Transit</strong> Center.<br />
Best Method to Communicate <strong>Transit</strong> Information<br />
When asked to identify what the best and most efficient way to distribute transit information to them, the<br />
responses of participants indicated they preferred to have printed materials made available to them. Several<br />
participants said they would like to see schedules and other transit information mailed out to their homes.<br />
If flyers or other materials could not be mailed out, interest was expressed in making these printed<br />
materials available at key centers of activity such as the <strong>METRO</strong> Center and the La Manzana Community<br />
Resources Center.<br />
101015<br />
SANTA CRUZ SHORT RANGE TRANSIT PLAN<br />
Page D - 15<br />
WILBUR SMITH ASSOCIATES
APPENDIX D: OUTREACH RESULTS<br />
Major Issues Why You Do Not Ride <strong>METRO</strong><br />
While participants had individual reasons for not riding <strong>METRO</strong>, some general themes did emerge during<br />
their conversations. The following include the topics identified along with key points expressed:<br />
1. Time schedules are not reliable (non-users or people who stopped riding)<br />
• You can never be sure what time the bus is going to arrive<br />
• Buses are consistently late<br />
2. Bus rides are too long (people who stopped riding the riders)<br />
• It is inconvenient to ride the bus with many stops that result in a 1-hour trip when the alternative<br />
(driving or asking for a ride) is much faster<br />
3. Bus driver attitudes<br />
• When approached with questions about routes and how to get to particular destinations, drivers were<br />
accused of being rude and providing a schedule map<br />
• Some women participants expressed feeling uncomfortable around bus drivers they felt would look<br />
at them inappropriately<br />
4. Bus service isn’t provided to the areas I need to go (non riders)<br />
• Bus service isn’t provided near agricultural fields, where many of the non-rider population work.<br />
• Bus service isn’t provided to doctor or dentist offices in nearby cities<br />
Key issues of concern for (bus riders/former bus riders)<br />
1. Price of Fare<br />
• The price of fare is expensive especially because no transfer system exists. It is unfair for low-income<br />
riders to have to pay full fare for a one-way trip that requires transfer of buses.<br />
• It is especially hard for families with children to travel on the bus for two main reasons:<br />
1. Children above 46 inches must pay full fare<br />
2. There is a limit of 3 children per fare-paying adult<br />
2. Bus stop locations<br />
• Need shelters and good lighting so riders can feel comfortable and safe while waiting for the bus to<br />
arrive<br />
• Need to be provided near major sources of employment for low-income riders (e.g. near agricultural<br />
fields)<br />
Travel Alternatives Used by Non-Riders<br />
Carpools<br />
Based on the fact that the majority of the focus groups participants were non-riders questions were asked to<br />
determine what alternatives they used to travel and get where they needed to go. Generally, non-riders<br />
worked in agricultural fields and said they would carpool with co-workers. They self reported that they<br />
would pay approximately $25 a week to the driver.<br />
101015<br />
SANTA CRUZ SHORT RANGE TRANSIT PLAN<br />
Page D - 16<br />
WILBUR SMITH ASSOCIATES
APPENDIX D: OUTREACH RESULTS<br />
Rides<br />
Participants said that when they wanted to make trips that were possible by bus they would typically ask a<br />
friend, a relative, or neighbor for a ride. However, they expressed feelings of guilt for imposing themselves<br />
on their ride providers and would often pay them $20 or more for their “troubles.” Rides became a<br />
particularly troublesome when ride providers would have to travel to another field site and left the<br />
carpoolers without a ride.<br />
Taxi<br />
In emergency situations participants said they relied on taxi service which was often costly but necessary<br />
due to the nature of their trips.<br />
Improvements or modifications that <strong>METRO</strong> could make to increase your likeliness to use transit<br />
• Provide an express route between Watsonville and <strong>Santa</strong> <strong>Cruz</strong><br />
• Provide more information about bus scheduling and stop locations<br />
• Provide bus shelters. The majority of bus stops are only designated by a pole with the route number<br />
and provide no weather protection<br />
• Provide good lighting and emergency phones at bus stop locations in remote areas<br />
• Widely advertise service changes to bus routes<br />
• Introduce a discounted bus fare price for children<br />
• Introduce a bus transfer system<br />
• Provide more bilingual bus drivers<br />
101015<br />
SANTA CRUZ SHORT RANGE TRANSIT PLAN<br />
Page D - 17<br />
WILBUR SMITH ASSOCIATES
APPENDIX D: OUTREACH RESULTS<br />
CAPITOLA FOCUS GROUP RESULTS<br />
As part of the community outreach effort included in the development of the <strong>Santa</strong> <strong>Cruz</strong> <strong>METRO</strong>’s 2008-<br />
2012 <strong>Short</strong> <strong>Range</strong> <strong>Transit</strong> <strong>Plan</strong> (SRTP), Wilbur Smith Associates (WSA) conducted a focus groups with nonusers<br />
of the transit service in the community of Capitola on Thursday, May 17 2007. The focus group was<br />
held during the evening hours at Capitola City Hall.<br />
The purpose of this focus group was threefold: 1) to identify if the members of the community were aware<br />
of <strong>METRO</strong> service in the City of Capitola and the surrounding areas, 2) to identify the major reasons why<br />
<strong>METRO</strong> service is not currently used, and 3) to identify what service changes would increase the use of<br />
transit. The participants were a representative group of the Capitola community, comprised of users and<br />
non-users, owners and renters. The participants included the following individuals:<br />
Name Tenancy Gender Age Disabled<br />
Bob Begun Renter M 80<br />
Shirley Forsyth Owner F 65+ X<br />
Henry Queen Owner M 77 X<br />
Mike Spence Owner M 58<br />
John Nicol Owner M 59<br />
Toni Castro Owner F 54<br />
Mick Routh Owner M 62<br />
Thea Luitin Owner F 44<br />
Julius Burks Renter M 52<br />
John Travers Renter M 53<br />
Lyn Travers Renter F 54<br />
Dewayne Woods Owner M 39<br />
B.J. Crawford Renter F 29<br />
Sharon Presco Renter F 59<br />
Debbie Johnson Renter F 49<br />
The focus group began with an introduction and presentation by WSA staff person, Robert Betts, who gave<br />
a brief overview of <strong>METRO</strong>’s SRTP and explained why their participation in the process was important.<br />
Following the presentation, the group was asked a few preliminary questions to establish their level of<br />
familiarity with <strong>METRO</strong> service in Capitola. Additional questions were then asked to obtain the group’s<br />
input on changes and improvements to <strong>METRO</strong> service in Capitola.<br />
The Capitola focus group attendees had a lot of useful feedback regarding the <strong>METRO</strong> service. Attendees<br />
were non-users, infrequent users, former users almost all had specific comments about existing routes and<br />
frequencies, destinations and how <strong>METRO</strong> might better serve the community. Residents seemed mostly<br />
concerned about increasing local service within and around the city as opposed to to-and-from Watsonville<br />
and <strong>Santa</strong> <strong>Cruz</strong>. Other major concerns included:<br />
• Provision, transparency and convenience of service information<br />
• More convenient start and end schedule for work hours<br />
101015<br />
SANTA CRUZ SHORT RANGE TRANSIT PLAN<br />
Page D - 18<br />
WILBUR SMITH ASSOCIATES
APPENDIX D: OUTREACH RESULTS<br />
• Capitola Mall identified as an inconvenient place for most locals that want to go directly to <strong>Santa</strong><br />
<strong>Cruz</strong><br />
• <strong>METRO</strong>’s buses are too large/noisy for Capitola’s small streets<br />
Each of the issues addressed at the focus group are outlined in greater detail in the sections below:<br />
Concerns/Complaints/Issues with <strong>METRO</strong> <strong>Transit</strong> Service:<br />
Senior/Disabled concerns<br />
• Metro doesn’t send out service information<br />
• Need to go to Capitola Mall, can’t get schedules<br />
• Para-<strong>Cruz</strong> difficult to plan trips, very restrictive/inflexible<br />
• 3-hours out of life each day to take a trip<br />
Inconvenience – Origins & Destinations<br />
• Most Capitola routes go to Mall – this is inconvenient<br />
• Buses only go to downtown, <strong>Santa</strong> <strong>Cruz</strong> or Mall, not around Capitola, or neighborhoods<br />
• 80% of shopping is done within city limits, but most routes are ins and outs<br />
Information<br />
• Schedules not user-friendly<br />
• Bus-stops are not on web site<br />
Frequency<br />
• Round-trip 3-hours to DT <strong>Santa</strong> <strong>Cruz</strong><br />
• Wait 10-25 minutes for bus, take to mall and transfer<br />
• Buses at “hill district” only come twice per day during commute hours<br />
• Cannot get home after work (service stops too early)<br />
• Cannot get to work with <strong>METRO</strong> because service starts too late<br />
Reliability<br />
• Reliance on transit lost one person a potential job due to negative perception of <strong>METRO</strong> on-time<br />
reliability<br />
Distance to bus-stops<br />
• Taking <strong>METRO</strong> to work is convenient only when within 2/blocks of work or home<br />
101015<br />
SANTA CRUZ SHORT RANGE TRANSIT PLAN<br />
Page D - 19<br />
WILBUR SMITH ASSOCIATES
APPENDIX D: OUTREACH RESULTS<br />
Quality of Service<br />
Equity<br />
• Buses are too big (too loud) for the roads in Capitola<br />
• Need smaller buses here<br />
• Buses are filthy<br />
• Feel unsafe<br />
• Capitola should have our share of service based on the amount of sales tax we contribute (we pay<br />
more and get less)<br />
• <strong>METRO</strong> should train potential riders early and give students free passes<br />
Suggestions for Improvements<br />
Trolley/Circulator<br />
• Current shuttle goes from Post office to beach and back<br />
• Why not have the same as UCSC shuttle bus system that complements <strong>METRO</strong><br />
• Trolley would be fun in Capitola<br />
• Get rides up the hill<br />
• Regular schedule, 10 -20 minute frequency<br />
• Circulator – continual loop<br />
• Luggage, storage area for errands<br />
• Local neighborhoods: JB, Vill, Cliffwood, Gayles Bakery, North 40ths, Beach, NH’s, Shopping,<br />
• Serve tourists and residents<br />
• Willingness to pay?<br />
• Merchant funded<br />
• Token promotional<br />
• coupon system<br />
Serve more destination/routes<br />
• Direct service from Capitola neighborhoods to <strong>Santa</strong> <strong>Cruz</strong> bypassing Mall<br />
• Esplanade would be nice to have bus routes<br />
• Mall, Village, Bay Avenue<br />
• Library, beach, golf course, recreational areas<br />
• Golf course, wharf to wharf<br />
101015<br />
SANTA CRUZ SHORT RANGE TRANSIT PLAN<br />
Page D - 20<br />
WILBUR SMITH ASSOCIATES
APPENDIX D: OUTREACH RESULTS<br />
Provide more information<br />
• Next Bus<br />
• Mapquest tool: you type in o/d it provides route and stops<br />
• Capitola Local TV – rolling scroll with route change information<br />
• City newsletter<br />
Environmentally clean buses – natural gas/electric<br />
• Summer busses are popular, attractive and fun<br />
• Good time, green focus<br />
• Natural gas, electric buses more green<br />
Other Capitola Information<br />
• population is declining and aging<br />
• growing rental housing stock<br />
• aging population is transit dependant, needs to get to hospital, doctor, pharmacy<br />
• greater need for inter-city than intra-city transport with a regular (memorizable) frequency<br />
• Watsonville is labor pool<br />
• Destination 41st Avenue, no housing there<br />
• Watsonville to Capitola mall routes should be focused on commute hours<br />
• Population would like to be able to take <strong>METRO</strong>/trolley to dinner/shopping and back<br />
101015<br />
SANTA CRUZ SHORT RANGE TRANSIT PLAN<br />
Page D - 21<br />
WILBUR SMITH ASSOCIATES
APPENDIX D: OUTREACH RESULTS<br />
CABRILLO COLLEGE WEB SURVEY RESULTS<br />
How frequently do you use <strong>METRO</strong> for trips to Cabillo College?<br />
(<strong>Transit</strong> Non-Users)<br />
n = 90<br />
70.00%<br />
64.44%<br />
60.00%<br />
50.00%<br />
Percent of Responses<br />
40.00%<br />
30.00%<br />
20.00%<br />
16.67%<br />
12.22%<br />
10.00%<br />
6.67%<br />
0.00%<br />
Daily or almost daily<br />
Weekly<br />
Response<br />
Monthly/Infrequently<br />
Never or almost never<br />
How do you most often get to Cabrillo College?<br />
n = 141<br />
60.00%<br />
52.48%<br />
50.00%<br />
Percent of Responses<br />
40.00%<br />
30.00%<br />
20.00%<br />
34.04%<br />
10.00%<br />
7.80%<br />
0.00%<br />
0.71%<br />
3.55%<br />
1.42%<br />
Car<br />
Rideshare<br />
Bike<br />
Response<br />
Walk<br />
<strong>METRO</strong> System<br />
Other (please specify)<br />
101015<br />
SANTA CRUZ SHORT RANGE TRANSIT PLAN<br />
Page D - 22<br />
WILBUR SMITH ASSOCIATES
APPENDIX D: OUTREACH RESULTS<br />
Approximate number of blocks to your nearest bus stop<br />
n = 63<br />
40.00%<br />
36.51%<br />
35.00%<br />
30.00%<br />
Percent of Responses<br />
25.00%<br />
20.00%<br />
15.00%<br />
20.63%<br />
23.81%<br />
10.00%<br />
5.00%<br />
6.35%<br />
7.94%<br />
4.76%<br />
0.00%<br />
1<br />
2<br />
3<br />
Response<br />
4<br />
5 or more<br />
Not Sure<br />
How frequently do you use <strong>METRO</strong> for trips to Cabillo College?<br />
(<strong>Transit</strong> Users)<br />
n = 46<br />
100.00%<br />
90.00%<br />
84.78%<br />
80.00%<br />
Percent of Responses<br />
70.00%<br />
60.00%<br />
50.00%<br />
40.00%<br />
30.00%<br />
20.00%<br />
15.22%<br />
10.00%<br />
0.00%<br />
0.00%<br />
Daily or almost daily<br />
Weekly<br />
Response<br />
Monthly/Infrequently<br />
101015<br />
SANTA CRUZ SHORT RANGE TRANSIT PLAN<br />
Page D - 23<br />
WILBUR SMITH ASSOCIATES
APPENDIX D: OUTREACH RESULTS<br />
To what extent have the following factors impacted your decision NOT to commute primarily by bus?<br />
n = 64<br />
Category: Poor Service Information<br />
Very<br />
Significa<br />
nt<br />
4.00<br />
3.50<br />
Average of Responses<br />
No<br />
Impact<br />
3.00<br />
2.50<br />
2.00<br />
1.50<br />
1.00<br />
0.50<br />
0.00<br />
Unaware that <strong>METRO</strong> exists<br />
0.09<br />
<strong>METRO</strong> website not helpful<br />
0.61 0.64<br />
Don't have access to a system map<br />
Hard to find published schedules<br />
0.98<br />
Schedules/route changes not advertised well<br />
Response<br />
1.52<br />
Trip planning is difficult<br />
2.63<br />
Customer service is inaccessible<br />
1.00<br />
Average of Responses<br />
Most Frequent Response<br />
To what extent have the following factors impacted your decision NOT to commute primarily by bus?<br />
n = 63<br />
Category: Non-Convenient for My Lifestyle<br />
Very<br />
Significant<br />
Impact<br />
4.00<br />
3.50<br />
Average of Responses<br />
3.00<br />
2.50<br />
2.00<br />
1.50<br />
1.00<br />
0.74<br />
2.22<br />
2.07<br />
0.50<br />
0.00<br />
No<br />
Impact<br />
Chidcare/family obligations<br />
Offpeak/Irregular schedule (i.e. night classes)<br />
Response<br />
Other<br />
Average of Responses<br />
Most Frequent Response<br />
101015<br />
SANTA CRUZ SHORT RANGE TRANSIT PLAN<br />
Page D - 24<br />
WILBUR SMITH ASSOCIATES
APPENDIX D: OUTREACH RESULTS<br />
To what extent have the following factors impacted your decision NOT to commute primarily by bus?<br />
n = 60<br />
Category: Poor or Limited Service Area Coverage<br />
Very Significant 4.00<br />
Impact<br />
3.50<br />
Average of Responses<br />
3.00<br />
2.50<br />
2.00<br />
1.50<br />
1.00<br />
0.50<br />
1.41<br />
1.19<br />
1.45 1.52<br />
No 0.00<br />
Impact<br />
Bus doesn't go where I live<br />
Bus doesn't go to my destinations (work, shopping,...<br />
Too long of walk to bus stop<br />
Response<br />
Lack of transfers<br />
Average of Responses<br />
Most Frequent Response<br />
To what extent have the following factors impacted your decision NOT to commute primarily by bus?<br />
n = 59<br />
Category: <strong>METRO</strong> Service Reliability<br />
Very 4.00<br />
Significant<br />
Impact<br />
3.50<br />
3.00<br />
Average of Responses<br />
2.50<br />
2.00<br />
1.50<br />
1.00<br />
1.89<br />
1.43<br />
1.63<br />
0.82<br />
0.50<br />
No<br />
Impact<br />
0.00<br />
Poor on-time performance<br />
Missed scheduled transfers<br />
Difficult schedule to remember<br />
Response<br />
Other<br />
Average of Responses<br />
Most Frequent Response<br />
101015<br />
SANTA CRUZ SHORT RANGE TRANSIT PLAN<br />
Page D - 25<br />
WILBUR SMITH ASSOCIATES
APPENDIX D: OUTREACH RESULTS<br />
To what extent have the following factors impacted your decision NOT to commute primarily by bus?<br />
n = 63<br />
Category: Poor or Limited Time Coverage<br />
Very 4.00<br />
Significant<br />
Impact<br />
3.50<br />
Average of Responses<br />
3.00<br />
2.50<br />
2.00<br />
1.50<br />
1.00<br />
1.30<br />
1.60<br />
2.64<br />
2.74<br />
1.70<br />
0.50<br />
No<br />
Impact<br />
0.00<br />
Bus starts too late<br />
Bus doesn't operate late enough<br />
Service is too infrequent<br />
Multiple buses for one trip creates long travel times<br />
Response<br />
Weekend service is insufficient<br />
Average of Responses<br />
Most Frequent Response<br />
To what extent have the following factors impacted your decision NOT to commute primarily by bus?<br />
n = 60<br />
Category: <strong>METRO</strong> Service Cost<br />
Very<br />
Significant<br />
Impact<br />
4.00<br />
3.50<br />
Average of Responses<br />
3.00<br />
2.50<br />
2.00<br />
1.50<br />
1.00<br />
0.50<br />
1.21 1.26<br />
1.70<br />
1.43<br />
0.74<br />
0.87<br />
0.00<br />
No<br />
Impact<br />
Cabrillo pass is too expensive<br />
Bus transfers are too expensive<br />
Cabrillo parking pass is cheaper than bus pass<br />
Multi-use passes (1 day or multi-ride) are too exp...<br />
Don't know where to purchase multi-use passes<br />
Response<br />
Unaware of multi-use passes<br />
Average of Responses<br />
Most Frequent Response<br />
101015<br />
SANTA CRUZ SHORT RANGE TRANSIT PLAN<br />
Page D - 26<br />
WILBUR SMITH ASSOCIATES
APPENDIX D: OUTREACH RESULTS<br />
To what extent have the following factors impacted your decision NOT to commute primarily by bus?<br />
n = 56<br />
Category: <strong>METRO</strong> Service Quality<br />
Very<br />
Significan<br />
t Impact<br />
4.00<br />
3.50<br />
3.00<br />
Average of Responses<br />
2.50<br />
2.00<br />
1.50<br />
1.00<br />
1.70<br />
1.61 1.55 1.50<br />
1.37 1.36<br />
0.91<br />
0.50<br />
No<br />
Impac<br />
t<br />
0.00<br />
Comfort<br />
Bus Cleanliness<br />
Facility Cleanliness (bus stops, stations)<br />
Response<br />
Driver Courtesy<br />
Facility Security (crime)<br />
Bus Safety (driving & traffic)<br />
Other<br />
Average of Responses<br />
Most Frequent Response<br />
To what extent would the following impact your decision to INCREASE your use of <strong>METRO</strong> Service in the<br />
future?<br />
n = 42<br />
Category: Expanded Service Information<br />
Very<br />
Significant<br />
Impact<br />
4.00<br />
3.50<br />
Average of Responses<br />
3.00<br />
2.50<br />
2.00<br />
1.50<br />
1.00<br />
1.43<br />
1.59<br />
1.93<br />
1.59<br />
1.93<br />
2.34<br />
1.32<br />
0.50<br />
0.00<br />
No<br />
Impact<br />
Easily navigable website<br />
Interactive system map<br />
Postings of fixed route schedules at bus stops<br />
Schedule/route change announcements<br />
Response<br />
Trip planning function<br />
Real-time bus location information<br />
Different customer service hours or locations<br />
Average of Responses<br />
Most Frequent Response<br />
101015<br />
SANTA CRUZ SHORT RANGE TRANSIT PLAN<br />
Page D - 27<br />
WILBUR SMITH ASSOCIATES
APPENDIX D: OUTREACH RESULTS<br />
To what extent would the following impact your decision to INCREASE your use of <strong>METRO</strong> Service in the<br />
future?<br />
n = 42<br />
Category: Expanded Area Coverage<br />
Very Significant<br />
Impact<br />
4.00<br />
3.50<br />
Average of Responses<br />
3.00<br />
2.50<br />
2.00<br />
1.50<br />
1.00<br />
0.50<br />
1.24<br />
2.81<br />
1.46<br />
2.00<br />
No Impact<br />
0.00<br />
Service to new location (please specify in #18)<br />
More direct routes<br />
More frequent bus stops<br />
Response<br />
Fewer transfers between certain locations (please ...<br />
Average of Responses<br />
Most Frequent Response<br />
To what extent would the following impact your decision to INCREASE your use of <strong>METRO</strong> Service in the<br />
future?<br />
n = 42<br />
Category: Expanded Time Coverage<br />
Very 4.00<br />
Significant<br />
Impact<br />
3.50<br />
3.00<br />
2.74<br />
Average of Responses<br />
2.50<br />
2.00<br />
1.50<br />
1.00<br />
1.72<br />
2.38<br />
2.10<br />
2.00<br />
0.50<br />
No<br />
Impact0.00<br />
Earlier Start Time<br />
Later End Time<br />
Increased Weekend Service<br />
Response<br />
Increased Schedule Frequency<br />
Timed Transfers<br />
Average of Responses<br />
Most Frequent Response<br />
101015<br />
SANTA CRUZ SHORT RANGE TRANSIT PLAN<br />
Page D - 28<br />
WILBUR SMITH ASSOCIATES
APPENDIX D: OUTREACH RESULTS<br />
To what extent would the following impact your decision to INCREASE your use of <strong>METRO</strong> Service in the<br />
future?<br />
n = 39<br />
Category: Imporoved Service Quality<br />
Very<br />
Significant<br />
Impact<br />
4.00<br />
3.50<br />
3.00<br />
Average of Responses<br />
2.50<br />
2.00<br />
1.50<br />
1.00<br />
1.67 1.64 1.67<br />
1.49<br />
1.56<br />
1.34<br />
No<br />
Impact<br />
0.50<br />
0.00<br />
Comfort<br />
Bus Cleanliness<br />
Facility Cleanliness (bus stops, stations)<br />
Driver courtesy<br />
Response<br />
Facility security (crime)<br />
Bus safety (driving, traffic)<br />
Average of Responses<br />
Most Frequent Response<br />
To what extent would the following impact your decision to INCREASE your use of <strong>METRO</strong> Service in the<br />
future?<br />
n = 40<br />
Category: Imporoved Service Reliability<br />
Very 4.00<br />
Significant<br />
Impact 3.50<br />
Average of Responses<br />
3.00<br />
2.50<br />
2.00<br />
1.50<br />
1.00<br />
0.50<br />
No<br />
Impact<br />
0.00<br />
2.00<br />
1.63<br />
1.93<br />
2.48<br />
Better on-time service<br />
Timed scheduled transfers<br />
Easier schedule to remember<br />
Displayed bus arrival time at bus stops ("NextBus" el...<br />
Average of Responses<br />
Response<br />
Most Frequent Response<br />
101015<br />
SANTA CRUZ SHORT RANGE TRANSIT PLAN<br />
Page D - 29<br />
WILBUR SMITH ASSOCIATES
APPENDIX D: OUTREACH RESULTS<br />
Comments from “Other” Responses:<br />
Question 1: How do you most often get to <strong>METRO</strong>?<br />
I use the metro and sometimes get rides<br />
wheelchair<br />
Question 5: Poor Service Information<br />
Sometimes the buses are too packed and some bus drivers are rude and don't wait until you sit<br />
down before they start driving. I have almost fallen from this or seen others almost fall.<br />
Routes are not relevant to my commute needs<br />
It is more complicated, time and route-wise for me to take the bus<br />
Some times the bus drivers can be rude and don’t stop and it really ruins my day because ill be<br />
late to work or school.<br />
I live in Aromas, no bus line.<br />
My area is serviced just 1x during an hour. It's the inflexibility that prevents me from using public<br />
transportation.<br />
Infrequent<br />
It took me an hour to get to school from West <strong>Santa</strong> <strong>Cruz</strong> to Cabrillo and I had to walk a mile<br />
home each night at 11 pm through a sketchy area<br />
Waiting period is too long between buses<br />
Poor service<br />
Even on prime route, busses too infrequent<br />
Service not reliable<br />
Routes ridiculous, inefficient for cross-town+ no transfers<br />
Maps are difficult to read<br />
Question 7: Taking the bus isn’t convenient to my lifestyle.<br />
I like biking to school<br />
Convenience of leaving when i want directly home 2 mi<br />
Too Busy, bus takes too long<br />
I apparently have to take 3 different buses from my house to Cabrillo, a trip of about an hour<br />
and a half (compared to 20 minutes in a car)<br />
Too many stops<br />
101015<br />
SANTA CRUZ SHORT RANGE TRANSIT PLAN<br />
Page D - 30<br />
WILBUR SMITH ASSOCIATES
APPENDIX D: OUTREACH RESULTS<br />
IT takes to long.<br />
Fear of not being safe - bus stops are unsafe, people in SLV are scary and predatory at bus<br />
stops, where drugs are dealt<br />
I quite often have heavy/bulky artwork supplies to transport<br />
Because I don’t know if they are going to stop or leave me there.<br />
Frequently, the 71 is very late and does not follow the time tables listed. I don't take the bus<br />
anymore because the bus system is not very efficient or reliable.<br />
Slow service (15 min. car trip takes 30 min. bus)<br />
Needing to be places right after one another. no time to wait for bus<br />
There is no route within three miles of my home.<br />
I live far away from school<br />
I can not be sure I will be on time when I take the bus<br />
No transit service on Glen canyon<br />
Bus pass does not work on Sundays<br />
No bus service near my house<br />
Taking the bus is like a long journey, as opposed to simple transportation<br />
It’s all about the drivers, the passengers seem like a secondary consideration. . Everybody<br />
doesn't get all those union holidays off. I don’t have 3 hours a day for a half hour worth of<br />
commuting<br />
Service so limited by time and area<br />
I like to bike but bus is second choice<br />
Bus takes too long<br />
Bus takes too long to transport<br />
Too far to walk for me.<br />
Coordination with employment<br />
Question 13: <strong>METRO</strong> service reliability?<br />
Plenty reliable, bus trips from downtown to Cabrillo and back too infrequent<br />
Need some express service<br />
Uncertain of reliability - data not published or easily available<br />
I've never taken a bus.<br />
Bus schedules do not reflect ACTUAL arrival times<br />
It’s a really cute trick when the bus has came and gone like fifteen minutes before its scheduled<br />
time. or doesn't run for the last scheduled run.<br />
101015<br />
SANTA CRUZ SHORT RANGE TRANSIT PLAN<br />
Page D - 31<br />
WILBUR SMITH ASSOCIATES
APPENDIX D: OUTREACH RESULTS<br />
Not convenient like other cities + how it was here<br />
Question 15: <strong>METRO</strong> Service Quality?<br />
Too many fumes/smells<br />
Some drivers are wonderful and some are abusive. We have no action to take if they are bad<br />
I've never taken a bus<br />
Question 18: New locations for expanded service?<br />
Amesti Rd.<br />
Felton - East Zayante past glen arbor - it must be safe, security camera/well-patroled stop<br />
Lockewood and Whispering Pines<br />
More nonstop from Watsonville<br />
AROMAS<br />
Branciforte Drive<br />
More stops in Bonny Doon<br />
Shaffer Rd area coverage<br />
Question 19: Reduce the need to transfer between these locations?<br />
East Zayante and Glen Arbor to downtown <strong>Santa</strong> <strong>Cruz</strong>, 17th Ave, River Street (Costco)<br />
Scotts Valley and Cabrillo<br />
Capitola and Cabrillo<br />
Cabrillo Metro Buses specifically for students only<br />
Western to Cabrillo<br />
Green Valley rd /Cabrillo/<strong>Santa</strong> <strong>Cruz</strong><br />
To Cabrillo College<br />
I have to go downtown first to get anywhere (ie. Cabrillo, Capitola)<br />
Cabrillo and UCSC<br />
Westside <strong>Santa</strong> <strong>Cruz</strong> and Capitola/Aptos/Soquel<br />
Cabrillo to UCSC<br />
Rio del Mar and <strong>Santa</strong> <strong>Cruz</strong><br />
Westside and Cabrillo<br />
Westside to Cabrillo without stop at Metro center<br />
101015<br />
SANTA CRUZ SHORT RANGE TRANSIT PLAN<br />
Page D - 32<br />
WILBUR SMITH ASSOCIATES
APPENDIX D: OUTREACH RESULTS<br />
Question 23: Other service area improvements or amenities?<br />
Remove billboards/ads on buses<br />
A more efficient system for 71 would be great.<br />
Bus from Cabrillo to SJSU<br />
Expand service not excess technology.<br />
101015<br />
SANTA CRUZ SHORT RANGE TRANSIT PLAN<br />
Page D - 33<br />
WILBUR SMITH ASSOCIATES
APPENDIX E: FINANCIAL TABLES<br />
The following tables show the detailed revenue sources for actual end FY07 through projected FY12 using<br />
three different projection methodologies including:<br />
• <strong>METRO</strong> projections based on MTD five year framework (November 2007) – Table H-1<br />
• Projections based on historic <strong>METRO</strong> budgets – Table H-2<br />
• Recommended projections for SRTP – Table H-3<br />
• Projections based on SCMTD TY 2009 Budget – Table H-4<br />
• Historic budget analysis – Table H-5<br />
• <strong>METRO</strong> year end actuals – Table H-6<br />
• Historic and projected sales tax revenue – Table H-7<br />
101015<br />
SANTA CRUZ SHORT RANGE TRANSIT PLAN<br />
Page E - 1<br />
WILBUR SMITH ASSOCIATES
APPENDIX E: FINANCIAL TABLES<br />
Table H-1: <strong>METRO</strong> Five Year Framework Projection<br />
REVENUE SOURCE<br />
YEAR PROJ. YEAR<br />
AVG. ANNUAL<br />
END END PROJ PROJ PROJ PROJ<br />
CHANGE<br />
ACTUAL ACTUAL FY09 FY10 FY11 FY12<br />
FY09/ FY12<br />
FY07 FY08<br />
Passenger Fares $ 3,406,079 $ 3,450,078 $ 3,519,080 $ 3,589,461 $ 3,661,250 $ 3,734,475 2%<br />
Special <strong>Transit</strong> Fares $ 2,837,936 $ 3,050,000 $ 3,202,500 $ 3,362,625 $ 3,530,756 $ 3,707,294 5%<br />
Paratransit Fares $ 229,100 $ 229,644 $ 231,940 $ 234,260 $ 236,602 $ 238,968 1%<br />
Highway 17 Fares $ 818,902 $ 842,000 $ 867,260 $ 893,278 $ 920,076 $ 947,678 3%<br />
Highway 17 Payments $ 438,482 $ 509,000 $ 524,270 $ 539,998 $ 556,198 $ 572,884 3%<br />
Commissions $ 5,695 $ 5,372 $ 5,372 $ 5,372 $ 5,372 $ 5,372 0%<br />
Advertising Income $ 243,273 $ 200,461 $ 175,000 $ 180,250 $ 185,658 $ 191,227 3%<br />
Rent Income - SC Metro Center $ 85,935 $ 81,803 $ 83,439 $ 85,108 $ 86,810 $ 88,546 2%<br />
Rent Income - Watsonville TC $ 50,644 $ 45,758 $ 46,673 $ 47,607 $ 48,559 $ 49,530 2%<br />
Rent Income - General $ 4,800 $ - $ - $ - $ - $ - 0%<br />
Interest Income $ 1,327,929 $ 875,000 $ 750,000 $ 500,000 $ 450,000 $ 450,000<br />
Other Non-Trans Revenue $ 269,279 $ 136,000 $ 170,000 $ 175,100 $ 180,353 $ 185,764 3%<br />
Sales Tax $ 17,652,773 $ 17,624,453 $ 18,065,064 $ 18,516,691 $ 18,979,608 $ 19,454,098 3%<br />
Transp Dev Act (TDA) Funds $ 6,165,834 $ 6,362,036 $ 6,552,897 $ 6,749,484 $ 6,951,969 $ 7,160,528 3%<br />
FTA Sec 5307 - Op Assistance $ 3,200,226 $ 3,153,552 $ 3,216,623 $ 3,280,956 $ 3,346,575 $ 3,413,506 2%<br />
Repay FTA Advance (5 years) $ (70,000) $ (70,000) $ (70,000) $ (70,000) $ - $ - 0%<br />
FTA Sec 5311 - Rural Op Asst $ 168,582 $ 149,335 $ 155,308 $ 161,521 $ 167,982 $ 174,701 4%<br />
Transfer from Capital/Proj Mgr $ - $ - $ - $ - $ - 4%<br />
SUBTOTAL REVENUE $ 6,835,469 $ 36,644,493 $ 7,495,427 $38,251,710 $ 39,307,767 $ 40,374,572<br />
ANNUAL INCREASE 2.3% 2.0% 2.8% 2.7%<br />
ONE-TIME REVENUE<br />
Carryover from Prev. Year $ - $ - $ - $ - $ -<br />
Transfer from Insurance Reserves $ - $ 30,000 $ 150,000 $ 150,000 $ 150,000 $ 150,000<br />
Transfer from Reserves $ 152,270<br />
FTA Sec 5317 - Op Assistance $ - $ 17,785 $ - $ - $ - $ -<br />
AMBAG Funding (Intern &<br />
SRTP) $ 39,404 $ 43,746 $ - $ - $ - $ -<br />
SUBTOTAL ONE-TIME<br />
REVENUE $ 39,404 $ 243,801 $ 150,000 $ 150,000 $ 150,000 $ 150,000<br />
TOTAL REVENUE $ 6,874,873 $ 36,888,294 $37,645,427 $38,401,710 $ 39,457,767 $ 40,524,572<br />
101015<br />
SANTA CRUZ SHORT RANGE TRANSIT PLAN WILBUR SMITH ASSOCIATES<br />
Page E - 2
Table H-2: Projections Based on Historic <strong>METRO</strong> Budgets<br />
YEAR PROJ. YEAR<br />
END END<br />
REVENUE SOURCE<br />
ACTUAL ACTUAL<br />
FY07 FY08<br />
PROJ<br />
FY09<br />
APPENDIX E: FINANCIAL TABLES<br />
101015<br />
SANTA CRUZ SHORT RANGE TRANSIT PLAN WILBUR SMITH ASSOCIATES<br />
Page E - 3<br />
PROJ<br />
FY10<br />
PROJ<br />
FY11<br />
PROJ<br />
FY12<br />
AVG. ANNUAL<br />
CHANGE<br />
FY09/ FY12<br />
Passenger Fares $ 3,406,079 $ 3,450,078 $ 3,450,078 $ 3,450,078 $ 3,450,078 $ 3,450,078 0%<br />
Special <strong>Transit</strong> Fares $ 2,837,936 $ 3,050,000 $ 3,202,500 $ 3,362,625 $ 3,530,756 $ 3,707,294 5%<br />
Paratransit Fares $ 229,100 $ 229,644 $ 231,940 $ 234,260 $ 236,602 $ 238,968 1%<br />
Highway 17 Fares $ 818,902 $ 842,000 $ 867,260 $ 893,278 $ 920,076 $ 947,678 3%<br />
Highway 17 Payments $ 438,482 $ 509,000 $ 524,270 $ 539,998 $ 556,198 $ 572,884 3%<br />
Commissions $ 5,695 $ 5,372 $ 5,372 $ 5,372 $ 5,372 $ 5,372 0%<br />
Advertising Income $ 243,273 $ 200,461 $ 175,000 $ 180,250 $ 185,658 $ 191,227 3%<br />
Rent Income - SC Metro Center $ 85,935 $ 81,803 $ 83,439 $ 85,108 $ 86,810 $ 88,546 2%<br />
Rent Income - Watsonville TC $ 50,644 $ 45,758 $ 46,673 $ 47,607 $ 48,559 $ 49,530 2%<br />
Rent Income - General $ 4,800 $ - $ - $ - $ - $ - 0%<br />
Interest Income $ 1,327,929 $ 875,000 $ 750,000 $ 500,000 $ 450,000 $ 450,000<br />
Other Non-Transp Revenue $ 269,279 $ 136,000 $ 170,000 $ 175,100 $ 180,353 $ 185,764 3%<br />
Sales Tax $ 17,652,773 $ 17,624,453 $ 18,065,064 $ 18,516,691 $ 18,979,608 $ 19,454,098 2.5%<br />
Transp Dev Act (TDA) Funds $ 6,165,834 $ 6,362,036 $ 6,552,897 $ 6,749,484 $ 6,951,969 $ 7,160,528 3.0%<br />
FTA Sec 5307 - Op Assistance $ 3,200,226 $ 3,153,552 $ 3,216,623 $ 3,280,956 $ 3,346,575 $ 3,413,506 2.0%<br />
Repay FTA Advance (5 years) $ (70,000) $ (70,000) $ (70,000) $ (70,000) $ - $ - 0%<br />
FTA Sec 5311 - Rural Op Asst $ 168,582 $ 149,335 $ 155,308 $ 161,521 $ 167,982 $ 174,701 4%<br />
Transfer from Capital/Proj Mgr $ - $ - $ - $ - $ - 4%<br />
SUBTOTAL REVENUE $36,835,469 $ 36,644,493 $ 37,426,426 $ 38,112,326 $ 39,096,595 $ 40,090,175<br />
ANNUAL INCREASE 2.1% 1.8% 2.6% 2.5%<br />
ONE-TIME REVENUE<br />
Carryover from Previous Year $ - $ - $ - $ - $ -<br />
Transfer from Insurance Reserves $ - $ 30,000 $ 150,000 $ 150,000 $ 150,000 $ 150,000<br />
Transfer from Reserves $ 152,270<br />
FTA Sec 5317 - Op Assistance $ - $ 17,785 $ - $ - $ - $ -<br />
AMBAG Funding (Intern & SRTP) $ 39,404 $ 43,746 $ - $ - $ - $ -<br />
SUBTOTAL ONE-TIME<br />
REVENUE $ 39,404 $ 243,801 $ 150,000 $ 150,000 $ 150,000 $ 150,000<br />
TOTAL REVENUE $36,874,873 $ 36,888,294 $ 37,576,426 $ 38,262,326 $ 39,246,595 $ 40,240,175
APPENDIX E: FINANCIAL TABLES<br />
Table H-3: Recommended Projections for SRTP<br />
REVENUE SOURCE<br />
YEAR PROJ. YEAR<br />
AVG. ANNUAL<br />
END END PROJ PROJ PROJ PROJ<br />
CHANGE<br />
ACTUAL ACTUAL FY09 FY10 FY11 FY12<br />
FY09/ FY12<br />
FY07 FY08<br />
Passenger Fares $ 3,406,079 $ 3,450,078 $ 3,519,080 $ 3,589,461 $ 3,661,250 $ 3,734,475 2%<br />
Special <strong>Transit</strong> Fares $ 2,837,936 $ 3,050,000 $ 3,202,500 $ 3,362,625 $ 3,530,756 $ 3,707,294 5%<br />
Paratransit Fares $ 229,100 $ 229,644 $ 231,940 $ 234,260 $ 236,602 $ 238,968 1%<br />
Highway 17 Fares $ 818,902 $ 842,000 $ 867,260 $ 893,278 $ 920,076 $ 947,678 3%<br />
Highway 17 Payments $ 438,482 $ 509,000 $ 524,270 $ 539,998 $ 556,198 $ 572,884 3%<br />
Commissions $ 5,695 $ 5,372 $ 5,372 $ 5,372 $ 5,372 $ 5,372 0%<br />
Advertising Income $ 243,273 $ 200,461 $ 175,000 $ 180,250 $ 185,658 $ 191,227 3%<br />
Rent Income - SC Metro Center $ 85,935 $ 81,803 $ 83,439 $ 85,108 $ 86,810 $ 88,546 2%<br />
Rent Income - Watsonville TC $ 50,644 $ 45,758 $ 46,673 $ 47,607 $ 48,559 $ 49,530 2%<br />
Rent Income - General $ 4,800 $ - $ - $ - $ - $ - 0%<br />
Interest Income $ 1,327,929 $ 875,000 $ 750,000 $ 500,000 $ 450,000 $ 450,000<br />
Other Non-Transp Revenue $ 269,279 $ 136,000 $ 170,000 $ 175,100 $ 180,353 $ 185,764 3%<br />
Sales Tax $ 17,652,773 $ 17,624,453 $ 17,712,575 $ 17,889,701 $ 18,426,392 $ 18,979,184 2%<br />
Transp Dev Act (TDA) Funds $ 6,165,834 $ 6,362,036 $ 6,247,519 $ 6,309,995 $ 6,499,294 $ 6,694,273 2%<br />
FTA Sec 5307 - Op Assistance $ 3,200,226 $ 3,153,552 $ 3,185,088 $ 3,248,789 $ 3,313,765 $ 3,380,040 2%<br />
Repay FTA Advance (5 years) $ 70,000) $ (70,000) $ (70,000) $ (70,000) $ - $ - 0%<br />
FTA Sec 5311 - Rural Op Asst $ 168,582 $ 149,335 $ 155,308 $ 161,521 $ 167,982 $ 174,701 4%<br />
Transfer from Capital/Proj Mgr $ - $ - $ - $ - $ - 4%<br />
SUBTOTAL REVENUE $ 36,835,469 $ 36,644,493 $ 36,806,025 $ 37,153,064 $ 38,269,068 $ 39,399,937<br />
ANNUAL INCREASE 0.4% 0.9% 3.0% 3.0%<br />
ONE-TIME REVENUE<br />
Carryover from Previous Year $ - $ - $ - $ - $ -<br />
Transfer from Insurance Reserves $ - $ 30,000 $ 150,000 $ 150,000 $ 150,000 $ 150,000<br />
Transfer from Reserves $ 152,270<br />
FTA Sec 5317 - Op Assistance $ - $ 17,785 $ - $ - $ - $ -<br />
AMBAG Funding (Intern & SRTP) $ 39,404 $ 43,746 $ - $ - $ - $ -<br />
SUBTOTAL ONE-TIME<br />
REVENUE $ 39,404 $ 243,801 $ 150,000 $ 150,000 $ 150,000 $ 150,000<br />
TOTAL REVENUE $ 36,874,873 $ 36,888,294 $ 36,956,025 $ 37,303,064 $ 38,419,068 $ 39,549,937<br />
101015<br />
SANTA CRUZ SHORT RANGE TRANSIT PLAN WILBUR SMITH ASSOCIATES<br />
Page E - 4
Table H-4: Projections Based on SCMTD TY 2009 Budget (as of March 28, 2008)<br />
YEAR PROJ. YEAR<br />
END END PROJ<br />
REVENUE SOURCE<br />
ACTUAL ACTUAL FY09<br />
FY07 FY08<br />
APPENDIX E: FINANCIAL TABLES<br />
101015<br />
SANTA CRUZ SHORT RANGE TRANSIT PLAN WILBUR SMITH ASSOCIATES<br />
Page E - 5<br />
PROJ<br />
FY10<br />
PROJ<br />
FY11<br />
PROJ<br />
FY12<br />
AVG. ANNUAL<br />
CHANGE<br />
FY09/ FY12<br />
Passenger Fares $ 3,406,079 $ 3,450,078 $ 3,519,080 $ 3,589,461 $ 3,661,250 $ 3,734,475 2%<br />
Special <strong>Transit</strong> Fares $ 2,837,936 $ 3,050,000 $ 3,275,000 $ 3,578,000 $ 3,756,900 $ 3,944,745 5%<br />
Paratransit Fares $ 229,100 $ 229,644 $ 235,335 $ 241,313 $ 243,726 $ 246,163 1%<br />
Highway 17 Fares $ 818,902 $ 842,000 $ 852,000 $ 877,000 $ 903,310 $ 930,409 3%<br />
Highway 17 Payments $ 438,482 $ 509,000 $ 548,000 $ 583,000 $ 600,490 $ 618,505 3%<br />
Commissions $ 5,695 $ 5,372 $ 5,479 $ 5,589 $ 5,589 $ 5,589 0%<br />
Advertising Income $ 243,273 $ 200,461 $ 92,400 $ 150,000 $ 154,500 $ 159,135 3%<br />
Rent Income - SC Metro Center $ 85,935 $ 81,803 $ 83,030 $ 84,275 $ 85,961 $ 87,680 2%<br />
Rent Income - Watsonville TC $ 50,644 $ 45,758 $ 46,216 $ 46,678 $ 47,612 $ 48,564 2%<br />
Rent Income - General $ 4,800 $ - $ - $ - $ - $ - 0%<br />
Interest Income $ 1,327,929 $ 875,000 $ 335,000 $ 325,000 $ 450,000 $ 450,000<br />
Other Non-Transp Revenue $ 269,279 $ 136,000 $ 132,000 $ 132,000 $ 135,960 $ 140,039 3%<br />
Sales Tax $17,652,773 $ 17,624,453 $ 17,682,614 $ 18,213,092 $ 18,759,485 $ 19,322,269 3%<br />
Transp Dev Act (TDA) Funds $ 6,165,834 $ 6,362,036 $ 6,249,168 $ 6,436,643 $ 6,629,742 $ 6,828,635 3%<br />
FTA Sec 5307 - Op Assistance $ 3,200,226 $ 3,153,552 $ 3,426,293 $ 3,570,197 $ 3,641,601 $ 3,714,433 3%<br />
Repay FTA Advance (5 years) $ (70,000) $ (70,000) $ (70,000) $ (70,000) $ - $ - 0%<br />
FTA Sec 5311 - Rural Op Asst $ 168,582 $ 149,335 $ 161,615 $ 168,403 $ 175,139 $ 182,145 4%<br />
Transfer from Capital/Proj Mgr $ - $ - $ - $ - $ - 4%<br />
SUBTOTAL REVENUE $36,835,469 $ 36,644,493 $ 36,573,230 $ 37,930,651 $ 39,251,265 $ 40,412,785<br />
ANNUAL INCREASE -0.2% 3.7% 3.5% 3.0%<br />
ONE-TIME REVENUE<br />
Carryover from Previous Year $ - $ 2,000,000 $ - $ - $ -<br />
Transfer from Insurance Reserves $ - $ 30,000 $ 150,000 $ 150,000 $ 150,000 $ 150,000<br />
Transfer from Reserves $ 152,270 $ 115,830 $ 119,305<br />
FTA Sec 5317 - Op Assistance $ - $ 17,785 $ - $ - $ - $ -<br />
AMBAG Funding (Intern & SRTP) $ 39,404 $ 43,746 $ - $ - $ - $ -<br />
SUBTOTAL ONE-TIME<br />
REVENUE $ 39,404 $ 243,801 $ 2,265,830 $ 269,305 $ 150,000 $ 150,000<br />
TOTAL REVENUE $36,874,873 $ 36,888,294 $ 38,839,060 $ 38,199,956 $ 39,401,265 $ 40,562,785
Table H-5: Historic Budget Analysis<br />
APPENDIX E: FINANCIAL TABLES<br />
Adopted Budgets Historic MTD Budgets<br />
1998 1999 2000 2001 2002 2003 2004 2005 2006 2007 2008<br />
Average Annual<br />
Growth Rates<br />
Feb<br />
Revised<br />
Revised Final<br />
10 5<br />
Revised<br />
Final Revised Final Final Adopted<br />
Budget<br />
Budget Budget<br />
years years<br />
Revenue Sources<br />
Budget<br />
3 years<br />
Passenger Fares $2,874,886 $3,058,053 $3,199,146 $3,106,966 $3,051,780 $3,856,173 $3,897,107 $3,574,868 $3,578,745 $3,650,320 $3,450,078 1.8% -2% -1.2%<br />
Special <strong>Transit</strong> Fares $1,547,052 $1,653,000 $1,605,319 $1,823,327 $1,782,662 $1,645,252 $2,166,861 $2,414,780 $2,488,779 $2,588,330 $2,823,253 6.2% 11% 5.3%<br />
Paratransit Fares $162,000 $200,000 $262,000 $228,770 $240,000 $360,000 $324,000 $295,500 $240,000 $249,600 $249,600 4.4% -7% -5.5%<br />
Highway 17 Fares $655,000 $819,413 $915,728 $915,728 $375,972 $326,458 $626,776 $688,145 $708,789 $843,723 18% 10.4%<br />
Highway 17 Payments $409,195 $442,330 $455,600 $462,526 4.2%<br />
Highway 17 VTA Payments $524,028 $337,242<br />
Highway 17 AMTRAK<br />
Payments $370,000<br />
Purchased Transportation<br />
Revenue $700,291 $140,309<br />
Commissions $9,000 $9,000 $11,000 $12,000 $10,000 $9,200 $7,400 $6,000 $6,000 $6,000 $6,000 -4.0% -8% 0.0%<br />
Advertising Income $100,000 $134,000 $158,000 $174,000 $138,000 $45,000 $50,000 $120,000 $120,000 $145,000 3.8% 42.6%<br />
Rent Income - SC Metro<br />
Center $63,157 $63,800 $84,000 $89,658 $92,000 $93,691 $95,745 $93,903 $83,373 $85,040 $85,040 3.0% -2% -3.3%<br />
Rent Income - Watsonville<br />
TC $45,303 $31,600 $50,000 $46,509 $47,000 $52,959 $47,877 $47,995 $48,516 $49,486 $49,486 0.9% -1% 1.0%<br />
Rent Income - General $6,355 $0 $7,200 $7,200 $7,200 $3,600 $9,600 $4,800 $4,800 $0 $0 -100%<br />
-<br />
100% -100%<br />
Interest Income $550,000 $770,000 $1,171,249 $737,000 $508,000 $300,000 $288,400 $428,000 $960,000 $1,008,000 $1,076,000 6.9% 29% 36.0%<br />
Other Non-Transportation<br />
Income $4,540 $43,865 $6,400 $1,800 $2,100 $2,100 $6,000 $4,500 $356,500 $367,195 $283,000 167% 297.7%<br />
Sales Tax $12,734,000 $13,900,000 $16,128,000 $15,290,422 $15,154,578 $15,759,000 $15,377,900 $15,839,237 $16,640,983 $17,306,622 $17,624,453 3.3% 2% 3.6%<br />
Sale of Assets $20,000 $0<br />
Transportation<br />
Development Act Funds $4,605,126 $4,674,062 $5,760,322 $5,767,827 $5,134,522 $5,392,889 $5,413,251 $5,677,686 $5,880,834 $6,116,067 $6,362,037 3.3% 3% 3.9%<br />
Special TDA Allocation $0 $150,000 $649,889 $417,878 $285,000 $285,000<br />
Other Local Funding $425,000 $0 $30,000<br />
State Guideway Funding<br />
(PVEA, TCI) $425,000 $450,000 $450,000<br />
FTA Section 5303 -<br />
Strategic Implementation $35,000<br />
FTA Section 5303 - Custom<br />
Info Serv <strong>Plan</strong> $35,000<br />
FTA Section 5303 - SRTP,<br />
Studies $42,072 $70,000 $70,000<br />
FTA Section 5307 -<br />
Operating Assistance $505,614 $505,614 $505,614 $1,229,934 $2,075,729 $2,804,435 $2,950,231 $3,091,556 $3,130,496 $3,287,021 $3,247,000 20.4% 3% 1.6%<br />
101015<br />
SANTA CRUZ SHORT RANGE TRANSIT PLAN WILBUR SMITH ASSOCIATES<br />
Page E - 6
APPENDIX E: FINANCIAL TABLES<br />
Adopted Budgets Historic MTD Budgets<br />
1998 1999 2000 2001 2002 2003 2004 2005 2006 2007 2008<br />
Average Annual<br />
Growth Rates<br />
Feb<br />
Revised<br />
Revised Final<br />
10 5<br />
Revised<br />
Final Revised Final Final Adopted<br />
Budget<br />
Budget Budget<br />
years years<br />
Revenue Sources<br />
Budget<br />
3 years<br />
Repay FTA Advance<br />
(5 years) ($70,000) ($70,000) ($70,000) ($70,000) 0.0%<br />
FTA Section 5311 - Rural<br />
Operating Assistance $36,604 $39,697 $42,448 $46,701 $46,701 $46,701 $92,928 $65,704 $168,582 $177,011 $149,335 15.1% 26% 31.5%<br />
Transfer from Capital/Proj<br />
Mgr $848,280 $94,000 $102,000 $102,000 $107,100 $112,455 $112,455 3.3%<br />
Subtotal Revenue Sources $19,571,771 $20,841,638 $25,124,122 $24,739,209 $23,215,830 $24,558,575 $24,436,332 $25,341,381 $27,722,184 $28,849,897 $29,069,806 4.0% 3.4% 4.7%<br />
annual change 6.5% 20.5% -1.5% -6.2% 5.8% -0.5% 3.7% 9.4% 4.1% 0.8%<br />
One Time Revenue<br />
Sources<br />
FTA Sec 5317 - Op<br />
Assistance $0 $17,785<br />
FTA Sec 5307 - One Time<br />
Advance $350,000<br />
Carryover of Paratransit<br />
Funding from Previous Year $100,000<br />
Carryover from Previous<br />
Year $450,000 $950,000 $800,000 $935,500 $649,817 $681,462 $911,228 -1% -0.9%<br />
Transfer from Reserves $1,200,000 $350,000 $0 $335,000<br />
Transfer from Insurance<br />
Reserves $35,000 $130,000 $100,000 $150,000 $150,000 $150,000 $150,000 $150,000 8% 0.0%<br />
AMBAG Funding (Intern &<br />
SRTP) $100,000<br />
Subtotal One Time<br />
Revenue Sources $0 $0 $0 $35,000 $1,880,000 $1,400,000 $1,300,000 $1,420,500 $799,817 $831,462 $1,179,013 -3% -6.0%<br />
annual change #DIV/0! #DIV/0! #DIV/0! 5271.4% -25.5% -7.1% 9.3% -43.7% 4.0% 41.8%<br />
Total Operating Revenue $19,571,771 $20,841,638 $25,124,122 $24,739,209 $23,215,830 $24,558,575 $24,436,332 $25,341,381 $27,722,184 $28,849,897 $29,069,806 4.0% 3% 4.7%<br />
annual change 6.5% 20.5% -1.5% -6.2% 5.8% -0.5% 3.7% 9.4% 4.1% 0.8%<br />
101015<br />
SANTA CRUZ SHORT RANGE TRANSIT PLAN WILBUR SMITH ASSOCIATES<br />
Page E - 7
Table H-6: <strong>METRO</strong> Year End Actuals* (FY 2003-2008)<br />
APPENDIX E: FINANCIAL TABLES<br />
Historic MTD Year<br />
End Actuals<br />
2003 2004 2005 2006 2007 2008<br />
Average Annual<br />
Growth Rates<br />
Operating Revenues<br />
5<br />
years<br />
3<br />
years<br />
1<br />
year<br />
Passenger Fares $3,055,479 $3,789,874 $3,535,298 $2,995,665 $3,406,079 $3,450,078 2.5% -1% 1.3%<br />
Special <strong>Transit</strong> Fares $1,837,234 $2,180,107 $2,285,492 $2,029,724 $2,837,936 $3,050,000 10.7% 10% 7.5%<br />
Paratransit Fares $210,280 $278,588 $243,553 $223,860 $229,100 $229,644 1.8% -2% 0.2%<br />
Highway 17 Revenues $795,312 $738,348 $1,056,368 $1,034,340 $1,257,385 $1,351,000 11.2% 9% 7.4%<br />
Sales Tax $15,187,728 $15,188,227 $15,686,399 $16,654,432 $17,652,773 $17,624,563 3.0% 4%<br />
-<br />
0.2%<br />
Transportation Development Act<br />
Funds $5,134,522 $5,337,724 $5,413,251 $5,740,612 $6,165,834 $6,362,036 4.4% 6% 3.2%<br />
FTA Section 5307 - Operating<br />
Assistance $1,229,934 $2,804,435 $2,950,231 $3,021,556 $3,130,226 $3,153,552 20.7% 2% 0.7%<br />
Subtotal Non-Operating<br />
Revenue $27,450,489 $30,317,303 $31,170,592 $31,700,189 $34,679,333 $35,220,873 5.1% 4% 1.6%<br />
annual change 10.4% 2.8% 1.7% 3.1% 1.6%<br />
* Review of historic year end actuals for operating revenues only focused on the key sources: Passenger fares, sales tax, TDA funds and Section 5307 funds.<br />
These sources provided approximately 82% of the agency’s operating revenue over the last 5 years.<br />
101015<br />
SANTA CRUZ SHORT RANGE TRANSIT PLAN WILBUR SMITH ASSOCIATES<br />
Page E - 8
APPENDIX E: FINANCIAL TABLES<br />
Table H-7: Historic and Projected Sales Tax Revenue (FY 1998-2006)<br />
1998 1999 2000 2001 2002 2003 2004 2005 2006<br />
Growth Rates<br />
8 5 3<br />
years years years<br />
Projected<br />
Sales Tax<br />
Revenue $12,563,316 $13,354,858 $14,807,812 $16,356,095 $15,095,441 $15,263,828 $15,135,227 $15,848,098 $16,583,132 3.5% 0.3% 2.8%<br />
Actual<br />
Sales Tax<br />
Revenue $12,734,000 $13,900,000 $16,128,000 $15,290,422 $15,154,578 $15,759,000 $15,377,900 $15,839,237 $16,640,983 3.4% 2.0% 1.8%<br />
Differenc<br />
e $ (170,684) $ (545,142)<br />
$(1,320,188<br />
) $ 1,065,673 $ (59,137) $ (495,172) $ (242,673) $ 8,861 $ (57,851)<br />
101015<br />
SANTA CRUZ SHORT RANGE TRANSIT PLAN WILBUR SMITH ASSOCIATES<br />
Page E - 9