Retinal Imaging and Image Analysis - Ophthalmology and Visual ...
Retinal Imaging and Image Analysis - Ophthalmology and Visual ...
Retinal Imaging and Image Analysis - Ophthalmology and Visual ...

Create successful ePaper yourself
Turn your PDF publications into a flip-book with our unique Google optimized e-Paper software.
IEEE REVIEWS IN BIOMEDICAL ENGINEERING, VOL. 3, 2010 169<br />
<strong>Retinal</strong> <strong>Imaging</strong> <strong>and</strong> <strong>Image</strong> <strong>Analysis</strong><br />
Michael D. Abràmoff, Senior Member, IEEE, Mona K. Garvin, Member, IEEE, <strong>and</strong> Milan Sonka, Fellow, IEEE<br />
Clinical Applications Review<br />
Abstract—Many important eye diseases as well as systemic<br />
diseases manifest themselves in the retina. While a number of<br />
other anatomical structures contribute to the process of vision, this<br />
review focuses on retinal imaging <strong>and</strong> image analysis. Following<br />
a brief overview of the most prevalent causes of blindness in the<br />
industrialized world that includes age-related macular degeneration,<br />
diabetic retinopathy, <strong>and</strong> glaucoma, the review is devoted<br />
to retinal imaging <strong>and</strong> image analysis methods <strong>and</strong> their clinical<br />
implications. Methods for 2-D fundus imaging <strong>and</strong> techniques for<br />
3-D optical coherence tomography (OCT) imaging are reviewed.<br />
Special attention is given to quantitative techniques for analysis of<br />
fundus photographs with a focus on clinically relevant assessment<br />
of retinal vasculature, identification of retinal lesions, assessment<br />
of optic nerve head (ONH) shape, building retinal atlases, <strong>and</strong> to<br />
automated methods for population screening for retinal diseases.<br />
A separate section is devoted to 3-D analysis of OCT images, describing<br />
methods for segmentation <strong>and</strong> analysis of retinal layers,<br />
retinal vasculature, <strong>and</strong> 2-D/3-D detection of symptomatic exudate-associated<br />
derangements, as well as to OCT-based analysis<br />
of ONH morphology <strong>and</strong> shape. Throughout the paper, aspects<br />
of image acquisition, image analysis, <strong>and</strong> clinical relevance are<br />
treated together considering their mutually interlinked relationships.<br />
Index Terms—Computer-aided diagnosis, fundus photography,<br />
optical coherence tomography (OCT), population screening,<br />
retina.<br />
I. INTRODUCTION<br />
T<br />
HE retina is a layered tissue lining the interior of the eye<br />
that enables the conversion of incoming light into a neural<br />
signal that is suitable for further processing in the visual cortex<br />
of the brain. It is thus an extension of the brain. The ability to<br />
image the retina <strong>and</strong> develop techniques for analyzing the images<br />
is of great interest. As its function requires the retina to see<br />
Manuscript received June 14, 2010; revised September 27, 2010; accepted<br />
September 28, 2010. Date of current version December 10, 2010. This work<br />
was supported in part by the National Institutes of Health, NIBIB <strong>and</strong> NEI<br />
grants R01-EB004640, R01-EY018853, R01 EY019112, by the Research to<br />
Prevent Blindness, by the Institute for Vision Research, University of Iowa, by<br />
the Department of Veterans’ Affairs Center of Excellence for the Treatment <strong>and</strong><br />
Prevention of <strong>Visual</strong> Loss, <strong>and</strong> by the Department of Veterans’ Affairs Merit<br />
program.<br />
M. D. Abràmoff is with the Department of <strong>Ophthalmology</strong> <strong>and</strong> <strong>Visual</strong> Sciences,<br />
the Department of Electrical <strong>and</strong> Computer Engineering, <strong>and</strong> the Department<br />
of Biomedical Engineering, The University of Iowa, Iowa City, IA 52242<br />
USA <strong>and</strong> the Veterans’ Administration.<br />
M. K. Garvin is with the Department of Electrical <strong>and</strong> Computer Engineering,<br />
The University of Iowa, Iowa City, IA 52242 USA <strong>and</strong> the Center of Excellence<br />
for Prevention <strong>and</strong> Treatment of <strong>Visual</strong> Loss, Veterans’ Administration.<br />
M. Sonka is with the Department of Electrical <strong>and</strong> Computer Engineering,<br />
the Department of <strong>Ophthalmology</strong> <strong>and</strong> <strong>Visual</strong> Sciences, <strong>and</strong> the Department of<br />
Radiation Oncology, The University of Iowa, Iowa City, IA 52242 USA.<br />
Digital Object Identifier 10.1109/RBME.2010.2084567<br />
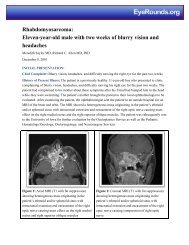
Fig. 1. First known image of human retina as drawn by Van Trigt in 1853 [1].<br />
the outside world, the involved ocular structures have to be optically<br />
transparent for image formation. Thus, with proper techniques,<br />
the retina is visible from the outside, making the retinal<br />
tissue, <strong>and</strong> thereby brain tissue, accessible for imaging noninvasively<br />
(Fig. 1). Because the retina’s function makes it a highly<br />
metabolically active tissue with a double blood supply, the retina<br />
allows direct noninvasive observation of the circulation.<br />
Thus, because of its architecture—dictated by its function—<br />
both diseases of the eye, as well as diseases that affect the circulation<br />
<strong>and</strong> the brain can manifest themselves in the retina. These<br />
include ocular diseases, such as macular degeneration <strong>and</strong> glaucoma,<br />
the first <strong>and</strong> third most important causes of blindness in<br />
the developed world. A number of systemic diseases also affect<br />
the retina. Complications of such systemic diseases include diabetic<br />
retinopathy from diabetes, the second most common cause<br />
of blindness in the developed world, hypertensive retinopathy<br />
from cardiovascular disease, <strong>and</strong> multiple sclerosis. Thus, on the<br />
one h<strong>and</strong>, the retina is vulnerable to organ-specific <strong>and</strong> systemic<br />
diseases, while on the other h<strong>and</strong>, imaging the retina allows diseases<br />
of the eye proper, as well as complications of diabetes,<br />
hypertension <strong>and</strong> other cardiovascular diseases, to be detected,<br />
diagnosed <strong>and</strong> managed.<br />
This review focuses on quantitative approaches to retinal<br />
image analysis. Principles of 2-D <strong>and</strong> 3-D retinal imaging are<br />
outlined first. Special emphasis is given to fundus <strong>and</strong> optical<br />
1937-3333/$26.00 © 2010 IEEE
170 IEEE REVIEWS IN BIOMEDICAL ENGINEERING, VOL. 3, 2010<br />
The blood supply of the retina is primarily ( 65%) through the<br />
choroid <strong>and</strong> secondarily ( 35%) through the retinal vasculature<br />
which lies on top of the retina. It is useful to divide the retina<br />
<strong>and</strong> choroid into the following layers:<br />
1) internal limiting membrane;<br />
2) nerve fiber layer (the axons of the ganglion cells, that<br />
transmit the visual signal to the lateral geniculate nucleus<br />
<strong>and</strong> thence the visual cortex);<br />
3) ganglion cell layer (the cell bodies of the ganglion cells);<br />
4) inner plexiform layer (the axons of the bipolar cells);<br />
5) inner nuclear layer (the cell bodies of the bipolar <strong>and</strong> horizontal<br />
cells);<br />
6) outer plexiform layer (the dendrites of the horizontal cells<br />
<strong>and</strong> the inner segments of the rod <strong>and</strong> cone photoreceptor<br />
cells);<br />
7) outer nuclear layer (cell bodies—outer segments—of the<br />
photoreceptor cells);<br />
8) external limiting membrane;<br />
9) pigment epithelium;<br />
10) Bruch’s membrane;<br />
11) capillary choroid (capillaries of the choroid);<br />
12) choroid plexus.<br />
Most of the retinal layers can be seen on optical coherence tomography<br />
(OCT) images (Section V). However, imaging of the<br />
capillary choroid <strong>and</strong> choroid plexus, though available in a research<br />
setting, cannot yet be done with commercially available<br />
devices.<br />
Fig. 2. Illustration of eye anatomy <strong>and</strong> retinal layers [2], [3]. (a) Cross-sectional<br />
view of eye <strong>and</strong> its major structures. Retina is a thin transparent tissue<br />
that lines the back of the eye <strong>and</strong> is comprised of a number of layers, as illustrated<br />
in enlarged portion. (b) Schematic drawing of cellular layers of retina. (a)<br />
Two-dimensional illustration of eye anatomy. (b) Schematic of retinal layers.<br />
Illustrations from Kolb [3] used with kind permission of Sigma Xi, The Scientific<br />
Research Society, Research Triangle Park, NC.<br />
coherence tomography (OCT) image analysis <strong>and</strong> its use to<br />
provide comprehensive descriptions of retinal morphology <strong>and</strong><br />
function. The described methods cover the developments of the<br />
past decade <strong>and</strong> were selected with respect to their potential<br />
for screening-motivated computer-aided detection of retinal<br />
abnormalities as well as for translational clinical applications<br />
including improved retinal disease diagnoses <strong>and</strong> image-guided<br />
retinal therapy. As such, the methods presented are expected to<br />
influence routine clinical patient care in the years to come.<br />
A. Eye Anatomy<br />
This review focuses on the retina, nevertheless, a brief review<br />
of gross eye anatomy is in place (Fig. 2). The visible parts of the<br />
eye include the transparent cornea, the normally white sclera,<br />
the colored (blue, green, brown or a mixture of these) iris, <strong>and</strong> an<br />
opening in the iris, the normally black pupil. A ray of light, after<br />
passing through the cornea, which partially focuses the image,<br />
passes through the anterior chamber, the pupil, the lens, which<br />
focuses the image further, the vitreous <strong>and</strong> is then focused on the<br />
retina. The retina itself is supported by its retinal pigment epithelium,<br />
which is normally opaque, the choroid <strong>and</strong> the sclera.<br />
B. <strong>Retinal</strong> Manifestations of Eye <strong>and</strong> Systemic Disease<br />
Many important diseases manifest themselves in the retina<br />
<strong>and</strong> originate either in the eye, the brain, or the cardiovascular<br />
system. A brief overview of the most prevalent diseases that can<br />
be studied via eye imaging <strong>and</strong> image analysis follows.<br />
1) Diabetes: Diabetes mellitus, according to the current definition<br />
from the World Health Organization [4], is typically diagnosed<br />
if a patient has a fasting plasma glucose over 7.0 mmol/l.<br />
Its causes are not fully understood, but genetic background, obesity,<br />
<strong>and</strong> sedentary lifestyle all confer increased risk of developing<br />
diabetes. Treatment is primarily through diet changes, administration<br />
of insulin <strong>and</strong>/or anti-hyperglycemic drugs. Hyperglycemia,<br />
the presence of elevated blood glucose, is known to<br />
damage small <strong>and</strong> large blood vessels, as well as nerve cells, <strong>and</strong><br />
thereby damages the kidneys, heart, brain <strong>and</strong> eyes, <strong>and</strong> results<br />
in a retinal complication of diabetes called diabetic retinopathy.<br />
2) Diabetic Retinopathy: Diabetic retinopathy (DR) is a<br />
complication of diabetes mellitus <strong>and</strong> the second most common<br />
cause of blindness <strong>and</strong> visual loss in the U.S., <strong>and</strong> the most<br />
important cause in the working age population. The number of<br />
patients with diabetes in the U.S. is increasing rapidly <strong>and</strong> in<br />
2007 reached 23.5 million [5]–[7]. There is abundant evidence<br />
that blindness <strong>and</strong> visual loss in these patients can be prevented<br />
through annual screening <strong>and</strong> early diagnosis [8]. In the eye,<br />
hyperglycemia damages the retinal vessel walls, which can lead<br />
to:<br />
1) ischemia, resulting in the growth of new blood vessels,<br />
which may subsequently bleed <strong>and</strong>/or cause retinal detachment,<br />
a condition called proliferative diabetic retinopathy;
ABRÀMOFF et al.: RETINAL IMAGING AND IMAGE ANALYSIS 171<br />
2) breakdown of the blood-retinal barrier, leading to fluid<br />
leakage, diabetic macular edema (DME) <strong>and</strong> damage to<br />
photoreceptors.<br />
The primary cause of visual loss in people with diabetes is DME,<br />
which is more common in type 2 diabetes. The breakdown of<br />
the blood-retinal barrier causes leakage of dilated hyperpermeable<br />
capillaries <strong>and</strong> microaneurysms into intracellular <strong>and</strong> extracellular<br />
retinal tissue with subsequent fluid accumulation [9],<br />
[10]. Clinically significant macular edema (CSME) occurs if<br />
there is thickening of the retina involving the center of the retina<br />
(macula) or the area within 500 m of the center, if there are<br />
hard exudates at or within 500 m of the center with thickening<br />
of adjacent retina, or if there is a zone of retinal thickening one<br />
optic disc area or larger in size, any part of which is within one<br />
disc diameter of the center of the retina [9]. This definition of<br />
CSME generally refers to the threshold level at which laser photocoagulation<br />
treatment is considered. While visual loss occurs<br />
when macular edema involves the visual center, lesser degrees<br />
of DME may cause visual deterioration.<br />
It is clear that DME affects macular structure in both the short<br />
<strong>and</strong> long term. The leaking exudate in DME initially enters the<br />
cytoplasm of Müller’s cells (radial glial cells of the retina), preferentially<br />
in the outer retina, though fluid accumulation has been<br />
found to extend through most macular layers in more advanced<br />
stages of DME [11]. Cysts (retinal extracellular fluid) occur predominantly<br />
in the outer retina. Over time, cysts tend to fuse <strong>and</strong><br />
extend from the outer into the inner retina. In these cases, atrophy<br />
or apoptosis of the remaining retinal tissue occurs [11],<br />
[12]. Serous detachment may occur in 20% of DME cases<br />
<strong>and</strong> does not seem to correlate with visual acuity. Hard exudates<br />
can occur <strong>and</strong> tend to be located at the level of the outer<br />
plexiform layer. Patients with longst<strong>and</strong>ing DME with impaired<br />
visual acuity show decreased directional sensitivity of photoreceptors<br />
<strong>and</strong> decreased visual pigment density [13].<br />
The management of diabetes primarily involves lowering of<br />
blood sugar, through diet, lifestyle changes <strong>and</strong> anti-diabetic<br />
drugs. If DR is present, management of CSME <strong>and</strong> proliferative<br />
DR through laser photocoagulation, administration of anti-vascular<br />
growth factors, <strong>and</strong> of steroids have been shown in large<br />
r<strong>and</strong>omized clinical trials to prevent blindness <strong>and</strong> further visual<br />
loss [9], [14]–[16].<br />
3) Age-Related Macular Degeneration: Age-related macular<br />
degeneration (AMD) is the most common cause of visual loss in<br />
the U.S. <strong>and</strong> is a growing public health problem. Currently, almost<br />
7.3 million Americans (6.12% of Americans aged 40 years<br />
<strong>and</strong> older) have some form of AMD, <strong>and</strong> AMD is the cause of<br />
blindness for 54% of all legally blind Americans [17]. Severe<br />
AMD reduces the likelihood of employment by 61% <strong>and</strong> salary<br />
by 39%, while mild AMD reduces these by 44% <strong>and</strong> 32%, respectively.<br />
The estimated annual cost burden from AMD in the<br />
U.S. has been estimated as $30 billion [18]. The prevalence of<br />
AMD is expected to double over the next 25 years [5]. The two<br />
major forms are dry <strong>and</strong> wet AMD, of which dry AMD typically<br />
leads to gradual loss of visual acuity. Wet AMD, also called<br />
choroidal neovascularization (CNV), is the most visually threatening<br />
form, characterized by ingrowth of a choroidal vascular<br />
structure into the macula accompanied by increased vascular<br />
permeability. The increase in vascular permeability leads to abnormal<br />
fluid collection within or below the retina that causes visual<br />
dysfunction when it involves the center of the macula. The<br />
natural course of CNV is rapidly deteriorating acuity, scarring<br />
of the pigment epithelium, <strong>and</strong> permanent visual loss or blindness.<br />
Progression of dry AMD can be slowed in many patients<br />
through dietary supplements [19], while visual loss from wet<br />
AMD is treated with intravitreal administration of anti-vascular<br />
growth factor [20], [21].<br />
4) Glaucoma: Glaucoma is the third leading cause of blindness<br />
in the U.S., characterized by gradual damage to the optic<br />
nerve <strong>and</strong> resultant visual field loss [22]. Early diagnosis <strong>and</strong><br />
optimal treatment have been shown to minimize the risk of visual<br />
loss due to glaucoma [23]. Glaucoma is primarily a neuropathy,<br />
not a retinopathy, <strong>and</strong> acts on the retina by damaging<br />
ganglion cells <strong>and</strong> their axons. The hallmark of glaucoma is cupping<br />
of the optic disc, which is the visible manifestation of the<br />
optic nerve head (ONH) 3-D structure. The optic disc can be<br />
imaged two-dimensionally either through indirect stereo biomicroscopy<br />
or with stereo color fundus photography. The ratio of<br />
the optic disc cup <strong>and</strong> neuroretinal rim surface areas in these images,<br />
called cup-to-disc ratio, is an important structural indicator<br />
for assessing the presence <strong>and</strong> progression of glaucoma. Glaucoma<br />
is typically treated with ocular pressure lowering drops,<br />
<strong>and</strong> in refractory cases through surgery.<br />
5) Cardiovascular Disease: Cardiovascular disease manifests<br />
itself in the retina in a number of ways. Hypertension <strong>and</strong><br />
atherosclerosis cause changes in the ratio between the diameter<br />
of retinal arteries <strong>and</strong> veins, known as the A/V ratio. A decrease<br />
in the A/V ratio, i.e., thinning of the arteries <strong>and</strong> widening of the<br />
veins, is associated with an increased risk of stroke <strong>and</strong> myocardial<br />
infarction [24], [25]. Hypertension can also invoke direct<br />
retinal ischemia, which causes retinal infarcts visible as cotton<br />
wool spots <strong>and</strong> choroidal infarcts visible as deep retinal white<br />
spots. In addition, systemic vascular disease can cause arterial<br />
<strong>and</strong> venous occlusions, known as central <strong>and</strong> branch arterial occlusions<br />
(CRAO, BRAO) <strong>and</strong> central <strong>and</strong> branch venous occlusions<br />
(CRVA, BRVO).<br />
C. History of <strong>Retinal</strong> <strong>Imaging</strong><br />
Somewhat paradoxically, the optical properties of the eye that<br />
allow image formation prevent direct inspection of the retina.<br />
In other words, the very nature of the imaging transform resulting<br />
in a focused image on the retinal surface disallows depiction<br />
of the retina when attempting to form a focused retinal<br />
image from the outside via usage of the inverse transform. The<br />
red reflex, when a blurred reflection of the retina makes the<br />
pupil appear red if light is shined into the eye at the appropriate<br />
angle, was known for centuries. However, special techniques<br />
are needed to obtain a focused image of the retina. The<br />
first attempt to image the retina in a cat was completed by the<br />
French physician Jean Mery, who showed that if a live cat is<br />
immersed in water, its retinal vessels are visible from the outside.<br />
The impracticality of such an approach for humans lead to<br />
the invention of the principles of the ophthalmoscope in 1823<br />
by Czech scientist Jan Evangelista Purkyně (frequently spelled<br />
Purkinje) <strong>and</strong> its reinvention in 1845 by Charles Babbage [26],<br />
[27]. Note that Babbage also originated the concept of a pro-
172 IEEE REVIEWS IN BIOMEDICAL ENGINEERING, VOL. 3, 2010<br />
Fig. 3. Early drawing of retinal vasculature including outlines of ONH <strong>and</strong><br />
fovea published by Purkyně in 1823 [30].<br />
grammable computer <strong>and</strong> thus the link between computation<br />
[28] <strong>and</strong> retinal imaging is not a new one. Finally, the ophthalmoscope<br />
was reinvented again <strong>and</strong> reported by von Helmholtz in<br />
1851 [29]. Thus, inspection <strong>and</strong> evaluation of the retina became<br />
routine for ophthalmologists, <strong>and</strong> the first images of the retina<br />
(Fig. 1) were published by the Dutch ophthalmologist van Trigt<br />
in 1853 [1]. Earlier sketches by Purkyně provided drawings of<br />
his own retinal vasculature [30] (Fig. 3).<br />
Because of the prevalence of infectious diseases at the time<br />
<strong>and</strong> because the ophthalmoscope required the physician to come<br />
close to the face of the patient, it was attractive to image the<br />
eye photographically. The first useful photographic images of<br />
the retina, showing blood vessels, were obtained in 1891 by the<br />
German ophthalmologist Gerloff [31]. In 1910, Gullstr<strong>and</strong> developed<br />
the fundus camera, a concept still used to image the<br />
retina today [32]; he later received the Nobel Prize for this invention.<br />
Because of its safety <strong>and</strong> cost-effectiveness at documenting<br />
retinal abnormalities, fundus imaging has remained the primary<br />
method of retinal imaging.<br />
The next important development was the invention of fluorescein<br />
angiographic imaging, where a fundus camera with<br />
additional narrow b<strong>and</strong> filters is used to image a fluorescent<br />
dye injected into the bloodstream that binds to leukocytes [33].<br />
It remains widely used because it allows an underst<strong>and</strong>ing of<br />
the functional state of the retinal circulation. Concerns about<br />
safety <strong>and</strong> cost-effectiveness are leading it to be slowly replaced<br />
by tomographic imaging methods for its primary applications,<br />
namely image-guided treatment of macular edema <strong>and</strong> the “wet<br />
form” of macular degeneration.<br />
A major limitation of fundus photography is that it obtains<br />
a 2-D representation of the 3-D semi-transparent retinal tissues<br />
projected onto the imaging plane. The initial approach to depict<br />
the 3-D shape of the retina was stereo fundus photography, as<br />
first described by Allen in 1964 [34], where multi-angle images<br />
of the retina are combined by the human observer into a 3-D<br />
shape. Subsequently, confocal scanning laser ophthalmoscopy<br />
was developed, using the confocal aperture to obtain multiple<br />
images of the retina at different confocal depths, yielding estimates<br />
of 3-D shape. However, the optics of the eye limit the<br />
depth resolution of confocal imaging to approximately 100 m<br />
which is poor when compared with the typical 300–500 m<br />
thickness of the whole retina [35]. Tomographic imaging of the<br />
retina became commonplace with the development of super-luminescent<br />
diodes, femtosecond lasers <strong>and</strong> the application of<br />
optical coherence tomography (OCT) to retinal imaging [36],<br />
which allows truly 3-D optical sectioning of the retina [37].<br />
D. History of <strong>Retinal</strong> <strong>Image</strong> Processing<br />
Matsui et al. were the first to publish a method for retinal<br />
image analysis, primarily focused on vessel segmentation<br />
[38]. Their approach was based on mathematical morphology<br />
<strong>and</strong> they used digitized slides of fluorescein angiograms of<br />
the retina. In the following years, there were several attempts<br />
to segment other anatomical structures in the normal eye,<br />
all based on digitized slides. The first method to detect <strong>and</strong><br />
segment abnormal structures was reported in 1984, when Baudoin<br />
et al. described an image analysis method for detecting<br />
microaneurysms, a characteristic lesion of diabetic retinopathy<br />
[39]. Their approach was also based on digitized angiographic<br />
images. The work of Baudoin et al. detected microaneurysms<br />
using a “top-hat” transform, a step-type digital image filter<br />
[40]. The field dramatically changed in the 1990s with the<br />
development of digital retinal imaging <strong>and</strong> the expansion of<br />
digital filter-based image analysis techniques. These developments<br />
resulted in a rapidly increasing number of publications<br />
that is continuing to exp<strong>and</strong>.<br />
Closely related to retinal image analysis, the first multicenter,<br />
r<strong>and</strong>omized clinical trials in the history of ophthalmology, the<br />
Diabetic Retinopathy Study <strong>and</strong> especially the Early Treatment<br />
of Diabetic Retinopathy Study, showed the relevance of the<br />
thickness of retinal structures.<br />
II. CURRENT STATUS OF RETINAL IMAGING<br />
<strong>Retinal</strong> imaging has developed rapidly during the last 160<br />
years <strong>and</strong> is a now a mainstay of the clinical care <strong>and</strong> management<br />
of patients with retinal as well as systemic diseases.<br />
Fundus photography is widely used for population-based, large<br />
scale detection of diabetic retinopathy, glaucoma, <strong>and</strong> age-related<br />
macular degeneration. Optical coherence tomography<br />
(OCT) <strong>and</strong> fluorescein angiography are widely used in the diagnosis<br />
<strong>and</strong> management of patients with diabetic retinopathy,<br />
macular degeneration, <strong>and</strong> inflammatory retinal diseases. OCT<br />
is also widely used in preparation for <strong>and</strong> follow-up in vitreoretinal<br />
surgery.<br />
A. Fundus <strong>Imaging</strong><br />
We define fundus imaging as the process whereby a 2-D representation<br />
of the 3-D retinal semi-transparent tissues projected<br />
onto the imaging plane is obtained using reflected light. Thus,<br />
any process which results in a 2-D image, where the image intensities<br />
represent the amount of a reflected quantity of light, is<br />
fundus imaging. Consequently, OCT imaging (Section II-B) is<br />
not fundus imaging, while the following modalities/techniques<br />
all belong to the broad category of fundus imaging:<br />
1) fundus photography (including so-called red-free photography)—image<br />
intensities represent the amount of<br />
reflected light of a specific waveb<strong>and</strong>;<br />
2) color fundus photography—image intensities represent the<br />
amount of reflected R, G, <strong>and</strong> B waveb<strong>and</strong>s, as determined<br />
by the spectral sensitivity of the sensor;<br />
3) stereo fundus photography—image intensities represent<br />
the amount of reflected light from two or more different<br />
view angles for depth resolution;
ABRÀMOFF et al.: RETINAL IMAGING AND IMAGE ANALYSIS 173<br />
4) hyperspectral imaging—image intensities represent the<br />
amount of reflected light of multiple specific wavelength<br />
b<strong>and</strong>s;<br />
5) scanning laser ophthalmoscopy (SLO)—image intensities<br />
represent the amount of reflected single wavelength laser<br />
light obtained in a time sequence;<br />
6) adaptive optics SLO—image intensities represent the<br />
amount of reflected laser light optically corrected by<br />
modeling the aberrations in its wavefront;<br />
7) fluorescein angiography <strong>and</strong> indocyanine angiography—image<br />
intensities represent the amounts of emitted<br />
photons from the fluorescein or indocyanine green fluorophore<br />
that was injected into the subject’s circulation.<br />
1) Technical Challenges in Fundus <strong>Imaging</strong>: Since the retina<br />
is normally not illuminated internally, external illumination projected<br />
into the eye as well as the light reflected by the retina<br />
must traverse the pupillary plane. Thus the size of the pupil, the<br />
small opening in the iris usually between 2 <strong>and</strong> 8 mm in diameter,<br />
has always been the primary technical challenge in fundus<br />
imaging [32]. Fundus imaging is complicated by the fact that<br />
the illumination <strong>and</strong> imaging beams cannot overlap because that<br />
results in corneal <strong>and</strong> lenticular reflections diminishing or eliminating<br />
image contrast. Consequently, separate paths are used<br />
in the pupillary plane, resulting in optical apertures on the order<br />
of only a few millimeters. Because the resulting imaging setup<br />
is technically challenging, fundus imaging historically involved<br />
relatively expensive equipment <strong>and</strong> highly trained ophthalmic<br />
photographers. Over the last ten years or so, there has been a<br />
major effort to make fundus imaging more accessible, resulting<br />
in less dependence on such experience <strong>and</strong> expertise due to the<br />
following three most important developments:<br />
1) Move from film-based to digital imaging <strong>and</strong> as a consequence<br />
the importance of Picture Archiving <strong>and</strong> Communication<br />
Systems (PACS) increased in clinical ophthalmology,<br />
also allowing integration with electronic health<br />
records;<br />
2) Requirement for population-based early detection of<br />
retinal diseases using fundus imaging (Section IV-B);<br />
3) More straightforward operation of fundus cameras by nonophthalmic<br />
photographers due to non-mydriatic imaging,<br />
digital imaging with near-infrared focusing, <strong>and</strong> increasing<br />
reproducibility through st<strong>and</strong>ardized imaging protocols.<br />
Though st<strong>and</strong>ard fundus imaging is widely used, it is not suitable<br />
for retinal tomography, because of the mixed backscatter<br />
caused by the semi-transparent retinal layers. Consequently, the<br />
backscatter’s origin is decoupled from the specific retinal depth<br />
location.<br />
B. Optical Coherence Tomography <strong>Imaging</strong><br />
The principle of Optical Coherence Tomography (OCT) is the<br />
estimation of the depth at which a specific backscatter originated<br />
by measuring its time of flight. Backscatters are typically caused<br />
by differences in refractive index in transitions from one tissue<br />
to another. The backscatter from deeper tissues can be differentiated<br />
from backscatter originating at more superficial tissues<br />
because it takes longer for the light to arrive at the sensor. As<br />
the total retinal thickness is between 300–500 m, the differences<br />
in time of flight are very small <strong>and</strong> can only be measured<br />
through interferometry [36].<br />
OCT employs low-coherent light interferometry, also called<br />
white light interferometry—though the wavelengths used for<br />
OCT are usually slightly longer than visible light. Low-coherent<br />
light autocorrelates only for a short amount of time, or equivalently,<br />
for only a small number of wavelengths, while autocorrelation<br />
function values are essentially zero beyond that.<br />
Low-coherent illumination can be thought of as a train of<br />
highly autocorrelated overlapping “bursts” of light—each burst<br />
labeled by its unique autocorrelogram. While we use the term<br />
“burst” to make the description more intuitive, it is important<br />
to underst<strong>and</strong> that the low-coherent light is actually continuous<br />
<strong>and</strong> not pulsed. To determine the time delay of the low-coherent<br />
light that has backscattered from the retina, <strong>and</strong> thus the depth<br />
at which the backscatter occurred, the bursts are identified by<br />
their autocorrelation function. By splitting low coherent light<br />
optically, sending one reference beam to reflect from a mirror<br />
at a specific distance, the other to reflect from the tissues in<br />
the retina, non-zero cross-correlation (or interference) between<br />
the two reflected beams occurs only when their flight times are<br />
equal, being zero everywhere else because of the low coherence<br />
property. It is the envelope, or energy, of the non-zero interferogram<br />
that is converted into an intensity that represents the<br />
amount of backscatter from the image location<br />
where <strong>and</strong> equal the splitting ratio for the reference <strong>and</strong><br />
sample arm, respectively, is the source intensity, <strong>and</strong> the<br />
complex degree of coherence, equal to<br />
with being the center wavelength of <strong>and</strong> the width of<br />
in the frequency domain. Therefore, the amount of light coherence<br />
as measured (1) is inversely proportional to the depth that<br />
can be resolved: the less coherent the light, the narrower the autocorrelogram,<br />
<strong>and</strong> thus the narrower the peak in the cross-correlation<br />
with the reference arm. Wavelengths longer than visible<br />
light penetrate deeper into retinal <strong>and</strong> choroidal tissue, <strong>and</strong><br />
thus OCT technology is dependent on broadb<strong>and</strong> near infrared<br />
or even infrared light sources, such as super-luminescent LEDs.<br />
Commonly, a beam splitter is used to split the light into the<br />
two beams: a beam that reflects of the retinal tissue represents<br />
the sample arm <strong>and</strong> a beam that is reflected from the reference<br />
mirror is called the reference arm (Fig. 4). The interferogram<br />
energy between the reference <strong>and</strong> sample arms is converted<br />
into image intensities with a photo sensor, CCD, or a<br />
CMOS sensor. A depth scan, typically known as an A-scan using<br />
ultrasound terminology, with different intensities representing<br />
the backscatter at different depths, is created from the interferogram<br />
intensities. For 3-D imaging—same as in scanning laser<br />
ophthalmoscopy—the illuminating beam is moved across the<br />
retina, typically using galvanic mirrors that change the position<br />
in two directions (along <strong>and</strong> axes), resulting in a tomographic<br />
image with an A-scan for each <strong>and</strong> location.<br />
(1)<br />
(2)
174 IEEE REVIEWS IN BIOMEDICAL ENGINEERING, VOL. 3, 2010<br />
Fig. 4. Schematic diagram of OCT, with emphasis on splitting of the light,<br />
overlapping train of labeled bursts based on their autocorrelogram, <strong>and</strong> their<br />
interference after being reflected from retinal tissue as well as from the reference<br />
mirror (assuming the time delays of both paths are equal).<br />
Different approaches have been used to maximize the number<br />
of A-scans that can be obtained per unit of time, because reducing<br />
motion artifacts, patient comfort, <strong>and</strong> achieving high<br />
image resolution are all dependent on achieving short A-scan<br />
imaging intervals. Three main OCT principles were developed<br />
to create an A-scan for the desired tissue depth range.<br />
1) Time-domain OCT, or time-of-flight OCT, where the reference<br />
mirror is moved mechanically to different positions,<br />
resulting in different flight time delays for the reference<br />
arm light. Because the speed at which the mirror can be<br />
moved is mechanically limited, only thous<strong>and</strong>s of A-scans<br />
can be obtained per second. The envelope of the interferogram<br />
determines the intensity at each depth [36].<br />
2) Swept-source or time encoded frequency domain OCT,<br />
where instead of moving the reference arm, the light<br />
source is rapidly modulated over its center wavelength,<br />
essentially attaching a second label to the light, its wavelength.<br />
A photo sensor is used to measure the correlogram<br />
for each center wavelength over time. A Fourier transform<br />
on the multiwavelength or spectral interferogram is performed<br />
to determine the depth of all tissue scatters at the<br />
imaged location [41].<br />
3) Spectral-domain OCT is similar to swept-source OCT, but<br />
instead of modulating the light source wavelength, a broadb<strong>and</strong><br />
light source is used (broader than in time-domain<br />
OCT), <strong>and</strong> the interferogram is decomposed spectrally<br />
using (typically) diffraction grating <strong>and</strong> a CMOS or CCD<br />
linear sensor. The Fourier transform is again applied to the<br />
spectral correlogram intensities to determine the depth of<br />
each scatter signal [41].<br />
1) Three-Dimensional OCT <strong>Imaging</strong>: Originally, OCT<br />
imaging was highly limited by the amount of time it took to<br />
image an A-scan. Therefore the correlogram intensities were<br />
displayed to the user in the form of 2-D slices, called B-scans,<br />
with the A-scans in the B-scan obtained from a single sweep<br />
of the scanning beam over the retina in a linear or circular<br />
fashion. Increased A-scanning speed resulted in the possibility<br />
of increased numbers of B-scans per examination. The ability<br />
to image the retina two-dimensionally <strong>and</strong> three-dimensionally<br />
then depends on the number of A-scans that can be acquired<br />
over time. Because of motion artifacts such as saccades, safety<br />
requirements limiting the amount of light that can be projected<br />
onto the retina, <strong>and</strong> patient comfort, 1–3 seconds per image<br />
or volume is essentially the limit of acceptance. Thus, the<br />
commercially available time-domain OCT, which allowed<br />
collecting of up to 400 A-scans per second, has not yet been<br />
suitable for 3-D imaging. With spectral-domain OCT, tens of<br />
thous<strong>and</strong>s of A-scans can be acquired each second, <strong>and</strong> thus<br />
true 3-D imaging is routinely possible. Consequently, 3-D OCT<br />
is now in wide clinical use <strong>and</strong> has become the st<strong>and</strong>ard of care.<br />
With swept-source OCT, hundreds of thous<strong>and</strong>s of A-scans<br />
can be obtained every second, promising additional increase in<br />
image resolution when acquiring 3-D image volumes.<br />
2) Resolution, Isotropic <strong>Imaging</strong>: The transverse resolution<br />
of OCT scans (i.e., in the directions) depends on the speed<br />
<strong>and</strong> quality of the galvanic scanning mirrors <strong>and</strong> is typically<br />
20–40 m. The resolution of the A-scans along the direction<br />
depends on the coherence of the light source <strong>and</strong> is currently<br />
4–8 m in commercially available scanners.<br />
As explained above, obtaining 2-D or 3-D OCT images is<br />
largely a matter of the scanning speed versus the amount of<br />
time available for scanning. A crude 3-D volume was initially<br />
created by juxtaposing several B-scan slices spaced widely<br />
apart. With the advent of faster scanners, the spaces between<br />
B-scans were minimized <strong>and</strong> currently some commercially<br />
available scanners are capable of acquiring close-to-isotropic<br />
3-D volumes. Isotropic (isometric) means that the size of each<br />
imaged element, or voxel, is the same in all three dimensions.<br />
Current commercially available OCT devices routinely offer<br />
voxel sizes of 30 30 2 m, achieving isometricity in<br />
the plane only (note the difference between resolution<br />
<strong>and</strong> voxel size). Another way of explaining isotropicity (in<br />
the plane) is that the spacing between the acquired<br />
B-scans (in what we call the -dimension) is the same as the<br />
distance between each A-scan in the B-scans (in what we call<br />
the -dimension). Available SD-OCT scanners are never truly<br />
isotropic, because the retinal tissue in each A-scan is sampled at<br />
much smaller intervals in depth than are the distances between<br />
A- <strong>and</strong>/or B-scans. The resolution in depth (or what we call<br />
the -dimension) is currently always higher than the resolution<br />
in the plane. The primary advantage of isotropic<br />
imaging when quantifying properties of the retina is that fewer<br />
assumptions have to be made about the tissue in-between the<br />
measured samples, thus potentially leading to more accurate<br />
indices of retinal morphology.
ABRÀMOFF et al.: RETINAL IMAGING AND IMAGE ANALYSIS 175<br />
C. Areas of Active Research in <strong>Retinal</strong> <strong>Imaging</strong><br />
<strong>Retinal</strong> imaging is rapidly evolving <strong>and</strong> newly completed research<br />
results are quickly translated into clinical use. Much of<br />
the active research is beyond the scope of this review but several<br />
active directions deserve at least basic coverage.<br />
1) Portable, Cost-Effective Fundus <strong>Imaging</strong>: For early detection<br />
<strong>and</strong> screening, the optimal place for placing fundus cameras<br />
is where the patients are: medicine <strong>and</strong> family care clinics,<br />
rapid clinics in shopping malls, etc., Though the transition from<br />
film based to digital fundus imaging has revolutionized the art<br />
of fundus imaging <strong>and</strong> made telemedicine applications feasible,<br />
the current cameras are still too bulky, expensive <strong>and</strong> may be<br />
difficult to use for nontrained staff in places lacking ophthalmic<br />
imaging expertise. Several groups are attempting to create more<br />
cost-effective <strong>and</strong> easier-to-use h<strong>and</strong>held fundus cameras, employing<br />
a variety of technical approaches [42], [43].<br />
2) Functional <strong>Imaging</strong>: For the patient as well as for the<br />
clinician, the outcome of disease management is mainly concerned<br />
with the resulting organ function, not its structure. In<br />
ophthalmology, current functional testing is mostly subjective<br />
<strong>and</strong> patient dependent, such as assessing visual acuity <strong>and</strong> utilizing<br />
perimetry, which are all psychophysical metrics. Among<br />
more recently developed “objective” techniques, oxymetry is<br />
a hyper-spectral imaging technique, in which multispectral<br />
reflectance is used to estimate the concentration of oxygenated<br />
<strong>and</strong> deoxygenated hemoglobin in the retinal tissue [44]. The<br />
principle allowing to sense such differences is simple: deoxygenated<br />
hemoglobin reflects longer wavelengths better than<br />
does oxygenated hemoglobin. Nevertheless, measuring absolute<br />
oxygenation levels with reflected light is difficult because<br />
of the large variety in retinal reflection across individuals <strong>and</strong><br />
the variability caused by the imaging process. The retinal<br />
reflectance can be modeled by a system of equations, <strong>and</strong> this<br />
system is typically under-constrained if this variability is not accounted<br />
for adequately. Increasingly sophisticated reflectance<br />
models have been developed to correct for the underlying<br />
variability, with some reported success [45]. Near-infrared<br />
fundus reflectance in response to visual stimuli is another way<br />
to determine the retinal function in vivo <strong>and</strong> has been successful<br />
in cats. Initial progress was demonstrated in humans [46].<br />
3) Adaptive Optics: Through the evolutionary processes, the<br />
human eye <strong>and</strong> retina are well matched for optimal visual performance.<br />
The optical properties of the normal eye result in a<br />
point spread function width approximately the size of a photoreceptor.<br />
It is therefore impossible to image individual cells<br />
or cell structure using st<strong>and</strong>ard fundus cameras because of aberrations<br />
in the human optical system. Adaptive optics uses mechanically<br />
activated mirrors to correct the wavefront aberrations<br />
of the light reflected from the retina <strong>and</strong> thus has allowed individual<br />
photoreceptors to be imaged in vivo [47]. <strong>Imaging</strong> other<br />
cells, especially the clinically highly important ganglion cells,<br />
has so far been unsuccessful.<br />
4) Longer Wavelength OCT <strong>Imaging</strong>: Three-dimensional<br />
OCT imaging is now the clinical st<strong>and</strong>ard of care for several<br />
eye diseases. However, the wavelengths around 840 m used<br />
in currently available devices only allow imaging of the retina.<br />
Deeper structures, such as the choroidal vessels, which are<br />
important in AMD <strong>and</strong> uveitis, <strong>and</strong> the lamina cribrosa—a<br />
deep structure in the optic nerve relevant for glaucomatous<br />
damage—are not visualized. Because longer wavelengths<br />
penetrate deeper into the tissue, a major research effort has<br />
been invested to developing low-coherence swept-source lasers<br />
with center wavelengths of 1000–1300 m. Prototypes of these<br />
devices are already able to resolve detail in the choroid <strong>and</strong><br />
lamina cribrosa [48].<br />
III. DISEASE-SPECIFIC ANALYSIS OF RETINAL IMAGES<br />
The everyday cost associated with eye care providers’ decisions<br />
<strong>and</strong> the ever-increasing numbers of retinal images to be<br />
reviewed are the major motivations for the adoption of image<br />
analysis in ophthalmology. Clearly, since clinicians are costly<br />
experts, they need to optimize the time devoted to each patient,<br />
whether their cost is born by patients, third party insurers,<br />
or society as a whole. As presented in the following sections,<br />
the development of new imaging technology invariably results<br />
in rapidly increasing amounts of data collected as part of any<br />
specific retinal imaging exam. The amount of information provided<br />
by the current generation of scanners <strong>and</strong> cameras is already<br />
exceeding the limit of clinicians’ ability to fully utilize<br />
it. When factoring in that clinicians are subjective, <strong>and</strong> their<br />
decisions suffer from the inter- <strong>and</strong> intra-observer variability,<br />
the need for reliable computerized approaches to retinal image<br />
analysis is more than obvious, if for no other reason, than to<br />
increase the precision with which patients are managed. An additional<br />
important reason for incorporating automated analyses<br />
of retinal images in patient management is the potential societal<br />
benefit of increasing clinician productivity in a routine population<br />
screening setting. While the patient management decision<br />
making <strong>and</strong> population screening scenarios are somewhat different<br />
<strong>and</strong> specific, they both require quantitative retinal image<br />
analysis to be rapidly translated to everyday use.<br />
A. Early Detection of <strong>Retinal</strong> Disease From Fundus<br />
Photography<br />
The most obvious example of a retinal screening application<br />
is retinal disease detection, in which the patient’s retinas<br />
are imaged in a telemedicine remote manner. This scenario<br />
requires utilizing easy-to-use, relatively low-cost fundus cameras,<br />
automated analyses of the images, <strong>and</strong> focused reporting<br />
of the results. This screening application has spread rapidly<br />
over the last few years, with the exception of the automated<br />
analysis behavior, <strong>and</strong> is one of the most successful examples of<br />
telemedicine [49]. While screening programs exist for detection<br />
of glaucoma, age-related macular degeneration, <strong>and</strong> retinopathy<br />
of prematurity, the main screening application focuses on early<br />
detection of diabetic retinopathy.<br />
Early detection of diabetic retinopathy (Section I-B2) via<br />
population screening associated with timely treatment have<br />
been shown to prevent visual loss <strong>and</strong> blindness in patients<br />
with retinal complications of diabetes [50], [51]. Almost 50%<br />
of people with diabetes in the U.S. currently do not undergo<br />
any form of regular documented dilated eye exam, in spite of<br />
guidelines published by the American Diabetes Association,<br />
the American Academy of <strong>Ophthalmology</strong> <strong>and</strong> the American<br />
Optometric Association [52]. In the U.K., a smaller proportion<br />
or approximately 20% of diabetics are not regularly evaluated,
176 IEEE REVIEWS IN BIOMEDICAL ENGINEERING, VOL. 3, 2010<br />
as a result of an aggressive effort to increase screening for<br />
people with diabetes. Blindness <strong>and</strong> visual loss can be prevented<br />
through early detection <strong>and</strong> timely management. There<br />
is widespread consensus that regular early detection of diabetic<br />
retinopathy via screening is necessary <strong>and</strong> cost-effective in<br />
people with diabetes [8], [53]–[55]. Remote digital imaging<br />
<strong>and</strong> ophthalmologist expert reading have been shown to be<br />
comparable or superior to an office visit for assessing DR<br />
[56], [57] <strong>and</strong> have been suggested as an approach to make the<br />
dilated eye exam available to un- <strong>and</strong> under-served populations<br />
that do not receive regular exams by eye care providers. If all of<br />
these underserved populations were to be provided with digital<br />
imaging, the annual number of retinal images requiring evaluation<br />
would exceed 32 million in the U.S. alone (approximately<br />
40% of people with diabetes with at least two photographs per<br />
eye) [57], [58].<br />
In the next decade, projections for the U.S. are that the average<br />
age will increase, the number of people with diabetes in each age<br />
category will increase, <strong>and</strong> there will be an under-supply of qualified<br />
eye care providers, at least in the near term. Several European<br />
countries have successfully instigated in their health care systems<br />
early detection programs for diabetic retinopathy using digital<br />
photography with reading of the images by human experts. In<br />
the U.K., 1.7 million people with diabetes were screened for diabetic<br />
retinopathy in 2007–2008. In the Netherl<strong>and</strong>s, over 30 000<br />
people with diabetes were screened since 2001 in the same period,<br />
through an early detection project called EyeCheck [59].<br />
The United States Department of Veterans Affairs (VA) has deployed<br />
a successful photo screening program in the VA medical<br />
centers, through which more than 120 000 patients were screened<br />
in 2008. While the remote imaging followed by human expert diagnosis<br />
approach was shown successful for a limited number of<br />
participants, the current challenge is to make the early detection<br />
more accessible by reducing the cost <strong>and</strong> manpower required,<br />
while maintaining or improving DR detection performance. This<br />
challenge can be met by utilizing computer-assisted or fully automated<br />
methods for detection of DR in retinal images, as described<br />
in Section IV.<br />
B. Early Detection of Systemic Disease From Fundus<br />
Photography<br />
In addition to detecting diabetic retinopathy <strong>and</strong> age-related<br />
macular degeneration, it also deserves mention that fundus photography<br />
allows cardiovascular risk factors to be determined.<br />
Such metrics are primarily based on measurement of retinal<br />
vessel properties, such as the arterial to venous diameter ratio,<br />
or A-V ratio, <strong>and</strong> indicate the risk for stroke, hypertension or<br />
myocardial infarct [60], [61].<br />
C. Three-Dimensional OCT <strong>and</strong> <strong>Retinal</strong> Diseases—<strong>Image</strong><br />
Guided Therapy<br />
With the introduction of 3-D OCT imaging, the wealth of new<br />
information about the retinal morphology enabled its usage for<br />
close monitoring of retinal disease status <strong>and</strong> guidance of retinal<br />
therapies.<br />
The most obvious example of successful image-guided management<br />
in ophthalmology is its use in diabetic macular edema<br />
(DME). DME is a form of diabetic retinopathy in which visual<br />
loss occurs through leaking of fluid in the macula—the<br />
central part of the retina. The original research entitled Early<br />
Treatment in Diabetic Retinopathy Study [9], [62]–[64] demonstrated<br />
that early treatment of DME’s thickened areas of the<br />
retina with focal laser can prevent further visual loss. More recently,<br />
novel treatment using anti-VEGF agents (anti-vascular<br />
endothelial growth factor), such as ranibizumab combined with<br />
focal laser, has shown to be beneficial for treatment of DME.<br />
Currently, OCT imaging is widely used to determine the extent<br />
<strong>and</strong> amount of retinal thickening. We expect that detailed<br />
analyses of retinal layer morphology <strong>and</strong> texture from OCT similar<br />
to those described in Section V will allow direct imagebased<br />
treatment to be guided by computer-supported or automated<br />
quantitative analysis of OCT <strong>and</strong> subsequently optimized<br />
allowing personalized approach to retinal disease treatment to<br />
become a reality.<br />
Another highly relevant example of a blinding disease that<br />
will benefit from image guided therapy is choroidal neovascularization—the<br />
wet form of age related macular degeneration<br />
(Section I-B3). With the advent of the anti-VEGF agents<br />
ranibizumab <strong>and</strong> bevacizumab, it has become clear that outer<br />
retinal <strong>and</strong> subretinal fluid is the main indicator of a need for<br />
anti-VEGF retreatment [21], [65]–[67]. Several studies are underway<br />
to determine whether OCT-based quantification of fluid<br />
parameters <strong>and</strong> affected retinal tissue can help improve the management<br />
of patients with anti-VEGF agents.<br />
As described above, glaucoma is characterized by gradual<br />
damage to the optic nerve <strong>and</strong> resultant visual field loss<br />
(Section I-B4) [22]. Early diagnosis <strong>and</strong> optimal treatment have<br />
been shown to minimize the risk of visual loss due to glaucoma<br />
[23]. As shown below, 3-D analysis of the optic nerve head<br />
can be used for glaucoma management decisions. However,<br />
it has been previously shown that manual planimetry is time<br />
consuming with substantial inter-observer variability [68].<br />
Methods for automated assessment of the cup-to-disc ratio<br />
<strong>and</strong> for NCO-based ONH analyses from fundus photography<br />
<strong>and</strong> from 3-D OCT imaging are presented as follows. Their<br />
adoption for use in routine clinical care is highly desirable.<br />
IV. FUNDUS IMAGE ANALYSIS<br />
As discussed previously in Section II-A, fundus imaging is<br />
the most established way of retinal imaging. Until recently,<br />
fundus image analysis was the only source of quantitative<br />
indices reflecting retinal morphology. Subjects that lend themselves<br />
for fundus image analysis include:<br />
1) <strong>Image</strong> quality quantification:<br />
a) image quality verification;<br />
b) imaging artifact detection;<br />
c) iatrogenic lesion detection (laser scars, etc.).<br />
2) Location <strong>and</strong> segmentation of retinal structures:<br />
a) retinal vessels<br />
• vessel diameter;<br />
• artery <strong>and</strong> vein classification;<br />
• vessel occlusion detection.<br />
b) fovea<br />
c) optic disc
ABRÀMOFF et al.: RETINAL IMAGING AND IMAGE ANALYSIS 177<br />
Fig. 5. Automated vessel analysis. From left to right: fundus image; retinal specialist annotation; vesselness map from Staal algorithm [76]; vesselness map from<br />
direct pixel classification [73].<br />
• cup <strong>and</strong> rim;<br />
• cupping.<br />
3) Segmentation of abnormalities:<br />
a) blood vessel related abnormalities<br />
• hemorrhages;<br />
• microaneurysms;<br />
• neovascularizations;<br />
• nerve fiber infarcts (cottonwool spots).<br />
b) pigment epithelium related abnormalities<br />
• drusen;<br />
• hyper <strong>and</strong> hypopigmentation.<br />
c) choroid related abnormalities<br />
• nevus <strong>and</strong> melanoma detection;<br />
• uveitis related choroidal lesions.<br />
As this paper went to press, over 700 papers have been<br />
published on these subjects in fundus image analysis, <strong>and</strong><br />
discussing each one is beyond the scope of this review.<br />
Therefore, we have focused only on those fundamental tasks<br />
<strong>and</strong> related approaches to fundus image analysis that are<br />
actively researched by a large number of groups: retinal<br />
vessel detection (Section IV-A), retinal lesion detection<br />
(Section IV-B), construction of fundus-imaging-based retinal<br />
atlases (Section IV-C), <strong>and</strong> analysis of the optic nerve head<br />
morphology from fundus photographs (Section IV-E), in more<br />
detail. Registration of fundus images <strong>and</strong> change detection<br />
will be discussed in Section VI-A. In addition, individual<br />
methods have been combined into disease-detection systems,<br />
particularly for diabetic retinopathy [69]–[71].<br />
A. Detection of <strong>Retinal</strong> Vessels<br />
Automated segmentation of retinal vessels is a generally well<br />
understood problem, aided by the public availability of the annotated<br />
STARE [72] <strong>and</strong> DRIVE datasets [73] (Fig. 5) with hundreds<br />
of papers published [74], [75]. Pixel feature classification<br />
<strong>and</strong> identification of elongated structures has been highly successful<br />
in the detection of large <strong>and</strong> medium vessels [73], [76].<br />
Though not by design, the similarities among the different<br />
approaches to vessel detection are often not obvious at first, because<br />
of different terms used for the same concepts. For example,<br />
template matching, kernel convolution, detector correlation<br />
all describe the same concept explained in more detail in<br />
the following, though implementation details may vary.<br />
1) Pixel Feature Classification: Pixel feature classification is<br />
a machine learning technique that assigns one or more classes<br />
to the pixels in an image. Pixel classification uses multiple pixel<br />
features: numeric properties of a pixel <strong>and</strong> its surroundings.<br />
Pixel feature classification is typically performed using a supervised<br />
approach.<br />
Originally, pixel intensity was used as a single feature. More<br />
recently, -dimensional multifeature vectors are utilized including<br />
pixel contrast with the surrounding region, its proximity<br />
to an edge, <strong>and</strong> similarity. Two distinct stages are required for<br />
a supervised learning/classification algorithm to function: 1) a<br />
training stage, in which the algorithm “statistically learns” to<br />
correctly classify pixels from known classifications, <strong>and</strong> 2) a<br />
testing or classification stage in which the algorithm classifies<br />
previously unseen images. For proper assessment of supervised<br />
classification method functionality, training data <strong>and</strong> performance<br />
testing data sets must be completely disjoint [77].<br />
The -dimensional multifeature vectors are calculated for<br />
each pixel, frequently utilizing local convolutions with multiple<br />
Gaussian derivative, Gabor, or other wavelet kernels [78]. The<br />
image is thus transformed into an -dimensional feature space<br />
<strong>and</strong> pixels are classified according to their position in feature<br />
space. The resulting hard (categorical) or soft (probabilistic)<br />
classification is then used to either assign labels to each pixel<br />
(for example vessel or nonvessel in the case of hard classification),<br />
or to construct class-specific likelihood maps (e.g., a<br />
vesselness map for soft classification).<br />
For example, an image can be transformed into the<br />
Gaussian derivative space<br />
by convolution with<br />
Gaussian derivative kernels as follows:<br />
where represents convolution, is the relative<br />
scale, <strong>and</strong> is the Gaussian derivative kernel of order<br />
with orientation .<br />
The number of potential features in the multifeature vector<br />
that can be associated with each pixel is essentially infinite.<br />
One or more subsets of this infinite set can be considered optimal<br />
for classifying the image according to some reference<br />
st<strong>and</strong>ard. Hundreds of features for a pixel can be calculated in<br />
the training stage to cast as wide a net as possible, with algorithmic<br />
feature selection steps used to determine the most distinguishing<br />
set of features. Extensions of this approach include<br />
different approaches to subsequently classify groups of neighboring<br />
pixels by utilizing group properties in some manner, for<br />
(3)
178 IEEE REVIEWS IN BIOMEDICAL ENGINEERING, VOL. 3, 2010<br />
Fig. 6. Automated analysis of fundus photographs. (a) Fundus photograph showing several lesions typical of diabetic retinopathy. (b) Detection of red lesions<br />
(RL)—microaneurysms <strong>and</strong> hemorrhages. (c) Detection of bright lesions (BL)—lipoprotein exudates. (d) Detection of neovascularization (NVD) of the optic disc.<br />
(e) All automatically detected lesions shown.<br />
Fig. 7. Typical steps necessary for analysis of fundus images, in this case for early diabetic retinopathy. Top row from left to right: original image; detection of<br />
fovea <strong>and</strong> optic disc superimposed as yellow circles on the vesselness map; automatically detected red lesions indicated in shades of green, bright lesions in shades<br />
of blue. Bottom row: details of red <strong>and</strong> bright lesion detection steps shown in a small region of the image including pixel classification identifying suspect pixels,<br />
clustering of suspect pixels, <strong>and</strong> classification of clusters as lesions.<br />
example cluster feature classification, where the size, shape <strong>and</strong><br />
average intensity of the cluster may be used.<br />
2) Vessel Diameter <strong>and</strong> Vessel Tree <strong>Analysis</strong>: Because retinal<br />
vessel diameter <strong>and</strong> especially the relative diameters of arteries<br />
<strong>and</strong> veins are known to signal the risk of systemic diseases including<br />
stroke, accurate determination of retinal vessel diameters,<br />
as well as differentiation of veins <strong>and</strong> arteries have become<br />
more important, several semi-automated <strong>and</strong> automated<br />
approaches have now been published [24], [25], [79]. Other active<br />
areas of research include separation of arteries <strong>and</strong> veins,<br />
detection of small vessels with diameters of less than a pixel,<br />
<strong>and</strong> analysis of the complete vessel trees using graphs.<br />
B. Detection of <strong>Retinal</strong> Lesions<br />
In this section, we will primarily focus on detection of lesions<br />
in diabetic retinopathy. It has the longest history as a research<br />
subject in retinal image analysis. Fig. 6 shows examples<br />
of a fundus photograph with the typical lesions automatically<br />
detected. Many approaches used the following principle<br />
(Fig. 7): A transform of some kind is used for detecting c<strong>and</strong>idate<br />
lesions, after which a mathematical morphology template<br />
is utilized to characterize the c<strong>and</strong>idates. This approach<br />
or a modification thereof is in use in many algorithms for detecting<br />
DR <strong>and</strong> AMD [80]. Additional enhancements include<br />
the contributions of Spencer, Cree, Frame, <strong>and</strong> co-workers [81],<br />
[82]. They added preprocessing steps, such as shade-correction<br />
<strong>and</strong> matched filter post-processing to this basic framework, to<br />
improve performance. Algorithms of this kind function by detecting<br />
c<strong>and</strong>idate microaneurysms of various shapes, based on<br />
their response to specific image filters. A supervised classifier is<br />
typically developed to separate the valid microaneurysms from<br />
spurious or false responses. However, these algorithms were<br />
originally developed to detect the high-contrast signatures of<br />
microaneurysms in fluorescein angiogram images. The next important<br />
development resulted from applying a modified version<br />
of the top-hat algorithm to red-free fundus photographs rather<br />
than angiogram images, as was first described by Hipwell et al.<br />
[83]. They tested their algorithm on a large set of 3500 images<br />
<strong>and</strong> found a sensitivity/specificity operating point of 0.85/0.76.<br />
Once this step had been taken, development accelerated. The<br />
approach was further refined by broadening the c<strong>and</strong>idate detection<br />
transform, originally developed by Baudoin to detect<br />
c<strong>and</strong>idate pixels, to a multifilter filter-bank approach [73], [84].<br />
The filter responses are used to identify pixel c<strong>and</strong>idates using<br />
a classification scheme. Mathematical morphology <strong>and</strong> additional<br />
classification steps are applied to these c<strong>and</strong>idates to decide<br />
whether they indeed represent microaneurysms <strong>and</strong> hemorrhages.<br />
A similar approach was also successful in detecting<br />
other types of DR lesions, including exudates or cotton-wool<br />
spots, as well as drusen in AMD [85].
ABRÀMOFF et al.: RETINAL IMAGING AND IMAGE ANALYSIS 179<br />
Fig. 8. Red lesion pixel feature classification. (a) Part of green color plane of a fundus image. Shown are pieces of vasculature <strong>and</strong> several red lesions. Bright<br />
lesions called exudates are also a symptom of DR. Circles mark location of some of the red lesions in the image. (b) After subtracting median filtered version<br />
of the green plane large background gradients are removed. (c) All pixels with a positive value are set to zero to eliminate bright lesions in the image. Note that<br />
exudates often partially occlude red lesions. Non-occluded parts of red lesions show up clearly in this image. An example of this is marked with a rectangle.<br />
(d) Pixel classification result produced by contrast enhancement step. Non-occluded parts of hemorrhages are visible together with the vasculature <strong>and</strong> a number<br />
of red lesions.<br />
Fig. 9. Red lesion detection. (a) Thresholded probability map. (b) Remaining objects after connected component analysis <strong>and</strong> removal of large vasculature.<br />
(c) Shape <strong>and</strong> size of extracted objects in panel (b) does not correspond well with actual shape <strong>and</strong> size of objects in original image. Final region growing procedure<br />
is used to grow back actual objects in original image which are shown here. In (b) <strong>and</strong> (c), the same red lesions as in Fig. 8(a) are indicated with a circle.<br />
1) Detection of Red Lesions: Small red retinal lesions,<br />
namely microaneurysms <strong>and</strong> small retinal hemorrhages, are<br />
typical for diabetic retinopathy, hypertensive retinopathy, <strong>and</strong><br />
other retinal disorders such as idiopathic juxtafoveal teleangiectasia.<br />
The primary importance of small red lesions is that<br />
they are the leading indicators of diabetic retinopathy. Because<br />
they are difficult to differentiate for clinicians on st<strong>and</strong>ard<br />
fundus images from nonmydriatic cameras, hemorrhages <strong>and</strong><br />
microaneurysms are usually detected together <strong>and</strong> associated<br />
with a single combined label. Larger red lesions, primarily<br />
large hemorrhages <strong>and</strong> retinal neovascularizations are still<br />
problematic <strong>and</strong> are discussed in Section IV-B3.<br />
Historically, red lesion detection algorithms focused on detection<br />
of normal anatomical objects, especially the vessels, because<br />
they can locally mimic red lesions. Subsequently, a combination<br />
of one or more filtering operations combined with mathematical<br />
morphology is employed to detect red lesion suspects. In some<br />
cases, suspect red lesion are further classified in individual lesion<br />
types <strong>and</strong> refined algorithms are capable of detecting specific<br />
retinal structures <strong>and</strong> abnormalities as shown in Figs. 7–9.
180 IEEE REVIEWS IN BIOMEDICAL ENGINEERING, VOL. 3, 2010<br />
Initially, red lesions were detected in fluoroscein angiograms<br />
because their contrast against the background is much higher<br />
than that of microaneurysms in color fundus photography images<br />
[81], [82], [86]. Hemorrhages mask out fluorescence <strong>and</strong> present<br />
as dark spots in the angiograms. These methods employed a<br />
mathematical morphology technique that eliminated the vasculature<br />
from a fundus image but left possible microaneurysm<br />
c<strong>and</strong>idates untouched as first described in 1984 [39]. Later,<br />
this method was extended to high-resolution red-free fundus<br />
photographs by Hipwell et al. [83]. Instead of using morphology<br />
operations, a neural network was used, for example by Gardner<br />
et al. [87]. In their work, images are divided into 20 20 pixel<br />
grids <strong>and</strong> the grids are individually classified. Sinthanayothin et<br />
al. [88] applied a recursive region growing procedure to segment<br />
both the vessels <strong>and</strong> red lesions in a fundus image. A neural<br />
network was used to detect the vessels exclusively, <strong>and</strong> the<br />
remaining objects were labeled as microaneurysms.<br />
Niemeijer et al. [84] presented a hybrid scheme that used both<br />
the top-hat based method as well as a supervised pixel classification<br />
based method to detect the microaneurysm c<strong>and</strong>idates<br />
in color fundus photographs. This method allowed for the detection<br />
of larger red lesions (i.e., hemorrhages) in addition to<br />
the microaneurysms using the same system. A large set of additional<br />
features, including color, was added to those described in<br />
[82] <strong>and</strong> [86]. Using the features in a supervised classifier distinguished<br />
between real <strong>and</strong> spurious c<strong>and</strong>idate lesions. These<br />
algorithms can usually deal with overlapping microaneurysms<br />
because they give multiple c<strong>and</strong>idate responses.<br />
Other recent algorithms only detect microaneurysms <strong>and</strong><br />
forego a phase of detecting normal retinal structures like the<br />
optic disc, fovea <strong>and</strong> retinal vessels, which can act as confounders<br />
for abnormal lesions. Instead, the recent approaches<br />
find the microaneurysms directly [89] using template matching<br />
in wavelet-subb<strong>and</strong>s. In this approach, the optimal adapted<br />
wavelet transform is found using a lifting scheme framework.<br />
By applying a threshold on the matching result of the wavelet<br />
template, the microaneurysms are labeled. This approach has<br />
meanwhile been extended to explicitly account for false negatives<br />
<strong>and</strong> false positives [69]. Because it avoids detection of<br />
the normal structures, such algorithms can be very fast, on the<br />
order of less than a second per image.<br />
2) Detection of Bright Lesions: Often, bright lesions, defined<br />
as lesions brighter than the retinal background, can be found in<br />
the presence of retinal <strong>and</strong> systemic disease. Drusen are the hallmark<br />
of age-related macular degeneration, cotton wool spots are<br />
typical for diabetic retinopathy <strong>and</strong> hypertensive retinopathy,<br />
while lipoprotein exudates are most frequently seen in diabetic<br />
retinopathy, but also in Coats’ disease <strong>and</strong> other retinal disorders.<br />
To complicate the analysis, flash artifacts can be present<br />
as false positives for bright lesions. If the lipoprotein exudates<br />
would only appear in combination with red lesions, they would<br />
only be useful for grading diabetic retinopathy. The exudates<br />
can, however, in some cases appear as isolated signs of diabetic<br />
retinopathy in the absence of any other lesion. Therefore,<br />
their importance is strengthened <strong>and</strong> several computer-based<br />
systems to detect exudates have been proposed [80], [85], [87],<br />
[88], [90].<br />
Because the different types of bright lesions have different diagnostic<br />
importance <strong>and</strong> patient management implications, algorithms<br />
should be capable not only of detecting bright lesions,<br />
but also of differentiating among the bright lesion types. One<br />
example algorithm capable of detection <strong>and</strong> differentiation of<br />
bright lesions was reported in [85]. The algorithm is based on<br />
an earlier red lesion algorithm [84] <strong>and</strong> includes the following<br />
main steps.<br />
1) Classification—resulting in a lesion probability map that<br />
indicates the likelihood of each pixel to be part of a bright<br />
lesion.<br />
2) Lesion c<strong>and</strong>idate cluster detection—clustering pixels into<br />
highly probable lesion regions.<br />
3) True bright lesion detection—classifying each c<strong>and</strong>idate<br />
cluster as true lesion, based on cluster features such as surface<br />
area, length of major axis, mean gradient, st<strong>and</strong>ard deviation<br />
of pixel values, pixel contrast, Gaussian derivative<br />
responses, <strong>and</strong> local vesselness (as derived from a vessel<br />
segmentation map).<br />
4) Differentiation of lesions into drusen, exudates <strong>and</strong> cottonwool<br />
spots—a third classifier uses the features for classifying<br />
true bright lesions as well the number of red <strong>and</strong> true<br />
bright lesions in the image to determine the likelihood for<br />
the true bright lesion of specific types.<br />
Fig. 10 illustrates these steps. Compared to retinal experts, the<br />
algorithm performed with an area under the ROC curve of<br />
for detecting bright lesions. The performance of<br />
was achieved for the detection <strong>and</strong> differentiation<br />
of exudates, cotton-wool spots, <strong>and</strong> drusen, respectively.<br />
3) Detection of Rare, or Irregular, Lesions <strong>and</strong> Abnormalities:<br />
Performance of a system that has been developed for<br />
screening should not be evaluated based solely on its sensitivity<br />
<strong>and</strong> specificity for detection of that disease. Such metrics do<br />
not accurately reflect the complete performance in a screening<br />
setup. Rare, irregular, or atypical lesions often do not occur<br />
frequently enough in st<strong>and</strong>ard datasets to affect sensitivity <strong>and</strong><br />
specificity but can have huge health <strong>and</strong> safety implications.<br />
To maximize screening relevance, the system must therefore<br />
have a mechanism to detect rare, atypical, or irregular abnormalities,<br />
for example in DR detection algorithms [70]. For<br />
proper performance assessment, the types of potential false<br />
negatives—lesions that can be expected or shown to be incorrectly<br />
missed by the automated system—must be determined.<br />
While detection of red lesions <strong>and</strong> bright lesions is widely<br />
covered in the literature, detection of rare or irregular lesions,<br />
such as hemorrhages, neovascularizations, geographic atrophy,<br />
scars <strong>and</strong> ocular neoplasms has received much less attention,<br />
despite the fact that they all can occur in combination with<br />
diabetic retinopathy <strong>and</strong> other retinal diseases as well as in<br />
isolation. For example, presence of such lesions in isolated<br />
forms <strong>and</strong> without any co-occurrence of small red lesions are<br />
rare in DR [59] <strong>and</strong> thus missing these does not affect st<strong>and</strong>ard<br />
metrics of performance such as ROC curves to a measurable<br />
degree, except if these are properly weighted as corresponding<br />
to serious lesions.<br />
One suitable approach for detecting such lesions is to use a<br />
retinal atlas, where the image is routinely compared to a generic<br />
normal retina (Section IV-C). After building a retinal atlas by
ABRÀMOFF et al.: RETINAL IMAGING AND IMAGE ANALYSIS 181<br />
Fig. 10. Bright lesion detection algorithm steps performed to detect <strong>and</strong> differentiate<br />
“bright lesions.” From left to right: exudates, cotton-wool spots, <strong>and</strong><br />
drusen. From top to bottom: relevant regions in the retinal color image (all at<br />
same scale); a posteriori probability maps after first classification step; pixel<br />
clusters labeled as probable bright lesions (potential lesions); bottom row shows<br />
final labeling of objects as true bright lesions, overlaid on original image.<br />
registering the fundus images according to a disc, fovea <strong>and</strong> a<br />
vessel-based coordinate system, image properties at each atlas<br />
location from a previously unseen image can be compared to<br />
the atlas-based image properties. Consequently, locations can<br />
be identified as abnormal if groups of pixels have values outside<br />
the normal atlas range.<br />
C. <strong>Retinal</strong> Atlas<br />
Compared to other anatomic structures (e.g., the brain,<br />
heart, or lungs), the retina has a relatively small number of key<br />
anatomic structures (l<strong>and</strong>marks) visible using fundus camera<br />
imaging. Additionally, the expected shape, size, <strong>and</strong> color variations<br />
across a population is expected to be high. While there<br />
have been a few reports [91] on estimating retinal anatomic<br />
structure using a single retinal image, we are not aware of any<br />
published work demonstrating the construction of a statistical<br />
retinal atlas using data from a large number of subjects.<br />
The choice of atlas l<strong>and</strong>marks in retinal images may vary depending<br />
on the view of interest. Regardless, the atlas should represent<br />
most retinal image properties in a concise <strong>and</strong> intuitive<br />
way. Three l<strong>and</strong>marks can be used as the retinal atlas key features;<br />
the optic disc center, the fovea, <strong>and</strong> the main vessel arch<br />
defined as the location of the largest vein–artery pairs. The disc<br />
<strong>and</strong> fovea provide l<strong>and</strong>mark points, while the arch is a more<br />
complicated two-part curved structure that can be represented<br />
by its central axis. The atlas coordinate system then defines<br />
an intrinsic, anatomically meaningful framework within which<br />
anatomic size, shape, color, <strong>and</strong> other characteristics can be objectively<br />
measured <strong>and</strong> compared.<br />
Choosing either the disc center or fovea alone to define the<br />
atlas coordinate system would allow each image from the population<br />
to be translated so a pinpoint alignment can be achieved.<br />
Choosing both disc <strong>and</strong> fovea allows corrections for translation,<br />
scale, <strong>and</strong> rotational differences across the population. However,<br />
nonlinear shape variations across the population would not be<br />
considered—which can be accomplished when the vascular arch<br />
information is utilized. The end of the arches can be defined as<br />
the first major bifurcations of the arch branches. The arch shape<br />
<strong>and</strong> orientation vary from individual to individual <strong>and</strong> influence<br />
the structure of the remaining vessel network. Establishing an<br />
atlas coordinate system that incorporates the disc, fovea <strong>and</strong><br />
arches allows for translation, rotation, scaling, <strong>and</strong> nonlinear<br />
shape variations to be accommodated across a population.<br />
An isotropic coordinate system for the atlas is desirable so<br />
images can refer to the atlas independent of spatial pixel location<br />
by a linear one-to-one mapping. The radial-distortion-correction<br />
(RADIC) model [92] attempts to register images in a distortion-free<br />
coordinate system using a planar-to-spherical transformation,<br />
so the registered image is isotropic under a perfect<br />
registration, or quasi-isotropic allowing low registration error.<br />
As shown in Fig. 11, the fundus curvature can be represented<br />
in the registration result using the quadratic model, while the<br />
RADIC-based registration unfolds the curvature to put the registered<br />
image in an isotropic coordinate system. An isotropic<br />
atlas makes it independent of spatial location to map correspondences<br />
between the atlas <strong>and</strong> test image. The intensities in overlapping<br />
area are determined by a distance-weighted blending<br />
scheme [93].<br />
1) L<strong>and</strong>mark Statistics: <strong>Retinal</strong> images in clinical practice<br />
are acquired under diverse fundus camera settings subjected<br />
to saccadic eye movement; <strong>and</strong> with variable focal center,<br />
zooming, tilting, etc. Thus, atlas l<strong>and</strong>marks from training<br />
data need to be aligned to derive any meaningful statistical<br />
properties from the atlas. Since the projective distortion within<br />
an image is corrected during the pairwise registration, the<br />
inter-image variations in the registered images appear as the<br />
difference in the rigid coordinate transformation parameters of<br />
translation, scale <strong>and</strong> rotation.<br />
For each pair of l<strong>and</strong>marks <strong>and</strong> , where<br />
<strong>and</strong> , pinning all l<strong>and</strong>marks<br />
to an arbitrary point clears the translation. The centroid<br />
of the point cloud formed by l<strong>and</strong>marks is evaluated to get<br />
the fovea atlas location so every can be aligned to<br />
using the similarity transformation to remove the inter-image<br />
variations in scale <strong>and</strong> rotation. The steps of rigid coordinate<br />
alignment for each parameter are illustrated in Fig. 12. Consequently,<br />
an aligned pixel position is determined using as<br />
(4)
182 IEEE REVIEWS IN BIOMEDICAL ENGINEERING, VOL. 3, 2010<br />
Fig. 11. Registration of fundus image pair using (a) quadratic model <strong>and</strong> (b) RADIC model. Vessel center lines are overlaid for visual assessment of registration<br />
accuracy. This registration is performed to disk-centered <strong>and</strong> macula-centered images to provide an increased anatomic field of view.<br />
Fig. 12. Registration of anatomic structures according to increasing complexity of registration transform—500 retinal vessel images are overlaid <strong>and</strong> marked with<br />
one foveal point l<strong>and</strong>mark each (red spots). Rigid coordinate alignment by (a) translation, (b) translation <strong>and</strong> scale, <strong>and</strong> (c) translation, scale, <strong>and</strong> rotation.<br />
where , , <strong>and</strong> are the differences in scale, rotation<br />
<strong>and</strong> translation measured between point pairs of<br />
<strong>and</strong> , <strong>and</strong> the rotation matrix is defined as<br />
.<br />
2) Coordinate Mapping: The atlas l<strong>and</strong>marks serve as the<br />
reference set so each color fundus image can be mapped to the<br />
coordinate system defined by the l<strong>and</strong>marks. As the last step of<br />
atlas generation, color fundus images are warped to the atlas<br />
coordinate system so that the arch of each image is aligned to<br />
the atlas vascular arch. A thin-plate-spline (TPS) [94] is used in<br />
this method for mapping retinal images to the atlas coordinate<br />
system. Rigid coordinate alignment as described above is done<br />
for each fundus images to register the disc center <strong>and</strong> the fovea.<br />
The seven control points required for TPS are determined by<br />
sampling points from equidistant locations in radial directions<br />
centered at the disc center. Consequently, 16 (1 at disc center,<br />
1 at fovea, <strong>and</strong> 2 7 on vascular arch) control points are used<br />
to calculate the TPS. Usually, the sampling uses smoothed trace<br />
lines utilizing third order polynomial curve fitting because naive<br />
traces of vascular arch lines could have locally high tortuosity,<br />
which may cause large geometric distortions by TPS. Fig. 13<br />
illustrates retinal image mapping process by TPS—the vessel<br />
main arch that runs along the naive trace (yellow line) is mapped<br />
onto the atlas vessel arch (green) line.<br />
3) Using <strong>Retinal</strong> Atlas to Detect Grossly Abnormal Retina:<br />
By creating a retinal atlas using this method, the atlas can be<br />
used as a reference to quantitatively assess the level of deviation<br />
from normality. An analyzed image can be compared with the<br />
retinal atlas directly in the atlas coordinate space. The normality<br />
can thus be defined in several ways depending on the application<br />
purpose—using local or global chromatic distribution, degree of<br />
vessel tortuosity, presence of pathological features, presence of<br />
artifacts, etc. Fig. 14 shows an example application driven by<br />
a retinal atlas, the region where imaging artifacts are present<br />
are highlighted. The atlas was created from 1000 color fundus<br />
images (two fields per left eye, from 500 subjects without retinal<br />
parthology or imaging artifacts).<br />
Other uses for a retinal atlas include image quality detection<br />
<strong>and</strong> disease severity assessment. <strong>Retinal</strong> atlases can also be employed<br />
in content-based image retrieval leading to abnormality<br />
detection in retinal images [95].
ABRÀMOFF et al.: RETINAL IMAGING AND IMAGE ANALYSIS 183<br />
Fig. 13. Atlas coordinate mapping by TPS: (a) before <strong>and</strong> (b) after mapping. Naive main arch traces obtained by Dijkstra’s line-detection algorithm are drawn as<br />
yellow lines that undergo polynomial curve fitting to result in blue lines. Atlas l<strong>and</strong>marks (disc center, fovea, <strong>and</strong> vascular arch) are drawn in green, <strong>and</strong> equidistant<br />
radial sampling points marked with dots.<br />
Fig. 14. Example application of employing retinal atlas to detect imaging artifacts. (a), (c) Color fundus images with artifacts. (b), (d) Euclidean distance maps<br />
in atlas space using atlas coordinate system. Note that distances are evaluated within atlas image. Consequently, field of view of distance map is not identical to<br />
that of fundus image.<br />
D. Assessing Performance of Fundus <strong>Image</strong> <strong>Analysis</strong><br />
Algorithms<br />
Fundus lesion detection algorithms are primarily intended<br />
to perform automatically <strong>and</strong> autonomously. In other words,<br />
some retinal images may never be seen by a human expert.<br />
Consequently, high dem<strong>and</strong>s must be placed on the fundus lesion<br />
detection system since the performed diagnostic decisions<br />
may have vision-threatening consequences. Lesion detection<br />
systems are most commonly employed for diabetic retinopathy<br />
screening. In all such systems, a high level of confidence in<br />
the agreement between the system <strong>and</strong> expert human readers<br />
is required. In reality, the agreement between an automatic<br />
system <strong>and</strong> an expert reader may be affected by many influences—system<br />
performance may become impaired due to the<br />
algorithmic limitations, the imaging protocol, properties of the<br />
camera used to acquire the fundus images, <strong>and</strong> a number of<br />
other causes. For example, an imaging protocol that does not<br />
allow small lesions to be depicted <strong>and</strong> thus detected will lead to<br />
an artificially overestimated system performance if such small<br />
lesions might have been detected with an improved camera or<br />
better imaging protocol. Such a system then appears to perform<br />
better than it truly does if human experts <strong>and</strong> the algorithm both<br />
overlook true lesions.<br />
The performance of a lesion detection system can be measured<br />
by its sensitivity, a number between 0 <strong>and</strong> 1, which is the<br />
number of true positives divided by the sum of the total number<br />
of (incorrectly missed) false negatives plus the number of (correctly<br />
identified) true positives [77]. System specificity, also a<br />
number between 0 <strong>and</strong> 1, is determined as the number of true<br />
negatives divided by the sum of the total number of false positives<br />
(incorrectly identified as disease) <strong>and</strong> true negatives. Sensitivity<br />
<strong>and</strong> specificity assessment both require ground truth,<br />
which is represented by location-specific discrete values (0 or<br />
1) of disease present/absent for each subject in the evaluation<br />
set.<br />
The location-specific output of an algorithm can also be represented<br />
by a discrete number (0 or 1). However, the output<br />
of the assessment algorithm is often a continuous value determining<br />
the likelihood of local disease presence, with an associated<br />
probability value between 0 <strong>and</strong> 1. Consequently, the algorithm<br />
can be made more specific or more sensitive by setting<br />
an operating threshold on this probability value . The resulting<br />
sensitivity/specificity pairs are plotted in a graph, yielding a receiver<br />
operator characteristics (ROC) curve [77], [96]. The area<br />
under the ROC curve (AUC, represented by its value )is<br />
determined by setting a number of different thresholds for .<br />
Sensitivity <strong>and</strong> specificity pairs of the algorithm are obtained at<br />
each of these thresholds. The ground truth is of course kept unchanged.<br />
The algorithm behavior represented by this ROC curve<br />
can thus be reduced to a single number. The maximum value
184 IEEE REVIEWS IN BIOMEDICAL ENGINEERING, VOL. 3, 2010<br />
of AUC is 1, denoting a perfect diagnostic performance, with<br />
both the sensitivity <strong>and</strong> specificity being 1 (100% performance).<br />
While the AUC assessment of performance is highly relevant<br />
<strong>and</strong> covers the most important aspects of lesion detection behavior,<br />
this approach has a number of limitations, including its<br />
dependence on the quality of annotated datasets [69], [70] <strong>and</strong><br />
on the underestimation of missing rare, but sight- or life-threatening<br />
abnormalities, as discussed in Section IV-B3.<br />
1) Performance Comparison of Diabetic Retinopathy Detection<br />
Systems to That of <strong>Retinal</strong> Specialists: Several groups<br />
have studied the performance of detection algorithms in a real<br />
world setting, i.e., when the systems are used on populations<br />
of patients with diabetes, not previously known to have diabetic<br />
retinopathy. The main goal of such a system is to decide<br />
whether the patient should be evaluated by a human expert<br />
or can return for followup, only involving automated analysis<br />
of retinal images [70], [71]. As mentioned previously, performance<br />
of the algorithm that placed first at the 2009 Retinopathy<br />
Online Challenge competition [97] was compared to that of a<br />
large computer-aided early DR detection project EyeCheck [59].<br />
In this comparison, fundus photographic sets from 17 877 patient<br />
visits of 17 877 people with diabetes who had not previously<br />
been diagnosed with DR consisting of two fundus images<br />
from each eye were used for performance comparison.<br />
The fundus photographic set from each visit was analyzed by<br />
a single retinal expert <strong>and</strong> 792 of the 17 877 sets were classified<br />
as containing more than minimal DR (threshold for patient<br />
referral). The two algorithmic lesion detectors were applied<br />
separately to the dataset <strong>and</strong> compared by st<strong>and</strong>ard statistical<br />
measures. The area under the ROC curve was the main<br />
performance characteristic. The results showed that the agreement<br />
between the two computerized lesion detectors was high.<br />
<strong>Retinal</strong> exams containing more than minimal DR were detected<br />
with an AUC of<br />
by the Eyecheck algorithm <strong>and</strong> an<br />
AUC of for the ROC-2009 winner. This difference in<br />
AUC was not statistically significant (z-score of 1.91). If the detection<br />
output of these two algorithms were combined (at least<br />
one detection constituted a hit), the detection AUC increased to<br />
, a value identical to the theoretically expected maximum<br />
[69]. At 90% sensitivity, the specificity of the EyeCheck<br />
algorithm was 47.7%. The specificity of the ROC-2009 winner<br />
algorithm was 43.6%. By comparison with interobserver variability<br />
of the employed experts, the study concluded that DR<br />
detection algorithms appear to be mature <strong>and</strong> further improvements<br />
in detection performance cannot be differentiated from<br />
the current best clinical practice because the performance of<br />
competitive algorithms has now reached the human intrareader<br />
variability limit [69]. Additional validation studies on larger,<br />
well-defined, but more diverse populations of patients with diabetes<br />
are urgently needed, anticipating cost-effective early detection<br />
of DR in millions of people with diabetes to triage those<br />
patients who need further care at a time when they have early<br />
rather than advanced DR, <strong>and</strong> such trials are currently underway<br />
in the U.S., U.K., <strong>and</strong> the Netherl<strong>and</strong>s, though the results have<br />
not yet been disclosed.<br />
2) Multilevel Approach to Lesion Detection: From Pixel to<br />
Patient: As outlined above, the retinal lesion detection algorithms<br />
operate at a broad range of levels according to the utilization<br />
of the detection algorithm outputs. Such a utility level<br />
is limited at one end by the finite resolution of the imaging device<br />
<strong>and</strong> at the other end by the feasibility of imaging that can<br />
be employed over a finite time (i.e., number of repeated image<br />
acquisitions on the same subject). At the lowest level, algorithms<br />
classify individual pixels, followed by groups of pixels<br />
(possibly representing lesions), areas (organs or organ structures)<br />
in images, <strong>and</strong> at even higher level, complete images, multiple<br />
images may form a subject-level exam, <strong>and</strong> finally—at the<br />
highest level—multifaceted analyses of individual subjects are<br />
attempted. At each such level, the probability of abnormality<br />
detection is frequently determined while relying on findings at<br />
previous lower levels. At the highest level the system may be<br />
diagnosing a single patient based on the fused information from<br />
all the lower-level contributions. Clearly, answering the ultimate<br />
question how to effectively fuse all such information is<br />
nontrivial.<br />
This subject was studied by Niemeijer et al. [98], <strong>and</strong> their<br />
approach involved application of multiple unsupervised <strong>and</strong><br />
supervised analysis approaches that were compared in terms of<br />
performance at the patient level. A compound computer-aided<br />
retinal diagnostic system was developed that takes into account<br />
abnormalities of multiple types <strong>and</strong> at multiple levels, as well<br />
as the estimated confidence in individual analysis outcomes. A<br />
reliable analysis scheme was proposed based on a supervised<br />
fusion scheme for combining the output of the different components,<br />
<strong>and</strong> its performance evaluated on 60 000 images from<br />
15 000 patients. The choice of the fusion system was identified<br />
as significantly influencing the overall system performance with<br />
simple fusion methods achieving classification performance<br />
associated AUC while the supervised fusion system<br />
reached an AUC [98].<br />
3) Role of Publicly Available <strong>and</strong> Comparative Databases:<br />
To drive the development of progressively better fundus<br />
image analysis methods, research groups have established<br />
publicly available, annotated image databases in various fields.<br />
Fundus imaging examples are represented by the STARE<br />
[72], DRIVE [73], REVIEW [99] <strong>and</strong> MESSIDOR databases<br />
[100], with large numbers of annotated retinal fundus images,<br />
with expert annotations for vessel segmentation, vessel width<br />
measurements, <strong>and</strong> diabetic retinopathy detection, as well as<br />
competitions such as the Retinopathy Online Challenge [97],<br />
some of which will be discussed in the following. A major<br />
inspiration for these online image databases <strong>and</strong> online competitions<br />
was the Middlebury Stereo Vision competition [101],<br />
[102].<br />
4) DRIVE—(Digital <strong>Retinal</strong> <strong>Image</strong>s for Vessel Evaluation):<br />
The DRIVE database was established to enable comparative<br />
studies on segmentation of retinal blood vessels in retinal fundus<br />
images. It contains 40 fundus images from subjects with diabetes,<br />
both with <strong>and</strong> without retinopathy, as well as retinal vessel<br />
segmentations performed by two human observers. In one of the<br />
available images, high-contrast choroidal regions were also segmented<br />
because these can be easily confused with retinal vessels.<br />
Starting in 2005, researchers have been invited to test their<br />
algorithms on this database <strong>and</strong> share their results with other researchers<br />
through the DRIVE website [103]. At the same web<br />
location, results of various methods can be found <strong>and</strong> compared.<br />
An early comparative analysis of the performance of vessel segmentation<br />
algorithms was reported in [73] <strong>and</strong> by now, over<br />
100 papers have been published using the DRIVE database as<br />
a benchmark. Currently, retinal vessel segmentation research is
ABRÀMOFF et al.: RETINAL IMAGING AND IMAGE ANALYSIS 185<br />
TABLE I<br />
SENSITIVITIES OF DIFFERENT METHODS IN 2009 ROC COMPETITION (TABLE II IN [97]. ALL MICROANEURYSMS FROM TEST SET WERE INCLUDED)<br />
primarily focusing on improved segmentation of small vessels,<br />
as well as on segmenting vessels in images with substantial abnormalities.<br />
ROC—Retinopathy Online Challenge: The DRIVE database<br />
was a great success, allowing comparisons of algorithms on a<br />
comparative dataset. In retinal image analysis, it represented a<br />
substantial improvement over method evaluations on unknown<br />
datasets. However, different groups of researchers tend to use<br />
different metrics to compare the algorithm performance, making<br />
truly meaningful comparisons difficult or impossible. Additionally,<br />
even when using the same evaluation measures, implementation<br />
specifics of the performance metrics may influence final<br />
results. Consequently, until the advent of the Retinopathy Online<br />
Challenge ROC competition in 2009, comparing the performance<br />
of retinal image analysis algorithms was difficult [97].<br />
A logical next step was therefore to provide publicly available<br />
annotated datasets for use in the context of online, st<strong>and</strong>ardized<br />
evaluations asynchronous competitions. In an asynchronous<br />
competition, a subset of images is made available with<br />
annotations, while the remainder of the images are available<br />
with annotations withheld. This allows researchers to optimize<br />
their algorithm performance on the population from which the<br />
images were drawn (assuming the subset with annotated images<br />
is representative of the entire population), but they are unable<br />
to test–retest on the evaluation images, because those annotations<br />
are withheld. All results are subsequently evaluated using<br />
the same evaluation software <strong>and</strong> research groups are allowed<br />
to submit results continuously over time. Nevertheless, some<br />
groups may be tempted to artificially influence the performance<br />
outcome for example by using human readers to assist with the<br />
performance of their algorithm, or iteratively improving the performance<br />
by submitting multiple results serially <strong>and</strong> using the<br />
obtained performance differences to tune-up their algorithms.<br />
More recently, the concept of synchronous competitions was<br />
born, for which a deadline is given for submitting analysis results<br />
with competition results announced at a single moment in<br />
time. The most well-known example of such an approach is the<br />
Netflix competition [104]. These kinds of joint evaluations on<br />
a common dataset have the potential to steer future research by<br />
showing the failure modes of certain techniques <strong>and</strong> guide the<br />
practical application of techniques in the clinical practice, especially<br />
if appropriate reward mechanisms are available (again,<br />
the highly successful Netflix competition may serve as a motivational<br />
example).<br />
The first Retinopathy Online Challenge competition [105] focused<br />
on detection of microaneurysms <strong>and</strong> was organized in<br />
2009. Twenty-six groups participated in the competition out of<br />
which six groups submitted their results on time, as published in<br />
[97]. One group decided to drop out of the competition after the<br />
results were announced, <strong>and</strong> the remainder allowed their performance<br />
to be discussed publicly [89], [106]–[108]. The results<br />
from each of the methods in this competition are summarized in<br />
Table I.<br />
ROC-2009 Datasets: A set of 100 digital color fundus photographs<br />
were selected from a large dataset of over 150 000 images,<br />
acquired during diabetic retinopathy screening [59]. The<br />
inclusion criteria were that the screening program ophthalmologist<br />
had marked the image as containing microaneurysms <strong>and</strong><br />
did not mark it as ungradable. Since multiple screening sites<br />
utilizing different fundus camera types were involved in the<br />
screening program, the images in the ROC-2009 set are quite<br />
heterogeneous. Three different sizes of field of view (FOV) are<br />
present in the dataset, each corresponding to different image resolution.<br />
The images were captured using either Topcon NW 100,<br />
Topcon NW 200, or Canon CR5-45NM camera, resulting in<br />
two differently shaped FOV’s. All images were made available<br />
in JPEG format with st<strong>and</strong>ard image compression levels set in<br />
the camera. Four retinal experts annotated all microaneurysms<br />
as well as all “don’t care” lesions in the 100 images. For the<br />
training set, a logical OR was used to combine the lesion locations<br />
annotated by the four experts—thus ensuring that the<br />
reference dataset was highly sensitive to lesions, as it required<br />
only one retinal expert to identify a lesion. The annotations were<br />
exported as a file in XML format that contained the center locations<br />
for all microaneurysms <strong>and</strong> all “don’t care” lesions in<br />
each image of the set.<br />
E. Optic Nerve Head <strong>Analysis</strong> From Fundus <strong>Image</strong>s<br />
Glaucoma is the third leading cause of blindness in the U.S.,<br />
characterized by gradual damage to the optic nerve <strong>and</strong> resultant<br />
visual field loss. Early diagnosis <strong>and</strong> optimal treatment have<br />
been shown to minimize the risk of visual loss due to glaucoma.<br />
The hallmark of glaucomatous progression is cupping<br />
of the optic nerve head. One way of determining the amount<br />
of cupping is planimetry by experienced glaucoma specialists<br />
from stereo color photographs of the optic nerve head. Pixel<br />
feature classification is an attractive technique to detect the cup<br />
<strong>and</strong> rim in stereo color photographs, as shown in the following<br />
paragraphs.<br />
1) Pattern Recognition Approach to ONH Segmentation:<br />
Stereo photographs of the optic disc (cropped from 4096<br />
4096 pixel resolution to 512 512, centered at the optic<br />
nerve head) were used to form a reference st<strong>and</strong>ard via manual<br />
planimetry of the stereo pairs, labeling each image pixel as<br />
one of cup, rim, <strong>and</strong> background in a majority-win manner<br />
according to the labeling of three expert glaucoma specialists<br />
(Fig. 15). In the case of a draw, the pixel was assigned to the<br />
background class [110].
186 IEEE REVIEWS IN BIOMEDICAL ENGINEERING, VOL. 3, 2010<br />
Fig. 15. Annotations of optic disc stereo pair by three expert glaucoma specialists. Note substantial inter-observer variability. ONH rim is shown in grayish <strong>and</strong><br />
cup in whitish overlay on left image of stereo pair. Rightmost panel D shows a reference st<strong>and</strong>ard that was created from expert analyses A, B, C by majority voting<br />
with white color representing cup, gray color denoting rim, <strong>and</strong> black color corresponding to background.<br />
As mentioned in Section IV-A, pixel intensity <strong>and</strong> simple<br />
edge operators can be used to generate local image features.<br />
Considering spatial context, a Gaussian filter bank can be used<br />
to generate a large number of (sometimes correlated) features,<br />
from which an optimal feature combination can be identified<br />
using a formal feature selection process. Gaussian filter bank<br />
features are designed to be sensitive to edges <strong>and</strong> textures at<br />
different scales <strong>and</strong> orientations <strong>and</strong> are usually applied to graylevel<br />
image data (Fig. 16). To incorporate the color information<br />
that is inherently present in the fundus photographs, additional<br />
color-sensitive features can result from a Gaussian steerable<br />
filter bank applied to the hue, saturation, <strong>and</strong> brightness image<br />
representations together with assessing signal variance in the R,<br />
G, <strong>and</strong> B channels in small neighborhoods. Such features are<br />
obviously different from the color opponency model of primate<br />
color vision. Color opponency intensities, for dark-bright, redgreen<br />
<strong>and</strong> blue-yellow opponency, that are substantially closer<br />
to primate color vision color opponency processing can be computed<br />
from each color image as follows [111]:<br />
(5)<br />
(6)<br />
(7)<br />
where are the red, green <strong>and</strong> blue channels of the<br />
analyzed image of the stereo pair.<br />
are then each<br />
convolved with the respective Gaussian derivatives to obtain the<br />
Gaussian derivative-related features in the opponency space.<br />
When employing the above-described Gaussian steerable<br />
filter bank in dark-bright, red-green, <strong>and</strong> blue-yellow center-surround<br />
color opponency images, a performance improvement<br />
was achieved [110].<br />
After feature selection <strong>and</strong> training, the selected image features<br />
were classified by -NN <strong>and</strong> support-vector machine classifiers,<br />
yielding probability maps of pixel labeling of cup, rim, or<br />
background. The approach that was presented in detail in [110]<br />
achieved three-class segmentation (labeling) correctness of 88%.<br />
Fig. 17 shows how the gradings by glaucoma specialists, glaucoma<br />
fellows, <strong>and</strong> the algorithm visually compare to each other.<br />
Correlations of the calculated cup to disc ratios with the reference<br />
st<strong>and</strong>ard was (95% CI, 0.89–0.96, ).<br />
Fig. 16. Color opponency steerable Gaussian filter bank kernel examples. First<br />
row, from left to right shows dark-bright opponency kernels for 0th order, firstorder<br />
0 to local gradient, first-order 90 to local gradient, second-order 0 to<br />
local gradient, second-order 60 to local gradient, <strong>and</strong> second-order 120 to<br />
local gradient, at a scale of 32 pixels. Second row, same for scale of 64 pixels,<br />
<strong>and</strong> third row for scale of 128 pixels. Next three rows show identical information<br />
for blue-yellow opponency kernels, <strong>and</strong> last three rows show red-green kernels.<br />
Smaller scales not shown because they are difficult to depict. These kernel images<br />
represent responses of each of feature detectors to an impulse function.<br />
Note that true kernel colors are shown.<br />
The ONH segmentation performance clearly indicated that<br />
pixel feature classification with biologically inspired features
ABRÀMOFF et al.: RETINAL IMAGING AND IMAGE ANALYSIS 187<br />
derived from color fundus images is a good starting point for the<br />
classification of the optic nerve head <strong>and</strong> likely also other 3-D<br />
structures of the retina. Importantly, it was shown that features<br />
benefiting from the underst<strong>and</strong>ing to the physiologic vision<br />
process outperform st<strong>and</strong>ard pixel features when segmenting<br />
the optic nerve head.<br />
2) Three-Dimensional Reconstruction of ONH Shape From<br />
Stereo Color Fundus Photographs: Clinicians have used stereo<br />
color fundus images of the optic disc for many decades. Threedimensional<br />
shape of the optic nerve head provides the visible<br />
manifestation of optic nerve damage. To allow objective <strong>and</strong><br />
quantitative analysis of the ONH, several groups have developed<br />
techniques to estimate its 3-D shape using stereo fundus images<br />
[112]. Estimation of 3-D shape from stereo images has been<br />
performed for decades [113]. By measuring the relative position<br />
differences or disparity of one or more corresponding patches<br />
or regions in the two stereo images, the underlying shape can be<br />
estimated [114].<br />
The problem of identification of correspondences is usually<br />
solved by making a number of assumptions, such as that of<br />
the Lambertian reflectance, which assumes that image intensities<br />
of the same 3-D point are identical regardless of the view<br />
angle variations. Another commonly used assumption is that<br />
the 3-D surface is fronto-parallel to both image planes within<br />
a local neighborhood. Problems arise when these assumptions<br />
are violated. Consequently, the same 3-D point or patch may<br />
not have the exact same appearance due to depth variation relative<br />
to its surroundings <strong>and</strong> due to the different view angles.<br />
Repetitive patterns or lack of distinct features produce matching<br />
ambiguities.<br />
In contrast to computational processes deriving shape from<br />
stereo images of natural scenes, images of the eye often have<br />
low contrast <strong>and</strong> high noise caused by safety-based limitations<br />
on the amount of illumination that can be used. The images<br />
thus consist of low contrast regions without clear boundaries.<br />
Large imaging apertures can gather more light but simultaneously<br />
suffer from a small depth of focus. As a consequence,<br />
depth variations may cause different degrees of blur due to defocusing<br />
of the camera. Similarly, an increase of exposure time<br />
may incur blur due to the motion of the eye.<br />
The shape estimate of the optic disc is formed from two sets<br />
of densely corresponding pixels <strong>and</strong> from the<br />
stereo fundus images <strong>and</strong> , taken from two different view<br />
angles while simultaneously imaging the same eye (Fig. 18).<br />
The two image planes are horizontally displaced in a typical<br />
camera configuration. The horizontal disparity of a pair of correspondences<br />
is inversely proportional to the depth<br />
of the associated 3-D point. Given the correspondences between<br />
the image point pairs, the disparity map<br />
is defined<br />
as a 2-D matrix satisfying<br />
(8)<br />
where image is usually referred to as the reference image<br />
<strong>and</strong> image the matching image. The disparity map contains<br />
depth information about the observed structure. If the disparity<br />
map of a pair of fundus images is found by densematching<br />
<strong>and</strong> plotted as a 3-D surface, the shape of the optic disc<br />
is recovered.<br />
For stereo fundus images with slowly varying texture, it is<br />
easier to associate a pair of globally matching regions since<br />
more prominent l<strong>and</strong>marks can be utilized, such as blood vessels<br />
<strong>and</strong> the optic disc. On the other h<strong>and</strong>, given a limited number<br />
of c<strong>and</strong>idate correspondences <strong>and</strong> the deformations in order to<br />
achieve correct matches between such l<strong>and</strong>marks, detailed local<br />
information is frequently sufficient <strong>and</strong> more reliable to discern<br />
subtle differences among these c<strong>and</strong>idates. This motivates<br />
a scale-space-based framework described as follows.<br />
Scale space consists of<br />
scale<br />
image evolutions with the<br />
representing a third dimension. Given a pair of images<br />
<strong>and</strong> , a disparity map is estimated<br />
at scale <strong>and</strong> then upscaled to , which<br />
matches the stereo pair <strong>and</strong> at the<br />
higher scale . With constraints imposed by ,<br />
the disparity map evolves to the finer scale<br />
while<br />
at each scale, certain features are selected as the salient ones.<br />
The scale-space-based representation of the image structure<br />
is intended to provide globally coherent solutions for the correspondence<br />
problem. Stereo images at different scales provide<br />
hierarchical features for correspondence identification while<br />
disparity maps along the scale dimension provide structure<br />
description in terms of point evolution paths <strong>and</strong> act as the<br />
regularization component. Constraints enforced by l<strong>and</strong>marks<br />
at a certain scale guide finer searches toward correct directions<br />
along those paths while the small additive noise is filtered out<br />
by a 2-D adaptive noise-removing Wiener filter, which can<br />
preserve depth edges during disparity evolution.<br />
The matching process involves assigning one label (disparity<br />
value) to each pixel in the reference image within a rather large<br />
disparity range. The scale-space-based approach essentially distributes<br />
this task to different scales so that at each scale the<br />
matching ambiguity is reduced significantly. This is important<br />
for noisy stereo fundus pairs with low texture density. The formulation<br />
is consistent with the perceptual grouping performed<br />
by the human visual system.<br />
The described approach to reconstruct ONH surface shape<br />
was evaluated on 30 pairs of stereo fundus images in comparison<br />
with ONH surface shapes derived from 3-D OCT imaging of the<br />
same subjects—OCT analysis was performed as described in<br />
Section V-D. The accuracy of each disparity map was measured<br />
by the root of mean squared (RMS) differences between<br />
the estimate derived from stereo fundus photographs <strong>and</strong><br />
the depth information obtained from OCT scans as<br />
where is the total number of pixels. Both depth maps (stereofundus<br />
<strong>and</strong> OCT derived) were normalized to the same scale<br />
according to the depth of the cup <strong>and</strong> the OCT-derived surface<br />
served as the independent st<strong>and</strong>ard. In this relative manner, the<br />
average RMS error of the stereo-fundus surface reconstruction<br />
was 15.9 8.8% of the cup depth when assessed over all 30<br />
analyzed stereo fundus pairs (Fig. 19).<br />
(9)
188 IEEE REVIEWS IN BIOMEDICAL ENGINEERING, VOL. 3, 2010<br />
Fig. 17. Classification of stereo pairs (left two columns) by glaucoma specialists (third column), three glaucoma fellows (columns 4–6), <strong>and</strong> automated pixel<br />
feature classification (right-most column). Rows from top to bottom: Small, medium, large disc excavation, <strong>and</strong> excavation with inferior notching.<br />
F. Active Areas of Research in Fundus <strong>Image</strong> <strong>Analysis</strong><br />
Major progress has been accomplished in many fundus image<br />
analysis tasks mentioned above. Current challenges, on which<br />
multiple research groups worldwide are actively working, include<br />
the following areas:<br />
1) <strong>Retinal</strong> blood vessels:<br />
a) vessel segmentation for smaller vessels only a few<br />
pixels in diameter;<br />
b) vessel segmentation in images with substantial<br />
pathology;<br />
c) differentiating arteries from veins;<br />
d) assessing accurate vessel diameter;<br />
e) assessing vessel tortuosity;<br />
f) vessel tree analysis including tree branching patterns.<br />
2) <strong>Retinal</strong> lesions:<br />
a) detection of irregularly shaped hemorrhages;<br />
b) detection of rare but major pathology such as neoplasms<br />
<strong>and</strong> scarring;<br />
c) detection of lesion distribution patterns, for example<br />
drusen;<br />
d) segmentation of atrophy, including geographic<br />
atrophy;<br />
e) fast analysis allowing real time feedback.<br />
3) Content-based image retrieval for abnormality detection;<br />
4) Change over time detection for abnormality assessment;<br />
5) Integration of fundus image-based quantification with<br />
other metrics of disease risk, such as serum glucose level,<br />
patient history, etc.<br />
V. OCT IMAGE ANALYSIS<br />
Because of OCT’s relatively new presence in ophthalmic<br />
care compared to fundus photography, the use of image analysis<br />
techniques for the use of image analysis for processing<br />
OCT images has a shorter history. Nevertheless, it is a rapidly<br />
growing <strong>and</strong> important area, especially as spectral-domain OCT<br />
technology has enabled true 3-D volumetric scans of the retina<br />
to be acquired (see Fig. 20 for example scanning locations).<br />
With this ever-increasing wealth of image information, the<br />
importance of developing advanced image analysis techniques<br />
to maximize the clinically relevant information to be extracted<br />
is especially important. Nevertheless, the development of such<br />
advanced techniques can be challenging as OCT images are<br />
inherently noisy, thus often requiring the utilization of 3-D<br />
contextual information (Fig. 22). Furthermore, the structure of<br />
the retina can drastically change during disease (as illustrated<br />
in Figs. 27, 29, <strong>and</strong> 30). Here, we review some of the important<br />
image analysis areas for processing OCT images. We start<br />
with the segmentation of retinal layers (Section V-A1), one of<br />
the earliest, yet still extremely important, OCT image analysis<br />
areas. We then discuss techniques for flattening OCT images<br />
in order to correct scanning artifacts (Section V-A2). Building<br />
upon the ability to extract layers, we discuss use of thickness<br />
information in Section V-A3 <strong>and</strong> use of texture information<br />
in Section V-A4. This is followed by the segmentation of<br />
retinal vessels (Section V-B), which currently has its technical<br />
basis in many of the techniques used for segmenting vessels<br />
in fundus photography, but is beginning to take advantage of<br />
the 3-D information only available in SD-OCT. Utilizing both<br />
layer-based <strong>and</strong> texture-based properties to detect the locations
ABRÀMOFF et al.: RETINAL IMAGING AND IMAGE ANALYSIS 189<br />
Fig. 18. Two examples of 3-D ONH surface reconstruction obtained from a stereo fundus pair <strong>and</strong> from 3-D OCT scan shown in two rows. From left to right<br />
(both rows): left <strong>and</strong> right fundus image centered at the optic disc. Shape estimate of optic nerve head surface represented as grayscale depth maps derived from<br />
OCT scan. Reference (left) image shown to correspond to OCT scan view. Shape estimate of optic nerve surface represented as grayscale depth maps derived from<br />
stereo fundus pair analysis. Reference (left) image shown to correspond to output from stereo fundus pair reconstruction.<br />
Fig. 19. Example of 3-D agreement between stereo-fundus-photography-derived<br />
(lower surface) <strong>and</strong> OCT-derived (upper surface, smoothed) 3-D reconstructions<br />
of ONH shape.<br />
Fig. 20. Typical scanning locations (illustrated on center fundus photograph)<br />
of spectral-domain OCT scanning system: Macular volumetric scans (left, in<br />
yellow) which are centered on macula, <strong>and</strong> peripapillary volumetric scans (right,<br />
in green) which are centered on optic nerve head.<br />
of retinal lesions is described in Sections V-C <strong>and</strong> V-C1, with<br />
a 3-D-based approach for segmenting the boundaries of such<br />
lesions being described in Section V-C2. The ability to segment<br />
layers in the presence of lesions is described in Section V-C3.<br />
We finally describe approaches for segmenting structures of the<br />
optic nerve head in SD-OCT in Section V-D.<br />
A. <strong>Retinal</strong> Layer <strong>Analysis</strong> From 3-D OCT<br />
1) <strong>Retinal</strong> Layer Detection: The segmentation of retinal<br />
layers in OCT scans has been an important goal since OCT’s<br />
availability to the ophthalmic community [36] as thickness<br />
changes in the layers are one indication of disease status<br />
(Section V-A3). An example of the visible layers in one slice<br />
from a spectral-domain OCT macular volume is given in<br />
Fig. 21. With the previous-generation time-domain scanning<br />
systems (such as the Stratus OCT by Carl Zeiss Meditec, Inc.),<br />
commercial systems offered the ability to segment <strong>and</strong> provide<br />
thickness measurements for one layer of the retina. In particular,<br />
the retinal nerve fiber layer (RNFL) thickness measurements of<br />
peripapillary circular scans were frequently used for the disease<br />
status/progression/regression assessment in glaucoma patients,<br />
while the total retinal thickness measurements were often used<br />
in the assessment of patients with macular edema, choroidal<br />
neovascularization <strong>and</strong> macular hole. While the proprietary<br />
details of commercial approaches are not known, it can be<br />
assumed that they utilized an inherently 2-D approach (i.e.,<br />
if multiple 2-D slices are available in a particular scanning<br />
sequence they are segmented independently).<br />
Similarly, most of the early approaches reported in the<br />
literature [115]–[121] for the segmentation of time-domain<br />
scans were two dimensions in nature; however, some of the<br />
approaches did move towards segmenting additional layers of<br />
the retina. While variations to each of the early 2-D approaches<br />
exist for the segmentation of retinal boundaries, a typical 2-D<br />
approach proceeds as follows.<br />
1) Preprocess the image (e.g., with a median filter as in<br />
[115]–[118] or anisotropic diffusion filter as in [120]).<br />
2) Perform a 1-D peak detection algorithm on each A-scan<br />
(column) of the processed image to find points on each<br />
border of interest.<br />
3) (For only a few approaches) Process the points further to<br />
correct for possible discontinuities in the 1-D border detection<br />
approaches (e.g., use Markov modeling to connect<br />
smaller segments to the largest continuous segment followed<br />
by spline-fit as in [115], [116]).<br />
Other 2-D time-domain approaches included the use of 2-D dynamic<br />
programming by Baroni et al. [122] <strong>and</strong> manually initialized<br />
deformable models for the segmentation of fluid-filled<br />
regions by Cabrera Fernández [119]. These segmentation approaches<br />
have attempted to find different numbers of boundaries
190 IEEE REVIEWS IN BIOMEDICAL ENGINEERING, VOL. 3, 2010<br />
Fig. 21. Segmentation results of 11 retinal surfaces (ten layers). (a) X-Z image of OCT volume. (b) Segmentation results, nerve fiber layer (NFL), ganglion cell<br />
layer (GCL), inner plexiform layer (IPL), inner nuclear layer (INL), outer plexiform layer (OPL), outer nuclear layer (ONL) + inner segments (IS), outer segments<br />
(OS), <strong>and</strong> retinal pigment epithelium complex (RPE+). Stated anatomical labeling is based on observed relationships with histology although no general agreement<br />
exists among experts about precise correspondence of some layers, especially outermost layers. (c) Three-dimensional rendering of segmented surfaces (N: nasal,<br />
T: temporal).<br />
of the retina. In particular, Koozekanani et al. [115], [116] found<br />
two boundaries, Baroni et al. [122] found three, Shahidi et al.<br />
found four [121], Ishikawa et al. [117], [118] found five, <strong>and</strong><br />
Cabrera Fernández found seven retinal layer boundaries [120].<br />
Haeker/Garvin et al. [123]–[126] reported the first true 3-D<br />
segmentation approach for the segmentation of retinal layers on<br />
OCT scans, thus taking advantage of 3-D contextual information.<br />
In addition to segmenting the layers in three dimensions,<br />
their approach was unique in that the layers could be segmented<br />
simultaneously [127]. The approach involved the construction<br />
of a graph such that the minimum-cost closed set of this graph<br />
would correspond to a set of optimal feasible surfaces. Feasibility<br />
was defined by smoothness constraints (i.e., not allowing<br />
neighboring surface points to be too far apart) <strong>and</strong> surface interaction<br />
constraints (i.e., requiring the distances between surfaces<br />
to be in a particular range). Their initially reported approaches<br />
utilized edge-based cost functions <strong>and</strong> constant feasibility constraints<br />
[123], [126], but they later extended the graph-based approach<br />
to allow for true regional information [125] <strong>and</strong> varying<br />
feasibility constraints [124]. For time-domain macular scans,<br />
they segmented six to seven surfaces (five to six layers), obtaining<br />
an accuracy <strong>and</strong> reproducibility similar to that of retinal<br />
specialists.<br />
This work was then extended to work with spectral-domain<br />
OCT volumes [128], making the utilization of 3-D<br />
contextual information more advantageous. The importance<br />
of 3-D contextual information is illustrated in Fig. 22. The<br />
originally published method was validated on repeated scans<br />
from macula-centered SD-OCT volumes of normal subjects<br />
<strong>and</strong> did suffer from relatively long processing times of hours<br />
per volume. The processing time has substantially decreased<br />
by employing a multiscale approach to a few minutes while<br />
segmenting additional layers (Fig. 21) [129]. A similar approach<br />
for segmenting the intraretinal layers in ONH-centered<br />
SD-OCT volumes was reported with an accuracy similar to that<br />
of the inter-observer variability of two human experts [130].<br />
Based on their graph-theoretic approach, a preliminary layer<br />
thickness atlas was built from a small set of normal subjects<br />
[131] <strong>and</strong> unique layer changes were demonstrated in diabetes<br />
subjects [132], [133].<br />
Other reported approaches for the segmentation of spectraldomain<br />
OCT volumes or slices include an interactive 3-D
ABRÀMOFF et al.: RETINAL IMAGING AND IMAGE ANALYSIS 191<br />
Fig. 22. Illustration of helpfulness in using 3-D contextual information in intraretinal layer segmentation process. (Top) Sequence of 2-D result on three adjacent<br />
slices within spectral-domain volume obtained using a slice-by-slice 2-D graph-based approach. Note the “jump” in segmentation result for third <strong>and</strong> fourth surfaces<br />
in middle slice. (Bottom) Sequence of 3-D result on same three adjacent slices using same graph-based approach, but with addition of 3-D contextual information.<br />
Three-dimensional contextual information prevented third <strong>and</strong> fourth surface segmentation from failing.<br />
approach by Fuller et al. [134], the 2-D segmentation of slices<br />
from rodent images using an active contour approach by Yazdanpanah<br />
et al. [135], <strong>and</strong> the 2-D segmentation of slices from<br />
rodent images using a dynamic programming method [136] by<br />
Mishra et al. [137].<br />
2) OCT <strong>Image</strong> Flattening: SD-OCT volumes frequently<br />
demonstrate motion artifacts in the slow-scanning direction<br />
causing a high-frequency ripple in this direction. Furthermore,<br />
other artifacts may be present, such as the tilting due to an<br />
off-axis placement of the pupil. Thus, various approaches have<br />
been reported in an attempt to correct these artifacts. Common<br />
approaches for reducing these artifacts include 1-D <strong>and</strong> 2-D<br />
methods that use cross-correlation of either A-scans [117] or<br />
B-scans [134], [138], [139]. In some cases, a complete flattening<br />
of the volume is desired based on a surface segmentation to ensure<br />
a consistent shape for segmentation (to aid in learning shape<br />
constraints) <strong>and</strong> visualization purposes. In addition, flattening<br />
the volumes makes it possible to truncate the image substantially<br />
in the axial direction ( -direction), thereby reducing the<br />
memory <strong>and</strong> time-requirements of an intraretinal layer segmentation<br />
approach. For example, in the approach by Garvin<br />
et al. [128], flattening an image involved first segmenting the<br />
retinal pigment epithelial surface in a lower resolution, fitting a<br />
(regularized) thin-plate spline [140] to this surface, <strong>and</strong> then vertically<br />
realigning the columns of the volume to make this surface<br />
completely flat. However, in order to avoid a strong dependence<br />
on the surface segmentation, a relatively large regularization<br />
constraint was used. This had the side effect of not completely<br />
removing many of the ripples observed in the slow-scanning<br />
direction. In an effort to better reduce the ripples observed in the<br />
slow-scanning direction, Antony et al. proposed a modification<br />
of this approach [141] to separately address the distortions in<br />
each direction using a two-stage flattening approach.<br />
3) <strong>Retinal</strong> Layer Thickness <strong>Analysis</strong>: Once the layers are<br />
segmented <strong>and</strong> flattened, the properties of the macular tissues<br />
Fig. 23. Geometry of textural characterization of macula. Local textural or<br />
thickness indices are extracted within intersection of region-defining columns<br />
(typically with a rectangular support domain in x 0 y plane) with each segmented<br />
intraretinal layer. Features computed in each of these intersections may<br />
be used to define an abnormality index for (x; y) line at center of the column<br />
when detecting macular lesions as described in Section V-C.<br />
in each of these layers can be extracted <strong>and</strong> analyzed. Currently,<br />
the most common property analyzed is layer thickness,<br />
although more recent work has been proposed for analyzing<br />
textural properties as well (Section V-A4). For example, in<br />
glaucoma, one can observe a thinning of the retinal nerve fiber<br />
layer <strong>and</strong> ganglion cell layer [142]. In other ocular diseases,<br />
thickening of specific layers can be important (e.g., macular<br />
edema) [143]. Typically, it is useful to compare the obtained<br />
thickness values to a normative database or atlas, as is available<br />
in commercial machines for the total macular thickness <strong>and</strong><br />
the retinal nerve fiber layer. However, a normative atlas for<br />
all the layers in three dimensions currently only exists within<br />
individual research groups [131]. Nevertheless, work has been<br />
done to demonstrate previously unknown changes in the layers<br />
in other diseases such as diabetes [132], [133].
192 IEEE REVIEWS IN BIOMEDICAL ENGINEERING, VOL. 3, 2010<br />
Fig. 24. Example of spectral 3-D OCT vessel segmentation. (a) Vessel silhouettes indicate position of vasculature. Also indicated in red are slice intersections of<br />
two surfaces that delineate subvolume in which vessels are segmented (superficial retinal layers toward vitreous are at the bottom). (b) Two-dimensional projection<br />
image extracted from projected subvolume of spectral 3-D OCT volume. (c) Automatic vessel segmentation. (d) Vessel segmentation after postprocessing—removing<br />
disconnected pieces <strong>and</strong> connecting large segments.<br />
4) <strong>Retinal</strong> Texture <strong>Analysis</strong>: In addition to assessing layer<br />
thickness <strong>and</strong> its variations, texture is well suited to characterize<br />
tissue properties <strong>and</strong> tissue differences. For example, textural<br />
properties may be important for assessing changes in the structural<br />
or tissue composition of layers that cannot be measured by<br />
changes in thickness alone. Using texture can also be helpful for<br />
detecting <strong>and</strong> segmenting structures involving changes in texture,<br />
such as retinal lesions (Section V-C). Texture can be determined<br />
in each of the identified layers either globally or regionally.<br />
To capture the 3-D character of the retinal tissue layers, 3-D<br />
texture analysis may include features describing intensity level<br />
distribution, run length indices, co-occurrence matrix measures,<br />
<strong>and</strong> wavelet analysis measures [144]–[146]. Three-dimensional<br />
formulations of these texture descriptors were previously developed<br />
for pulmonary parenchymal analysis [147] <strong>and</strong> can be directly<br />
employed for OCT texture analysis [148].<br />
The intensity level distribution measures may contain the<br />
mean, variance, skewness, kurtosis, <strong>and</strong> gray level (intensity)<br />
entropy <strong>and</strong> are used to describe the occurrence frequencies<br />
of all intensity levels in a subvolume of interest. The run<br />
length measures may include the short run emphasis, long run<br />
emphasis, gray level nonuniformity, run length nonuniformity,<br />
<strong>and</strong>/or run percentage <strong>and</strong> describe the heterogeneity <strong>and</strong> tonal<br />
distributions of the intensity levels in a subvolume of interest.<br />
Frequently utilized for texture characterization, co-occurrence<br />
matrix measures like the angular second moment, correlation,<br />
contrast, entropy, inertia, <strong>and</strong> inverse difference moment describe<br />
the overall spatial relationships that the intensity tones<br />
have to each other, again calculated in a subvolume of interest.<br />
Run length <strong>and</strong> co-occurrence analyses both require quantifying<br />
voxel intensities in the OCT images. That is obvious for<br />
run length measures because the concept of uniform intensity<br />
sequences is ill-defined without quantification in the presence<br />
of noise, in particular the laser speckle. The gray-level intensities<br />
are typically quantified in equally populated bins [148].<br />
The wavelet transform has been widely used in OCT images<br />
for denoising <strong>and</strong> despeckling [149]–[151] as well as for texture<br />
analysis [152]. Early work on 3-D wavelet analysis of OCT<br />
images was reported in [148] <strong>and</strong> was based on a computationally<br />
efficient yet flexible non-separable lifting scheme in arbitrary<br />
dimensions [153]. An adaptive implementation of this<br />
wavelet transform has previously been applied to 2-D texture<br />
retrieval [146].<br />
For some of the textural features described above (run length,<br />
co-occurrence matrix <strong>and</strong> wavelet indices), features are computed<br />
along all main directions. In order to reduce the cardinality<br />
of the textural characterization, these values are often averaged<br />
to form directionless scalar features [145]. Additional<br />
(not strictly texture-based but still useful) features can be computed,<br />
e.g., the averages <strong>and</strong> st<strong>and</strong>ard deviations of layer thicknesses,<br />
globally or regionally.<br />
When assessing regional texture features, texture analysis<br />
can be performed in individual (flattened) layer-specific subvolumes,<br />
for example with a square base domain of<br />
centered at an location. Texture characteristics can be<br />
computed for each segmented layer, several adjacent layers,<br />
or in layer combinations. Fig. 23 shows a schematic view of<br />
calculating regional texture indices.<br />
B. Detection of <strong>Retinal</strong> Vessels From 3-D OCT<br />
While perhaps not obvious from observing a single 2-D slice<br />
(B-scan), it is possible to segment the retinal vasculature in 3-D<br />
SD-OCT volumes [154]–[156], which, among other uses, helps<br />
to enable the OCT-to-fundus <strong>and</strong> OCT-to-OCT image registration<br />
(Section VI). The absorption of light by the blood vessel<br />
walls causes vessel silhouettes to appear below the position of<br />
vessels, which thus causes the projected vessel positions to appear<br />
dark on either a full projection image of the entire volume<br />
[156] or a projection image from a segmented layer for which<br />
the contrast between the vascular silhouettes <strong>and</strong> background is<br />
highest as proposed by Niemeijer et al. [154], [155]. In particular,<br />
the work by Niemeijer et al. used the layer near the retinal<br />
pigment epithelium (RPE) to create the projection image, as illustrated<br />
in Fig. 24(a) <strong>and</strong> (b). Vessels were segmented using a<br />
k-NN pixel classification approach using Gaussian filter banks<br />
to compute features [see Fig. 24(c) <strong>and</strong> (d)]. The performance<br />
of their automated method was evaluated for both optic nerve<br />
head (ONH) centered as well as macula-centered scans. The<br />
retinal vessels were successfully identified in a set of 16 3-D<br />
OCT volumes (eight ONH <strong>and</strong> eight macula centered) with high<br />
sensitivity <strong>and</strong> specificity as determined using ROC analysis,<br />
.
ABRÀMOFF et al.: RETINAL IMAGING AND IMAGE ANALYSIS 193<br />
Fig. 25. Example 3-D vasculature segmentation result from OCT volumetric<br />
scan [158].<br />
Xu et al. reported an approach for segmenting the projected<br />
locations of the vasculature by utilizing pixel classification of<br />
A-scans [156]. The features used in the pixel classification are<br />
based on a projection image of the entire volume in combination<br />
with features of the individual A-scans.<br />
Both of these reported prior approaches focused on segmenting<br />
the vessels in the region outside the optic disc region<br />
because of difficulties in the segmentation inside this region. For<br />
example, the projected neural canal opening (NCO) can often<br />
share similar features with vessels, thus causing false positives.<br />
Thus, Hu et al. [157] proposed a modified 2-D pixel classification<br />
algorithm to segment the blood vessels in SD-OCT<br />
volumes centered at the ONH, with a special focus on better<br />
identifying vessels near the NCO. They approached this task<br />
by incorporating presegmented NCO location (Section V-D2)<br />
information into the classification process, achieving a significant<br />
improvement over the approach previously reported by<br />
Niemeijer et al. in the NCO region.<br />
Given an initial 2-D segmentation of the projected vasculature,<br />
Lee et al. presented an approach for segmenting the 3-D<br />
vasculature in the volumetric scans [158] by utilizing a graphtheoretic<br />
approach (Fig. 25). However, one of current limitations<br />
of that approach is the inability to properly resolve the depth information<br />
of crossing vessels.<br />
C. Detection of <strong>Retinal</strong> Lesions<br />
Calculated texture <strong>and</strong> layer-based properties as described<br />
in Section V-A4 can be used to detect retinal lesions either as<br />
a 2-D footprint [148] or in three dimensions (Section V-C2).<br />
Out of many kinds of possible retinal lesions, symptomatic exudate-associated<br />
derangements (SEADs) are of utmost interest<br />
in assessing severity of age-related macular degeneration, diabetic<br />
macular edema, <strong>and</strong> other diseases. Detection of drusen,<br />
cottonwool spots, areas of pigment epithelial atrophy, pockets<br />
of fluid under epiretinal membranes, etc., may be attempted in<br />
a similar fashion.<br />
In all such applications, it is very useful to determine the<br />
normal appearance of maculae so that comparison of tissue<br />
properties with proper consideration of age, ethnicity, gender,<br />
etc., can be performed. Such a normative texture atlas can<br />
be derived from a set of OCT volumes from normal eyes.<br />
The distribution of each texture or other layer-based feature<br />
across these volumes, in the neighborhood of an line<br />
Fig. 26. Normal appearance of three intraretinal layers (NFL, INL <strong>and</strong> OS, see<br />
Fig. 21) in feature space optimized for SEAD footprint detection. For each feature,<br />
a map of the average (st<strong>and</strong>ard deviation) of feature values across macula<br />
is displayed on left (right). Inertia (b) is correlated with thickness of layer (d).<br />
Note that st<strong>and</strong>ard deviations of wavelet coefficients (c) <strong>and</strong> entropy (e) are<br />
almost uniform (black) across macula in normal eyes. (a) Average intensity;<br />
(b) inertia (co-occurrence matrix); (c) st<strong>and</strong>ard deviation wavelet coefficients<br />
(level 1); (d) layer thickness; (e) entropy (co-occurrence matrix).<br />
(i.e., a vertical column) within the th layer, may be defined by<br />
the average <strong>and</strong> the st<strong>and</strong>ard deviation of the<br />
feature values (one feature value per OCT volume). This<br />
representation is convenient since the local deviation<br />
between the feature value computed for a new sample<br />
<strong>and</strong> the normality can be expressed in terms of -score<br />
(10)<br />
Because the local distribution of a feature in one layer of the<br />
macula is defined by only two parameters (mean, st<strong>and</strong>ard deviation),<br />
the normal appearance of maculae as defined above can<br />
be derived from a relatively small set of images. More comprehensive<br />
atlases may include feature histograms <strong>and</strong> histogrambased<br />
statistical distances, but these require larger datasets to<br />
be built. Examples of calculated texture indices <strong>and</strong> their distributions<br />
over macula in 13 normal subjects—thus forming a<br />
normative pilot atlas of macular texture properties—are given<br />
in Fig. 26. These “normal atlas” values can be used for abnormality<br />
detection as described in the following.<br />
Deviations From Normal Atlas of Texture Appearance: A<br />
straightforward solution to detect retinal image abnormalities<br />
may be based on computing the local deviations from the normal<br />
appearance of maculae at each location in each layer
194 IEEE REVIEWS IN BIOMEDICAL ENGINEERING, VOL. 3, 2010<br />
<strong>and</strong> selecting the areas where the absolute deviation is greater<br />
than a predefined cutoff (e.g.,<br />
considering the<br />
95% confidence level) for at least one feature. More generally, in<br />
order to build an abnormality-specific detector, a classifier can<br />
be trained, the inputs of which may be the -scores computed<br />
for relevant features [see (10)]. The comprehensive -scores are<br />
appropriate since an abnormality may affect several layers in<br />
the neighborhood of a given location . The classifier-determined<br />
label associated with each column may reflect the percentage<br />
of the patch covered by the target abnormality with relevant<br />
features selected by one of the many available cross-validation<br />
<strong>and</strong>/or feature selection methods [159]–[161], effectively<br />
forming a probabilistic abnormality map.<br />
A crisp binary footprint for macular lesions (say, SEADs)<br />
can thus be obtained directly from a probability map, e.g., by<br />
simple probability thresholding, yielding lesion footprints. Of<br />
course, training can result in more sophisticated ways to classify<br />
abnormalities. For example, the threshold can be determined so<br />
that it minimizes the L1 distance between the expert-defined<br />
independent st<strong>and</strong>ard for lesion footprints <strong>and</strong> the thresholded<br />
probability maps among all the images in the training dataset.<br />
1) SEAD Footprint Detection: In age-related macular degeneration,<br />
in diabetic macular edema, <strong>and</strong> in other retinal diseases,<br />
SEAD lesions are reflective of disease status <strong>and</strong> their changes<br />
of disease progression or regression. With the availability of<br />
anti-vascular endothelial growth factor (VEGF) therapy, assessment<br />
of the extent <strong>and</strong> morphology of individual SEADs is expected<br />
to contribute to patient-specific therapy.<br />
While SEADs are inherently 3-D, determining their 2-D<br />
retinal footprint (SEAD projection onto a coronal retinal plane)<br />
is highly relevant. Following the above-described analysis<br />
building blocks, SEAD footprint detection can be built on<br />
generalization of properties derived from expert-defined SEAD<br />
examples. Utilizing the differences between normal regional<br />
appearance of retinal layers as described by texture descriptors<br />
<strong>and</strong> other morphologic indices, a classifier can be trained to<br />
identify abnormal retinal appearance. As described in detail in<br />
[148], the SEAD detection starts with 3-D OCT layer segmentation<br />
(Section V-A1) resulting in ten intraretinal layers plus an<br />
additional artificial layer below the deepest intraretinal layer so<br />
that subretinal abnormalities can also be detected.<br />
Texture-based <strong>and</strong> morphologic descriptors are calculated<br />
regionally in rectangular subvolumes, the most discriminative<br />
descriptors are identified, <strong>and</strong> these descriptors are used for<br />
training a probabilistic classifier. The performance of a (set<br />
of) feature(s) is assessed by calculating the area under the<br />
receiver-operating characteristic curve of the SEAD classifier.<br />
The parameter of the ROC curve is the SEAD probability<br />
measured for OCT columns with an square base from the<br />
inner validation set (per-patch AUC). Using the identified set of<br />
best features evaluated in OCT columns with an square<br />
base from the inner validation set (per-patch AUC), a forward<br />
feature selection procedure is performed, in which features are<br />
sequentially selected until the AUC stops increasing. At each<br />
step, the feature maximizing the AUC increase is selected.<br />
All the feature vectors extracted from nonoverlapping<br />
patches in the inner training set are used as reference samples<br />
by the k-NN classifier; their labels are derived from the expert<br />
Fig. 27.<br />
Example of SEAD footprint detection. Panel (a) presents an x0z slice<br />
running through SEADs in SD-OCT volume. Expert st<strong>and</strong>ards for footprint of<br />
these SEADs <strong>and</strong> automatically generated SEAD footprint probability map, in<br />
x 0 y plane, are presented in panels (b) <strong>and</strong> (c), respectively. Note probability<br />
scale in panel (c). Projection of x 0 z slice in x 0 y plane is represented by a<br />
vertical line in (b) <strong>and</strong> (c). Location of SEADs visible in panel (a) are indicated<br />
by vertical lines in each panel.<br />
st<strong>and</strong>ard. Overlapping patches from the OCT volumes<br />
in the validation eye are then classified <strong>and</strong> the SEAD probability<br />
in each pixel is defined as the average probability<br />
of all the patches containing [84]. The cross-validation<br />
training/testing procedure is repeated for several patch sizes:<br />
.<br />
Once the probabilistic classifier is trained, SEAD-related<br />
probability is determined for each retinal location. In order to<br />
obtain a binary footprint for SEADs in an image input to the<br />
system, the probability map is thresholded <strong>and</strong> the footprint of<br />
the SEADs in this image defined as the set of all pixels with<br />
a probability greater than a threshold (Fig. 27). The threshold<br />
that minimizes the L1 distance between the expert st<strong>and</strong>ard for<br />
SEAD footprints <strong>and</strong> the thresholded probability maps among<br />
all the images in the reference dataset is selected (as outlined<br />
above).<br />
This approach was applied to determine SEAD footprints in<br />
78 SD-OCT volumes from 23 repeatedly imaged patients with<br />
choroidal neovascularization, intra-, <strong>and</strong> sub-retinal fluid <strong>and</strong><br />
pigment epithelial detachment (Fig. 28) [148]. The automated<br />
SEAD footprint detection method was validated against an independent<br />
st<strong>and</strong>ard obtained using an interactive 3-D SEAD segmentation<br />
approach. An area under the ROC curve of 0.961<br />
0.012 was obtained for the classification of vertical, cross-layer,<br />
macular columns. A study performed on 12 pairs of OCT volumes<br />
obtained from the same eye on the same day showed that<br />
the repeatability of the automated method was comparable to<br />
that of the human experts, demonstrating that useful 3-D textural<br />
information can be extracted from SD-OCT scans <strong>and</strong>—together<br />
with an anatomical atlas of normal retinas—can be used<br />
for clinically important applications.
ABRÀMOFF et al.: RETINAL IMAGING AND IMAGE ANALYSIS 195<br />
Fig. 28. Repeatability study—two scans from same eye were acquired on same day at close temporal intervals. For each panel (a), (b), upper row shows binary<br />
SEAD footprint representing independent st<strong>and</strong>ard. Lower row shows SEAD footprints obtained by our automated method, gray levels represent probability of<br />
the point belonging to SEAD footprint; probability scale is provided in Fig. 27(c). These probabilities were thresholded to arrive at a binary segmentation. When<br />
varying threshold levels, obtained performance yields ROC curves discussed in text. (a) First scan <strong>and</strong> (b) second scan.<br />
Fig. 29. SEAD segmentation from 3-D OCT <strong>and</strong> SEAD development over time: top row: 0, 28, <strong>and</strong> 77 days after first imaging visit. Middle row: 0 <strong>and</strong> 42 days<br />
after first imaging visit. Bottom row: 0, 14, <strong>and</strong> 28 days after first imaging visit. Three-dimensional visualization in right column shows data from week 0. Each<br />
imaging session was associated with anti-VEGF reinjection.<br />
2) SEAD Segmentation in Three Dimensions: Complete volumetric<br />
segmentation of SEADs from 3-D OCT is more difficult<br />
with no fully tested <strong>and</strong> robust methods existing at this time. A<br />
promising approach is based on identification of a seed point in<br />
the OCT dataset that is “inside” of a SEAD <strong>and</strong> a point “outside”<br />
of a SEAD. These seed points can be identified automatically<br />
from using a 3-D variant of the probabilistic classification<br />
approach outlined in the previous paragraphs. Once these two<br />
seed points are identified, an automated segmentation procedure<br />
that is based on regional graph-cut method [162], [163] may<br />
be employed to detect the SEAD volumetric region. The cost<br />
function utilized in a preliminary study was designed to identify<br />
darkish 3-D regions with somewhat homogeneous appearance.<br />
The desired properties of the SEAD region are automatically<br />
learned from the vicinity of the identified SEAD-region<br />
seed point. This adaptive behavior allows the same graph-cut<br />
segmentation method driven by the same cost function to reliably<br />
segment SEADs of different appearance. Fig. 29 gives an<br />
example of 3-D SEAD segmentations obtained using this approach.<br />
Note that the figure depicts the same locations in the 3-D<br />
data sets imaged several times in the course of anti-VEGF treatment.<br />
The surfaces of the segmented SEADs are represented<br />
by a 3-D mesh, which can be interactively edited to maximize<br />
SEAD segmentation accuracy in difficult or ambiguous cases.<br />
3) Intraretinal Layer Segmentation in Presence of <strong>Retinal</strong> Lesions:<br />
To consider layer abnormalities <strong>and</strong> interruptions when<br />
segmenting multiple intraretinal layers in retinal OCT images<br />
in the presence of lesions (say, SEADs), a two-step approach<br />
is necessary in which layers are initially segmented not considering<br />
the lesion presence, then SEADs are segmented as de-
196 IEEE REVIEWS IN BIOMEDICAL ENGINEERING, VOL. 3, 2010<br />
Fig. 30. Automated intraretinal layer segmentation approach in presence of SEADs. (a), (b) Zeiss Cirrus OCT image data—two perpendicular slices from 3-D<br />
volume. (c), (d) Automated layer/SEAD segmentation. (e) SEAD <strong>and</strong> layers in three dimensions.<br />
scribed in Section V-C2, <strong>and</strong> the segmented SEADs are used<br />
in the subsequent step to constrain the second stage of layer<br />
segmentation. This process yields well-segmented retinal layers<br />
(Fig. 30) when SEADs occupy a single intra-retinal layer as<br />
well as in situations when the SEAD resides in several adjacent<br />
retinal layers.<br />
D. Optic Nerve Head <strong>Analysis</strong> Using 3-D OCT<br />
As mentioned previously (Section IV-E), the optic nerve head<br />
is an important structure in the assessment of ophthalmic diseases,<br />
such as glaucoma. While stereo fundus photography provides<br />
the ability to extract some 3-D shape information of the<br />
optic nerve head (Section IV-E2), SD-OCT provides true 3-D<br />
information. Nevertheless, what 3-D structural information to<br />
be extracted from these 3-D volumes of the optic nerve head is<br />
still an active area of research. Thus, most current approaches<br />
have their basis in known 2-D parameters, such as the optic<br />
disc <strong>and</strong> cup as can be visualized/segmented from stereo fundus<br />
photography. In the following paragraphs, we describe two approaches<br />
for segmenting the disc/cup in optic-nerve head 3-D<br />
OCT image data: 1) a pixel classification approach applied to<br />
depth-columns of OCT voxels in which the reference st<strong>and</strong>ard is<br />
defined by manual planimetry from stereo fundus photographs<br />
[164]–[166], <strong>and</strong> 2) direct segmentation of structures (neural<br />
canal opening <strong>and</strong> cup) from 3-D OCT images using a graphtheoretic<br />
approach [167]–[170].<br />
1) Classification-Based Approach to ONH Segmentation:<br />
The classification-based approach starts by segmenting four<br />
intraretinal surfaces in the original spectral-domain OCT<br />
volume using a multiscale 3-D graph search-based method<br />
(Section V-A1). To obtain a consistent ONH shape, the retina<br />
in the original spectral-domain OCT volume is flattened by<br />
adjusting A-scans up <strong>and</strong> down in the -direction using the<br />
segmented second intraretinal surface (Section V-A2). An OCT<br />
projection image is created by averaging in the -direction the<br />
OCT subvolume between the second <strong>and</strong> fourth intraretinal<br />
surfaces. The flattened OCT volume <strong>and</strong> intraretinal surface<br />
segmentations, OCT projection image <strong>and</strong> vessel probability<br />
map from the OCT projection image (Fig. 24) [154], [155] are<br />
used as features for the classification of the optic disc cup <strong>and</strong><br />
neuroretinal rim. The optic disc cup <strong>and</strong> neuroretinal rim are<br />
segmented by a contextual -NN classifier incorporating neighboring<br />
A-scans. Finally, prior knowledge about the shapes of<br />
the optic disc cup <strong>and</strong> neuroretinal rim regions is incorporated<br />
through the application of convex hull-based fitting.<br />
OCT Projection <strong>Image</strong>: An OCT projection image is necessary<br />
for creating the ONH independent st<strong>and</strong>ard. The retinal<br />
vasculature is visible in the projection image as described in<br />
Section V-B <strong>and</strong> [154], [155]. Feature points derived from<br />
the vasculature such as bifurcations can be used to register<br />
the fundus image with the OCT volume (Section VI-B). The<br />
projection image also serves for calculation of local features
ABRÀMOFF et al.: RETINAL IMAGING AND IMAGE ANALYSIS 197<br />
Fig. 31. Intraretinal surface segmentation. (a) Original ONH-centered OCT volume. (b) Smoothed OCT volume. (c) Intraretinal surface segmentation result<br />
overlaid on original OCT volume. Search space for surfaces are constrained by previously segmented surfaces in multiresolution fashion. (d) Three-dimensional<br />
rendering of four segmented intraretinal surfaces. Regions of surfaces 2, 3, <strong>and</strong> 4 around the optic nerve head were ignored since intraretinal surfaces are ambiguous<br />
in these regions.<br />
Fig. 32. Acquisition of ONH ground truth of spectral-domain OCT scan. (a) One of a pair of stereo color photographs. (b) Optic disc ground truth of (a), which is<br />
manually segmented by glaucoma expert through planimetry on one (left) of the pair of stereo fundus photographs while viewing the pair through a stereo viewer.<br />
Optic disc cup is in white, <strong>and</strong> neuroretinal rim is in gray. (c) OCT projection image. (d) Fundus photograph (panel a) registered onto OCT projection image (panel<br />
c). (e) OCT projection image overlapped with ONH ground truth. Optic disc cup is in red, <strong>and</strong> neuroretinal rim is in green.<br />
for the cup <strong>and</strong> rim classification of the OCT volume. The OCT<br />
projection image is created by averaging in the -direction the<br />
OCT subvolume between the second <strong>and</strong> fourth intraretinal surfaces<br />
segmented in Section V-A1 (surfaces 2 <strong>and</strong> 4, see Fig. 31).<br />
These two surfaces define a layer that, due to its position in the<br />
retina <strong>and</strong> high contrast with the retinal background, contains a<br />
large number of high contrast vessel silhouettes [154], [155].<br />
Optic Disc Cup <strong>and</strong> Neuroretinal Rim Segmentation: To<br />
segment the optic disc cup <strong>and</strong> rim, a supervised classification<br />
method assigns one of three labels (i.e., background, cup, rim)<br />
to each A-scan (voxel column) in the 3-D OCT scan (Fig. 32).<br />
Classification is based on a set of features obtained from flattened<br />
OCT volumes <strong>and</strong> intraretinal surfaces, OCT projection<br />
images <strong>and</strong> vessel probability maps [154], [155] for each voxel<br />
column in the OCT volume.<br />
Employed features include local morphologic properties of<br />
retinal layers surrounding the ONH, including depth of the optic<br />
disc cup, thickness of individual segmented layers, distance<br />
from the center of the optic disc cup (defined as the lowest<br />
point of the top segmented intraretinal surface), probability that<br />
the voxel column is part of a vessel, OCT projection image<br />
intensity, average intensity of all voxels in the voxel column,<br />
<strong>and</strong> average voxel column intensity histogram. Following<br />
feature-space normalization, a contextual nearest neighbor<br />
classifier [171] is used. For each voxel column, the classifier<br />
determines nearest neighbors in the feature space <strong>and</strong> assigns<br />
the most common label amongst the nearest neighbors to the<br />
query voxel column (Fig. 33) [165].<br />
To preserve the shapes of the optic disc cup <strong>and</strong> neuroretinal<br />
rim, a local fitting method using the convex hulls of the segmentation<br />
is employed to smooth the segmentation results for both<br />
the optic disc cup <strong>and</strong> neuroretinal rim. Figs. 33 <strong>and</strong> 34 demonstrate<br />
the performance of this approach. Overall, the approach<br />
reported in [165] achieved results not significantly different<br />
from the inter-observer variability of expert-analysis<br />
of the ONH cup <strong>and</strong> rim boundaries. In a leave-one-subject-out<br />
experiment on 27 optic nerve head-centered OCT volumes (14<br />
right eye scans <strong>and</strong> 13 left eye scans from 14 patients), the<br />
unsigned errors for the optic disc cup <strong>and</strong> neuroretinal rim were<br />
2.52 0.87 pixels (0.076 0.026 mm) <strong>and</strong> 2.04 0.86 pixels<br />
(0.061 0.026 mm), respectively.<br />
2) NCO-Approach to ONH <strong>Analysis</strong>: Using a voxel classification<br />
approach for automatically segmenting the clinical<br />
familiar glaucomatous parameters—the ONH rim <strong>and</strong> cup—directly<br />
from the SD-OCT volumes as described [164]–[166] has<br />
the ultimate limitation that the algorithm essentially mimics<br />
the subjective assessment of 2-D parameters by human experts.<br />
Since it is not based on objective, anatomical l<strong>and</strong>marks within<br />
the 3-D volumes, the optic disc margin does not overlap with a<br />
single constant anatomic structure in volumetric OCT. This is
198 IEEE REVIEWS IN BIOMEDICAL ENGINEERING, VOL. 3, 2010<br />
Fig. 33. Example of optic disc cup <strong>and</strong> neuroretinal rim segmentation. (a) OCT projection image. (b) Segmentation result using contextual k-NN classifier with<br />
convex hull-based fitting. (c) OCT projection image overlapped with reference st<strong>and</strong>ard. Optic disc cup is in red, <strong>and</strong> neuroretinal rim is in green. (d) OCT projection<br />
image overlapped with (b).<br />
Fig. 34. Example of ONH segmentation performance [unsigned error for the optic disc cup = 1:26 pixels (0.038 mm) <strong>and</strong> unsigned error for the<br />
neuroretinal rim = 0:87 pixels (0.026 mm)]. From top to bottom, left stereo color photograph, X-Z image at center of OCT volume <strong>and</strong> 3-D rendering of top<br />
intraretinal surface mapped with left stereo color photograph. (a) Without any overlap. (b) Overlapped with result from contextual k-NN classifier with convex<br />
hull-based fitting. Optic disc cup is in red <strong>and</strong> neuroretinal rim is in green. (c) Overlapped with reference st<strong>and</strong>ard. (d) Overlapped with manual segmentation<br />
from second observer.<br />
consistent with the recent comparisons of clinical <strong>and</strong> SD-OCT<br />
optic disc margin anatomy by Strouthidis et al. [172], [173].<br />
They found that the varying combinations of the termination<br />
of Bruch’s membrane, border tissue, or the anterior scleral<br />
canal opening may manifest as the 2-D disc margin seen on<br />
photographs, depending upon the border tissue architecture <strong>and</strong><br />
anatomy.<br />
With the wealth of volumetric information available from<br />
SD-OCT, it is likely that better parameters can be obtained<br />
for measuring glaucomatous change that move beyond what<br />
is possible using stereo fundus photography alone. A central<br />
requirement for the detection of the ONH structural change<br />
is a longitudinally stable zero-reference plane. As described<br />
by Strouthidis et al. [172], [173], the neural canal opening<br />
(NCO)—the termination of Bruch’s membrane/retinal pigment<br />
epithelium (BM/RPE) complex can serve as a basis for a stable<br />
reference plane from which various optic nerve morphometric<br />
parameters can be derived, based on the assumption that the<br />
NCO is not likely to change substantially with glaucomatous<br />
progression [172], [173].<br />
Thus, new efforts are directed towards segmenting structures<br />
such as the NCO directly within SD-OCT volumes.<br />
For example, Hu et al. [170] recently reported a method for<br />
segmenting the NCO directly in SD-OCT volumes. Their<br />
approach is based on first creating a projection image at the<br />
level of the BM/RPE plane <strong>and</strong> then simultaneously detecting<br />
the NCO <strong>and</strong> cup margins at the level of this plane using a<br />
graph-theoretic approach. Using the disc margin as defined by
ABRÀMOFF et al.: RETINAL IMAGING AND IMAGE ANALYSIS 199<br />
area of research. The several clinically used methods to image<br />
the retina were introduced above <strong>and</strong> include fundus photography,<br />
scanning laser ophthalmoscopy, fluorescence imaging,<br />
<strong>and</strong> OCT. Additional retinal imaging techniques such as hyperspectral<br />
imaging, oxymetry, <strong>and</strong> adaptive optics SLO will bring<br />
higher resolution.<br />
To achieve a comprehensive description of retinal morphology<br />
<strong>and</strong> eventually function, diverse retinal images<br />
acquired by different or the same modalities at different time<br />
instants must be mutually registered to spatially combine all<br />
available local information. The following sections provide a<br />
brief overview of fundus photography <strong>and</strong> OCT registration<br />
approaches in both two <strong>and</strong> three dimensions. Registration of<br />
retinal images from other existing <strong>and</strong> future imaging devices<br />
can be performed in a similar or generally identical manner.<br />
A. Registration of Fundus <strong>Retinal</strong> Photographs<br />
Fig. 35. Example illustration of differences between structure-based segmentation<br />
of NCO/cup on OCT, glaucoma expert definition of optic disc margin <strong>and</strong><br />
cup from manual planimetry, <strong>and</strong> pixel-classification-based segmentation of<br />
disc/cup on OCT. From top to bottom: raw SD-OCT <strong>and</strong> corresponding fundus<br />
image (top), structure-based (row 2), expert (on fundus photography) (row 3),<br />
<strong>and</strong> pixel-classification-based (bottom) segmentations overlapping with raw<br />
SD-OCT <strong>and</strong> corresponding fundus image. From left to right: SD-OCT central<br />
B-scan (left) <strong>and</strong> fundus image (right). Yellow arrows indicate position of NCO<br />
from algorithm (with dashed yellow line indicating projected NCO position).<br />
Blue arrows indicate clinical disc margin from RS. Green <strong>and</strong> red colors<br />
indicate each method’s projected rim <strong>and</strong> cup regions, respectively [170].<br />
three glaucoma experts on stereo fundus photography as the<br />
reference st<strong>and</strong>ard (RS), they found mean unsigned <strong>and</strong> signed<br />
border differences of 2.81 1.48 pixels (0.084 0.044 mm)<br />
<strong>and</strong> 0.99 2.02 pixels 0.030 0.061 mm , respectively.<br />
The correlations of the linear cup-to-disc (NCO) area ratio, disc<br />
(NCO) area, rim area, <strong>and</strong> cup area of the algorithm with the RS<br />
were 0.85, 0.77, 0.69, <strong>and</strong> 0.83, respectively. However, it is important<br />
to note that it was not expected that the projected NCO<br />
positions would perfectly correspond to the optic disc margin<br />
as defined on manual planimetry, as illustrated in Fig. 35.<br />
VI. MULTIMODALITY RETINAL IMAGING<br />
Multimodality imaging is becoming increasingly common in<br />
ophthalmology. For image information from multiple modalities<br />
to be usable in mutual context, images must be registered so<br />
that the independent information that was acquired by different<br />
methods can be concatenated <strong>and</strong> form a multimodality description<br />
vector. Thus, because of its importance in enabling multimodal<br />
analysis, retinal image registration reflects another active<br />
Registration of fundus photographs taken either at different<br />
regions of the retina, or of the same area of the retina but at<br />
different times are useful to exp<strong>and</strong> the effective field of view<br />
of a retinal image, determine what part of the retina is being<br />
viewed, or helps in analyzing changes over time [174]. We<br />
have discussed some other uses for fundus–fundus registration<br />
in Section IV-C devoted to retinal atlases.<br />
To register (2-D, planar) fundus images, most existing<br />
registration approaches utilize identification <strong>and</strong> extraction<br />
of features derived from retinal vasculature segmented separately<br />
from the individual fundus images. The choice of a<br />
specific image registration algorithm to align retinal images<br />
into a montage depends on the image characteristics <strong>and</strong> the<br />
application. <strong>Image</strong>s acquired with only a small overlap may be<br />
optimally aligned using feature-based registration approaches,<br />
while images acquired with larger overlaps may be satisfactorily<br />
aligned using intensity-based approaches. Examples of<br />
feature-based registration are global-to-local matching [175],<br />
hierarchical model refinement [176], <strong>and</strong> dual-bootstrap [177].<br />
Local intensity features [178] are particularly useful when an<br />
insufficient number of vascular features are available.<br />
Following a step of vascular skeletonization, vascular<br />
branching points can be easily used as stable l<strong>and</strong>marks<br />
for determining image-to-image correspondence [see<br />
Fig. 36(a) <strong>and</strong> (b)]. As an example, the RADIC model [179]<br />
parameters are estimated during an optimization step that uses<br />
Powell’s method [180] <strong>and</strong> is driven by the vessel center line<br />
distance (see also Section IV-C). The approach presented in<br />
[181] reported registration accuracy of 1.72 0.04 pixels<br />
(25–30 m, depending on resolution) when tested in 462 pairs<br />
of green channel fundus images. The registration accuracy was<br />
assessed as the vessel line error [see Fig. 36(c)]. The method<br />
only needed two correspondence points to be reliably identified<br />
<strong>and</strong> was therefore applicable even to cases when only a very<br />
small overlap between the retinal image pairs existed. Based<br />
on the identified vascular features, the general approach can<br />
be applied to any retinal imaging modality for which a 2-D<br />
vessel segmentation is available. Fig. 37 shows a wide-field of<br />
view retinal image constructed from eight individual fundus<br />
photographs.
200 IEEE REVIEWS IN BIOMEDICAL ENGINEERING, VOL. 3, 2010<br />
Fig. 36. Example of fundus retinal image registration. (a) Detail of two fundus images with detected vessel centerlines. (b) Identified vessel l<strong>and</strong>marks. (c) Example<br />
registration result achieved on two overlapping fundus images.<br />
Fig. 37. <strong>Retinal</strong> fundus image registration. Wide-angle fundus image is constructed<br />
by mutual registration of eight individual fundus photographs.<br />
In registering poor quality multimodal fundus image pairs,<br />
which may not have sufficient vessel-based features available,<br />
Chen et al. proposed the detection of corner points using a Harris<br />
detector followed by use of a partial intensity invariant feature<br />
descriptor (PIIFD) [182]. They reported obtaining 89.9% “acceptable”<br />
registrations (defined as registrations with a median<br />
error 1.5 pixels <strong>and</strong> a maximum error 10 pixels when compared<br />
with ground truth correspondences) when tested on 168<br />
pairs of multimodal retinal images.<br />
B. Registration of OCT With Fundus <strong>Retinal</strong> Photographs<br />
Registration of 2-D fundus images with inherently 3-D OCT<br />
images requires that the dimensionality of OCT be reduced to<br />
two dimensions via -axis projection. Building on the ability<br />
to obtain vascular segmentation from 3-D OCT projection images<br />
(Section V-B), the problem of fundus-OCT registration<br />
becomes virtually identical to that of fundus–fundus registration<br />
that was described in the previous section. Using the same<br />
general method, high-quality OCT-fundus registration can be<br />
achieved as demonstrated in Fig. 38. Fig. 39 presents the main<br />
steps of the registration process <strong>and</strong> shows the achieved registration<br />
performance.<br />
C. Mutual Registration of 3-D OCT <strong>Image</strong>s<br />
Temporal changes of retinal layers leading to assessment of<br />
disease progression or regression can be accessed from longitudinal<br />
OCT images. Similar to the cases discussed above, comparison<br />
of morphology or function over time requires that the<br />
respective OCT image data sets be registered. Since OCT is a<br />
3-D imaging modality, such registration needs to be performed<br />
in three dimensions. For followup studies, image registration is<br />
a vital tool to enable more precise, quantitative comparison of<br />
disease status. Registration of time-domain <strong>and</strong> spectral-domain<br />
OCT images for longitudinal analysis of RNFL thickness measurement<br />
can be found in [183]. Another important aspect of<br />
OCT to OCT registration is the ability to enlarge retinal coverage<br />
by registering OCT data resulting from imaging different<br />
portions of the retina.<br />
A fully 3-D scale-invariant feature transform (SIFT)-based<br />
approach was introduced in [184]. In their work, the SIFT feature<br />
extractor locates minima <strong>and</strong> maxima in the difference of<br />
Gaussian scale space to identify salient feature points. Using<br />
calculated histograms of local gradient directions around each<br />
found extremum in three dimensions, the matching points are<br />
found by comparing the distances between feature vectors. An<br />
application of this approach to rigid registration of peripapillary<br />
(ONH-centered) <strong>and</strong> macula-centered 3-D OCT scans of the<br />
same patient for which the macular <strong>and</strong> peripapillary OCT scans<br />
had only a limited overlap was reported in [184]. The work built<br />
on a number of analysis steps introduced earlier, including segmentation<br />
of the main retinal layers <strong>and</strong> 3-D flattening of each of<br />
the two volumes to be registered (Section V-A2). Three-dimensional<br />
SIFT feature points were subsequently determined as described<br />
in [185]–[187]. Using the terminology usual for image<br />
registration when one of the registered images is called source<br />
(say the macular image) <strong>and</strong> the other target (say the peripapillary<br />
image), the feature point detection is performed in both the<br />
source <strong>and</strong> target images. After feature point extraction, those<br />
which are in corresponding positions in both images are identified.<br />
In a typical pair of two OCT scans, about 70 matching<br />
pairs can be found with a high level of certainty. Considering<br />
the already flattened 3-D OCT image pair, the major remaining<br />
deformations that need to be resolved are translation <strong>and</strong> limited<br />
rotation. Consequently, simple rigid or affine transform is<br />
appropriate to achieve the desired image registration. The transform<br />
parameters are estimated from the identified correspondence<br />
points.
ABRÀMOFF et al.: RETINAL IMAGING AND IMAGE ANALYSIS 201<br />
Fig. 38. Registration of fundus images to 2-D OCT projection data. (a) Fundus camera image. (b) Two-dimensional projection (through depth dimension) of 3-D<br />
OCT data. (c) Registered <strong>and</strong> blended fundus-OCT images via application of affine transformation model with three identified vascular l<strong>and</strong>marks.<br />
Fig. 39. Step-by-step process of registering fundus images to 2-D OCT projection data of the same subject. (a) Color fundus image. (b) Vascular segmentation<br />
in fundus image. (c) OCT projection image. (d) Vascular segmentation in OCT projection image. (e) ONH area <strong>and</strong> ONH center detected in fundus image.<br />
(f) Vascular center lines (blue) <strong>and</strong> bifurcations (red) in fundus image—bifurcations serve as prospective l<strong>and</strong>marks for which correspondence with OCT l<strong>and</strong>marks<br />
is determined in the next step. (g) ONH area <strong>and</strong> ONH center detected in OCT projection image. (h) Vascular centerlines (blue) <strong>and</strong> bifurcations (red) in<br />
OCT image—bifurcations serve as prospective l<strong>and</strong>marks for which correspondence with fundus l<strong>and</strong>marks is determined in the next step. (i) Highest reliability<br />
OCT-fundus corresponding l<strong>and</strong>marks identified in fundus image. (j) Highest reliability OCT-fundus corresponding l<strong>and</strong>marks identified in OCT image. (k) Registered<br />
OCT-fundus image—quality of registration shown in checkerboard image. (l) Registered OCT-fundus image—averaging-based blending used to construct<br />
image.<br />
Fig. 40 demonstrates the functionality of such an approach<br />
to OCT-OCT registration of macular <strong>and</strong> peripapillary OCT<br />
scans [184], their 3-D registration achieved 3-D accuracy of<br />
2.0 3.3 voxels, assessed as an average voxel distance error in<br />
1572 matched locations. Qualitative evaluation of performance<br />
demonstrated the utility of this approach to clinical-quality images.<br />
Temporal registration of longitudinally acquired OCT images<br />
from the same subjects can be obtained in an identical<br />
manner.<br />
VII. FUTURE OF RETINAL IMAGING AND IMAGE ANALYSIS<br />
As we have seen, translation of research in imaging <strong>and</strong> image<br />
analysis has been relatively rapid in the past <strong>and</strong> can be expected<br />
to be rapid in the future. This is partially explained by the lower
202 IEEE REVIEWS IN BIOMEDICAL ENGINEERING, VOL. 3, 2010<br />
Fig. 40. Three-dimensional registration of macular <strong>and</strong> peripapillary OCT from the same subjects. Z-axis projection images of registered volumes are shown in<br />
left column. Representative depth-axis slices from volumes are shown on right to demonstrate registration performance in three dimensions. Location of displayed<br />
slice is indicated by a black line on registered projection images. Overlapping areas of scans are outlined by dashed rectangles to demonstrate that only relatively<br />
small regions of overlap existed. Within these rectangular patches, image data from both OCT images are shown intermittently in a checkerboard pattern to illustrate<br />
agreement of resulting registration. In projection images (same as in fundus photography), optic nerve head can be identified as a large dark region with vasculature<br />
emanating from that region while fovea can be identified as a small dark region centrally located in nonvascular region of the registered image.<br />
capital expenditure for ophthalmic imaging devices compared to<br />
radiologic imaging devices, which can often be 10 to 100 times<br />
more expensive. It is affected by the fact that ophthalmologists<br />
manage patients directly <strong>and</strong> are also directly involved in the<br />
ordering <strong>and</strong> interpreting of images, while radiologists typically<br />
do not directly manage patients. The subtle difference in the<br />
physician–patient relationship leads to a more direct coupling<br />
between imaging innovation <strong>and</strong> clinical impact that is so well<br />
visible in ophthalmic imaging <strong>and</strong> analysis.<br />
Given that, it can be expected that translation of fundamental<br />
research findings in ophthalmology will remain rapid in the future.<br />
Realizing that the most rapid pace of medical imaging <strong>and</strong><br />
image analysis progress in generally is seen in two scenarios:<br />
1) when the amount of data to be analyzed <strong>and</strong> interpreted by<br />
a physician is excessively large <strong>and</strong>/or 2) when the analysis is<br />
complex <strong>and</strong> requires quantitation <strong>and</strong> thus is not well matched<br />
to the generally qualitative nature of human expert interpretation.<br />
Ophthalmologic applications <strong>and</strong> needs fall in both of these<br />
categories <strong>and</strong> the need to computerize <strong>and</strong> automate the image<br />
interpretation is correspondingly high.<br />
We expect the highest impact to be associated with the following<br />
areas.<br />
1) Cost-effective imaging <strong>and</strong> image analysis for wide scale<br />
ophthalmic <strong>and</strong>/or systemic disease detection in a population<br />
screening setting—this will likely be accomplished<br />
by a quick retinal exam utilizing low-cost high-resolution<br />
fundus imaging.<br />
We expect that the move towards the quick retinal<br />
exam—for example, through smart, portable, low-cost<br />
cameras which have integrated image analysis—will<br />
eventually make the assessment of the retina as simple,<br />
patient friendly, cost-effective <strong>and</strong> uneventful as a blood<br />
pressure check.<br />
2) Management of complex ophthalmic diseases utilizing<br />
image-guided treatment—that will be heavily dependent<br />
on quantitative characteristics derived from fundus <strong>and</strong><br />
OCT image data <strong>and</strong> will consider multimodality <strong>and</strong> longitudinal<br />
image sequences as well as linkages to systemic<br />
patient data.<br />
We expect that image analysis <strong>and</strong> interpretation will be<br />
coupled to genetic <strong>and</strong> other assessment indices allowing<br />
truly personalized approaches to complex analyses of<br />
broad sets of patient-specific data. On the technological<br />
side, it will require <strong>and</strong> will thus lead to development<br />
<strong>and</strong> wide utilization of highly automated techniques<br />
for combined analysis of retinal image data in two,<br />
three <strong>and</strong> four dimensions (3-D+time), identification<br />
<strong>and</strong> quantitative assessment of temporal changes, including<br />
the assessment of local <strong>and</strong>/or systemic severity<br />
of the findings. On the patient-management side, it will<br />
therefore lead to broad utilization of semi-automated,<br />
clinician supervised management of retinal diseases, especially<br />
diabetic retinopathy, glaucoma, <strong>and</strong> choroidal<br />
neovascularization.
ABRÀMOFF et al.: RETINAL IMAGING AND IMAGE ANALYSIS 203<br />
Overall, we envision that within the next decade, the utilization<br />
of retinal imaging will go far beyond the direct needs<br />
of ophthalmic disease management. We expect that the retinal<br />
exam will become broadly used in systemic disease assessment<br />
both for patient specific care <strong>and</strong> for population studies. The<br />
unique ability of the eye to communicate the systemic status of<br />
the human body will be much more broadly utilized than today,<br />
with the obvious applications to diabetes mellitus <strong>and</strong> cardiovascular<br />
diseases likely coming first. Diseases like multiple sclerosis,<br />
Huntington’s disease, <strong>and</strong> a barrage of other brain diseases<br />
<strong>and</strong> neuropathies will likely follow at a fast pace.<br />
<strong>Retinal</strong> imaging <strong>and</strong> image analysis have developed rapidly<br />
over the past ten years, <strong>and</strong> image analysis is starting to play a<br />
crucial role in the care of patients with retinal diseases, as well<br />
as diseases that manifest in the retina. So far, image analysis<br />
has mostly operated reactively, i.e., waiting for what the newest<br />
image devices have as output <strong>and</strong> then trying to find approaches<br />
to analyze <strong>and</strong> quantify the image data. We expect that imaging<br />
device development <strong>and</strong> image analysis research will start to operate<br />
more in concert <strong>and</strong> that this paradigm is ready for prime<br />
time. We expect the image acquisition <strong>and</strong> subsequent image<br />
analysis to become closely integrated, so that image analysis<br />
successes <strong>and</strong> difficulties can directly influence device developers<br />
to focus on details that will help reliably analyze the images<br />
<strong>and</strong> vice versa.<br />
Ultimately, the presented overview of the ophthalmic imaging<br />
research <strong>and</strong> development in this field is driven by the overarching<br />
goal of preventing blindness <strong>and</strong> visual loss. We expect<br />
that this integrated development, in which a number of high-profile<br />
groups participate worldwide, will recognize the somewhat<br />
different needs of the developed as well as the developing world.<br />
ACKNOWLEDGMENT<br />
When conducting multidisciplinary research like the one<br />
reviewed in this paper, many colleagues contribute to the work<br />
reported <strong>and</strong> to the way how material is presented. We would<br />
like to acknowledge the contribution of our colleagues, collaborators,<br />
<strong>and</strong> friends: B. Antony, M. Christopher, H. W. van Dijk,<br />
M. Dolejsi, J. Folk, P. Gupta, Z. Hu, C. Johnson, Y. H. Kwon,<br />
K. Lee, S. Lee, V. Mahajan, M. Niemeijer, R. H. Kardon,<br />
G. Quellec, J. M. Reinhardt, A. Rothova, S. R. Russell,<br />
T. Scheetz, L. Tang, F. D. Verbraak, J. Vinayak, A. Wahle,<br />
<strong>and</strong> X. Wu who spent numerous hours discussing ophthalmic<br />
imaging <strong>and</strong> image analysis with us over the course of many<br />
years.<br />
REFERENCES<br />
[1] A. C. Van Trigt, Dissertatio ophthalmologica inauguralis de speculo<br />
oculi. : Trajecti ad Rhenum, 1853.<br />
[2] H. Kolb, “How the retina works,” Amer. Scientist, vol. 91, no. 1, pp.<br />
28–35, 2003.<br />
[3] H. Kolb, E. Fern<strong>and</strong>ez, R. Nelson, <strong>and</strong> B. W. Jones, Webvision: Organization<br />
of the retina <strong>and</strong> visual system 2005 [Online]. Available:<br />
http://webvision.med.utah.edu/<br />
[4] WHO [Online]. Available: http://www.who.int/diabetes/publications/<br />
Definition<strong>and</strong>diagnosisofdiabetes_new.pdf<br />
[5] Nat. Eye Inst., <strong>Visual</strong> problems in the U.S. 2002, Nat. Eye Inst. [Online].<br />
Available: http://www.nei.nih.gov/eyedata/pdf/VPUS.pdf<br />
[6] NHIS, 2004–2006 Nat. Health Interview Survey (NHIS) Nat. Center<br />
for Health Statistics, Centers for Disease Control <strong>and</strong> Prevention, 2007<br />
[Online]. Available: www.cdc.gov/nchs/nhis.htm, Tech. Rep.<br />
[7] Centers for Disease Control, Nat. Diabetes Fact Sheet 2008 [Online].<br />
Available: http://apps.nccd.cdc.gov/DDTSTRS/FactSheet.aspx<br />
[8] D. C. Klonoff <strong>and</strong> D. M. Schwartz, “An economic analysis of interventions<br />
for diabetes,” Diabetes Care, vol. 23, no. 3, pp. 390–404, Mar.<br />
2000.<br />
[9] Early Treatment Diabetic Retinopathy Study research group, “Early<br />
photocoagulation for diabetic retinopathy. ETDRS Rep. 9,” <strong>Ophthalmology</strong>,<br />
vol. 98, no. 5 suppl, pp. 766–785, 1991.<br />
[10] T. A. Ciulla, A. G. Amador, <strong>and</strong> B. Zinman, “Diabetic retinopathy <strong>and</strong><br />
diabetic macular edema: Pathophysiology, screening, <strong>and</strong> novel therapies,”<br />
Diabetes Care, vol. 26, no. 9, pp. 2653–2664, 2003.<br />
[11] T. Otani, S. Kishi, <strong>and</strong> Y. Maruyama, “Patterns of diabetic macular<br />
edema with optical coherence tomography,” Amer. J. Ophthalmol., vol.<br />
127, no. 6, pp. 688–693, 1999.<br />
[12] M. O. Tso, “Pathology of cystoid macular edema,” <strong>Ophthalmology</strong>, vol.<br />
89, no. 8, pp. 902–915, 1982.<br />
[13] C. V. Lardenoye, K. Probst, P. J. DeLint, <strong>and</strong> A. Rothova, “Photoreceptor<br />
function in eyes with edema,” Invest. Ophthalmol. Vis. Sci., vol.<br />
41, no. 12, pp. 4048–4053, 2000.<br />
[14] Diabetic Retinopathy Study Group, “Photocoagulation treatment<br />
of proliferative diabetic retinopathy: Clinical application of DRS<br />
findings: DRS Rep. 8,” <strong>Ophthalmology</strong>, vol. 88, pp. 583–600, 1981.<br />
[15] Diabetic Retinopathy Study Group, “Factors influencing the development<br />
of visual loss in advanced diabetic retinopathy: DRS Rep. 9,” Invest.<br />
Ophthalmol. Vis. Sci., vol. 26, pp. 983–991, 1985.<br />
[16] Diabetic Retinopathy Study Group, “Indications for photocoagulation<br />
treatment of diabetic retinopathy: DRS Rep. 14,” Int. Ophthalmol.<br />
Clin., vol. 27, pp. 239–253, 1987.<br />
[17] Eye Diseases Prevalence Research Group, “Prevalence of age-related<br />
macular degeneration in the united states,” Arch. Ophthalmol., vol. 122,<br />
no. 4, pp. 564–572, Apr. 2004.<br />
[18] SMDS Investigators, “Argon laser photocoagulation for senile macular<br />
degeneration—Results of a r<strong>and</strong>omized clinical trial,” Arch. Ophthalmol.,<br />
vol. 100, pp. 912–918, 1982.<br />
[19] Age-Related Eye Disease Study Research Group, “A r<strong>and</strong>omized,<br />
placebo-controlled, clinical trial of high-dose supplementation with<br />
vitamins C <strong>and</strong> E, beta carotene, <strong>and</strong> zinc for age-related macular<br />
degeneration <strong>and</strong> vision loss: AREDS Rep. 8,” Arch. Ophthalmol.,<br />
vol. 119, pp. 1417–1436, 2001.<br />
[20] R. F. Spaide, K. Laud, H. F. Fine, J. M. Klancnik, C. B. Meyerle, L.<br />
A. Yannuzzi, J. Sorenson, J. Slakter, Y. L. Fisher, <strong>and</strong> M. J. Cooney,<br />
“Intravitreal bevacizumab treatment of choroidal neovascularization<br />
secondary to age-related macular degeneration,” Retina, vol. 26, pp.<br />
383–390, 2006.<br />
[21] G. A. Lalwani, P. J. Rosenfeld, A. E. Fung, S. R. Dubovy, S. Michels,<br />
W. Feuer, J. L. Davis, H. W. Flynn, Jr, <strong>and</strong> M. Esquiabro, “A variabledosing<br />
regimen with intravitreal ranibizumab for neovascular age-related<br />
macular degeneration: Year 2 of the pronto study,” Amer. J. Ophthalmol.,<br />
vol. 148, pp. 43–58, 2009.<br />
[22] J. M. Tielsch, J. Katz, K. Singh, H. A. Quigley, J. D. Gottsch, J.<br />
Javitt, <strong>and</strong> A. Sommer, “A population-based evaluation of glaucoma<br />
screening: The Baltimore eye survey,” Amer. J. Epidemiol., vol. 134,<br />
no. 10, pp. 1102–1110, 1991.<br />
[23] A. Heijl, M. C. Leske, B. Bengtsson, L. Hyman, B. Bengtsson, <strong>and</strong><br />
M. Hussein, Early Manifest Glaucoma Trial Group, “Reduction of<br />
intraocular pressure <strong>and</strong> glaucoma progression: Results from the early<br />
manifest glaucoma trial,” Arch. Ophthalmol., vol. 120, no. 10, pp.<br />
1268–1279, 2002.<br />
[24] T. Y. Wong, A. Shankar, R. Klein, B. E. K. Klein, <strong>and</strong> L. D. Hubbard,<br />
“Prospective cohort study of retinal vessel diameters <strong>and</strong> risk of hypertension,”<br />
BMJ, vol. 329, pp. 799–800, 2004.<br />
[25] L. D. Hubbard, R. J. Brothers, W. N. King, L. X. Clegg, R. Klein, L.<br />
S. Cooper, A. R. Sharrett, M. D. Davis, <strong>and</strong> J. Cai, “Methods for evaluation<br />
of retinal microvascular abnormalities associated with hypertension/sclerosis<br />
in the atherosclerosis risk in communities study,” <strong>Ophthalmology</strong>,<br />
vol. 106, pp. 2269–2280, 1999.<br />
[26] C. S. Flick, “Centenary of Babbage’s ophthalmoscope,” Optician, vol.<br />
113, p. 246, 1947.<br />
[27] C. R. Keeler, “150 years since Babbage’s ophthalmoscope,” Arch. Ophthalmol.,<br />
vol. 115, pp. 1456–1457, 1997.<br />
[28] D. S. Halacy, Charles Babbage, Father of the Computer. London,<br />
U.K.: Crowell-Collier Press, 1970.<br />
[29] H. L. F. von Helmholtz, Beschreibung eines Augen-Spiegels. : A.<br />
Farstnerische Verlagsbuchh<strong>and</strong>lung, 1851.<br />
[30] J. E. Purkinje, Beobachtungen und Versuche zur Physiologie der Sinne.<br />
Erstes B<strong>and</strong>chen, Beitrage zur Kenntniss des Sehens in subjectiver Hinsicht.<br />
Prague, Austria: , 1823.<br />
[31] O. Gerloff, “Uber die Photographie des Augenhintergrundes,” Klin<br />
Monatsblätter Augenheilkunde, vol. 29, pp. 397–403, 1891.
204 IEEE REVIEWS IN BIOMEDICAL ENGINEERING, VOL. 3, 2010<br />
[32] A. Gullstr<strong>and</strong>, “Neue methoden der reflexlosen ophthalmoskopie,”<br />
Berichte Deutsche Ophthalmologische Gesellschaft, vol. 36, 1910.<br />
[33] H. R. Novotny <strong>and</strong> D. L. Alvis, “A method of photographing fluorescence<br />
in circulating blood in the human retina,” Circulation, vol. 24,<br />
pp. 82–86, 1961.<br />
[34] L. Allen, “Ocular fundus photography: Suggestions for achieving consistently<br />
good pictures <strong>and</strong> instructions for stereoscopic photography,”<br />
Amer. J. Ophthalmol., vol. 57, pp. 13–28, 1964.<br />
[35] R. H. Webb <strong>and</strong> G. W. Hughes, “Scanning laser ophthalmoscope,”<br />
IEEE Trans. Biomed. Eng., vol. 28, no. 4, pp. 488–492, Apr. 1981.<br />
[36] D. Huang, E. A. Swanson, C. P. Lin, J. S. Schuman, W. G. Stinson,<br />
W. Chang, M. R. Hee, T. Flotte, K. Gregory, C. A. Puliafito, <strong>and</strong> J.<br />
G. Fujimoto, “Optical coherence tomography,” Science, vol. 254, no.<br />
5035, pp. 1178–1181, Nov. 1991.<br />
[37] M. E. J. van Velthoven, D. J. Faber, F. D. Verbraak, T. G. van Leeuwen,<br />
<strong>and</strong> M. D. de Smet, “Recent developments in optical coherence tomography<br />
for imaging the retina,” Prog. Retina Eye Res., vol. 26, no. 1, pp.<br />
57–77, Jan. 2007.<br />
[38] M. Matsui, T. Tashiro, K. Matsumoto, <strong>and</strong> S. Yamamoto, “A study on<br />
automatic <strong>and</strong> quantitative diagnosis of fundus photographs. I. Detection<br />
of contour line of retinal blood vessel images on color fundus photographs<br />
(author’s transl.),” Nippon Ganka Gakkai Zasshi, vol. 77, no.<br />
8, pp. 907–918, 1973, [Online]. Available: PM:4594062.<br />
[39] C. E. Baudoin, B. J. Lay, <strong>and</strong> J. C. Klein, “Automatic detection of<br />
microaneurysms in diabetic fluorescein angiography,” Rev. Epidemiol.<br />
Sante Publique, vol. 32, no. 3–4, pp. 254–261, 1984, [Online]. Available:<br />
PM:0006522738.<br />
[40] M. Sonka, V. Hlavac, <strong>and</strong> R. Boyle, <strong>Image</strong> Processing, <strong>Analysis</strong>, <strong>and</strong><br />
Machine Vision, 3rd ed. Toronto, Canada: Thomson Engineering,<br />
2008, (1st edition Chapman <strong>and</strong> Hall, London, 1993; 2nd edition<br />
PWS, Pacific Grove, CA, 1997).<br />
[41] M. Choma, M. Sarunic, C. Yang, <strong>and</strong> J. Izatt, “Sensitivity advantage of<br />
swept source <strong>and</strong> fourier domain optical coherence tomography,” Opt.<br />
Expr., vol. 11, pp. 2183–2189, 2003.<br />
[42] M. D. Abramoff, R. Kardon, K. Vermeer, <strong>and</strong> M. Mensink, “A portable,<br />
patient friendly scanning laser ophthalmoscope for diabetic retinopathy<br />
imaging: Exudates <strong>and</strong> hermorrhages,” in ARVO Annu. Meeting, Abstract,<br />
2007.<br />
[43] D. X. Hammer, R. D. Ferguson, T. E. Ustun, C. D. Bigelow, N. V.<br />
Iftimia, <strong>and</strong> R. H. Webb, “Line-scanning laser ophthalmoscope,” J.<br />
Biomed. Opt., vol. 11, 2006.<br />
[44] J. V. D. Kraats <strong>and</strong> D. van Norren, “Directional <strong>and</strong> nondirectional<br />
spectral reflection from the human fovea,” J. Biomed. Opt., vol. 13,<br />
2008.<br />
[45] F. C. Delori <strong>and</strong> K. P. Pflibsen, “Spectral reflectance of the human<br />
ocular fundus,” Appl. Opt., vol. 28, no. 6, pp. 1061–1077, 1989.<br />
[46] M. D. Abramoff, Y. H. Kwon, D. Ts’o, P. Soliz, B. Zimmerman, J.<br />
Pokorny, <strong>and</strong> R. Kardon, “<strong>Visual</strong> stimulus-induced changes in human<br />
near-infrared fundus reflectance,” Invest. Ophthalmol. Vis. Sci., vol. 47,<br />
no. 2, pp. 715–721, 2006, [Online]. Available: PM:16431972.<br />
[47] M. Mujat, R. D. Ferguson, N. Iftimia, <strong>and</strong> D. X. Hammer, “Compact<br />
adaptive optics line scanning ophthalmoscope,” Opt. Expr., vol. 17,<br />
2009.<br />
[48] D. M. de Bruin, D. L. Burnes, J. Loewenstein, Y. Chen, S. Chang, T.<br />
C. Chen, D. D. Esmaili, <strong>and</strong> J. F. de Boer, “In vivo three-dimensional<br />
imaging of neovascular age-related macular degeneration using optical<br />
frequency domain imaging at 1050 nm,” Invest. Ophthalmol. Vis. Sci.,<br />
vol. 49, pp. 4545–4552, 2008.<br />
[49] American Telemedicine Association, Ocular Telehealth Special Interest<br />
Group, 2004, Telehealth Practice Recommendations for Diabetic<br />
Retinopathy [Online]. Available: http://www.atmeda.org/ICOT/diabeticretionpathy.FINAL.pdf<br />
[50] G. H. Bresnick, D. B. Mukamel, J. C. Dickinson, <strong>and</strong> D. R. Cole, “A<br />
screening approach to the surveillance of patients with diabetes for the<br />
presence of vision-threatening retinopathy,” <strong>Ophthalmology</strong>, vol. 107,<br />
no. 1, pp. 19–24, 2000, [Online]. Available: PM:0010647713.<br />
[51] J. L. Kinyoun, D. C. Martin, W. Y. Fujimoto, <strong>and</strong> D. L. Leonetti, “Ophthalmoscopy<br />
versus fundus photographs for detecting <strong>and</strong> grading diabetic<br />
retinopathy,” Invest. Ophthalmol. Vis. Sci., vol. 33, no. 6, pp.<br />
1888–1893, 1992, [Online]. Available: PM:0001582794.<br />
[52] American Acad. <strong>Ophthalmology</strong> Retina Panel, 2003, Preferred practice<br />
pattern: Diabetic retinopathy [Online]. Available: www.aao.org/ppp<br />
[53] D. S. Fong, L. Aiello, T. W. Gardner, G. L. King, G. Blankenship, J.<br />
D. Cavallerano, I. Ferris, F. L. , <strong>and</strong> R. Klein, “Diabetic retinopathy,”<br />
Diabetes Care, vol. 26, no. 1, pp. 226–229, 2003, [Online]. Available:<br />
PM:12502685.<br />
[54] D. S. Fong, M. Sharza, W. Chen, J. F. Paschal, R. G. Ariyasu, <strong>and</strong> P.<br />
P. Lee, “Vision loss among diabetics in a group model health maintenance<br />
organization (HMO),” Amer. J. Ophthalmol., vol. 133, no. 2, pp.<br />
236–241, 2002, [Online]. Available: PM:11812428.<br />
[55] D. F. Wilson, S. A. Vinogradov, P. Grosul, M. N. Vaccarezza, A.<br />
Kuroki, <strong>and</strong> J. Bennett, “Oxygen distribution <strong>and</strong> vascular injury<br />
in the mouse eye measured by phosphorescence-lifetime imaging,”<br />
Appl. Opt., vol. 44, no. 25, pp. 5239–5248, 2005, [Online]. Available:<br />
PM:16149347.<br />
[56] D. Y. Lin, M. S. Blumenkranz, R. J. Brothers, <strong>and</strong> D. M.<br />
Grosvenor, “The sensitivity <strong>and</strong> specificity of single-field nonmydriatic<br />
monochromatic digital fundus photography with remote image<br />
interpretation for diabetic retinopathy screening: A comparison with<br />
ophthalmoscopy <strong>and</strong> st<strong>and</strong>ardized mydriatic color photography,”<br />
Amer. J. Ophthalmol., vol. 134, no. 2, pp. 204–213, 2002, [Online].<br />
Available: PM:12140027.<br />
[57] G. A. Williams, I. U. Scott, J. A. Haller, A. M. Maguire, D. Marcus,<br />
<strong>and</strong> H. R. McDonald, “Single-field fundus photography for diabetic<br />
retinopathy screening: A report by the American academy of ophthalmology,”<br />
<strong>Ophthalmology</strong>, vol. 111, no. 5, pp. 1055–1062, 2004.<br />
[58] M. G. Lawrence, “The accuracy of digital-video retinal imaging to<br />
screen for diabetic retinopathy: An analysis of two digital-video retinal<br />
imaging systems using st<strong>and</strong>ard stereoscopic seven-field photography<br />
<strong>and</strong> dilated clinical examination as reference st<strong>and</strong>ards,” Trans. Amer.<br />
Ophthalmol. Soc., vol. 102, pp. 321–340, 2004, [Online]. Available:<br />
PM:15747766.<br />
[59] M. D. Abramoff <strong>and</strong> M. S. Suttorp-Schulten, “Web based screening<br />
for diabetic retinopathy in a primary care population: The EyeCheck<br />
project,” J. Telemedicine E-Health, vol. 11, pp. 668–674, 2005.<br />
[60] N. Cheung, G. Liew, R. I. Lindley, E. Y. Liu, J. J. Wang, P. H<strong>and</strong>,<br />
M. Baker, P. Mitchell, <strong>and</strong> T. Y. Wong, “<strong>Retinal</strong> fractals <strong>and</strong><br />
acute lacunar stroke,” Ann Neurol vol. 68, no. 1, pp. 107–11, 2010<br />
[Online]. Available: http://www.biomedsearch.com/nih/<strong>Retinal</strong>-fractals-acute-lacunar-stroke/20582985.html<br />
[61] T. Y. Wong, N. Cheung, F. M. Islam, R. Klein, M. H. Criqui, M.<br />
F. Cotch, J. J. Carr, B. E. Klein, <strong>and</strong> A. R. Sharrett, “Relation of<br />
retinopathy to coronary artery calcification: The multi-ethnic study<br />
of atherosclerosis,” Amer. J. Epidemiol., vol. 167, no. 1, pp. 51–58,<br />
September 2008.<br />
[62] Early Treatment Diabetic Retinopathy Study research group, “Photocoagulation<br />
for diabetic macular edema. Early treatment diabetic<br />
retinopathy study report number 1. Early treatment Diabetic<br />
Retinopathy Study research group,” Arch. Ophthalmol., vol. 103, no.<br />
12, pp. 1796–1806, 1985.<br />
[63] J. Kinyoun, F. Barton, M. Fisher, L. Hubbard, L. Aiello, <strong>and</strong> F. Ferris,<br />
“Detection of diabetic macular edema: Ophthalmoscopy versus photography—Early<br />
treatment diabetic retinopathy study (ETDRS) Rep.<br />
5,” <strong>Ophthalmology</strong>, vol. 96, no. 6, pp. 746–750, June. 1989.<br />
[64] Early Treatment Diabetic Retinopathy Study research group, “Fundus<br />
photographic risk factors for progression of diabetic retinopathy.<br />
ETDRS Rep. 12. Early treatment diabetic retinopathy study research<br />
group,” <strong>Ophthalmology</strong>, vol. 98, no. 5 Suppl, pp. 823–833, 1991.<br />
[65] P. J. Rosenfeld, D. M. Brown, J. S. Heier, D. S. Boyer, P. K. Kaiser, C.<br />
Y. Chung, <strong>and</strong> R. Y. Kim, “Ranibizumab for neovascular age-related<br />
macular degeneration,” New Engl. J. Med., vol. 355, pp. 1419–1431,<br />
2006.<br />
[66] D. M. Brown, P. K. Kaiser, M. Michels, G. Soubrane, J. S. Heier,<br />
R. Y. Kim, J. P. Sy, <strong>and</strong> S. Schneider, ANCHOR Study Group,<br />
“Ranibizumab versus verteporfin for neovascular age-related macular<br />
degeneration,” New Engl. J. Med., vol. 355, pp. 1432–1444, 2006.<br />
[67] D. S. Boyer, A. N. Antoszyk, C. C. Awh, R. B. Bhisitkul, H. Shapiro,<br />
<strong>and</strong> N. R. Acharya, MARINA Study Group, “Subgroup analysis of the<br />
marina study of ranibizumab in neovascular age-related macular degeneration,”<br />
<strong>Ophthalmology</strong>, vol. 114, pp. 246–252, 2007.<br />
[68] Y. H. Kwon, M. Adix, M. B. Zimmerman, S. Piette, E. C. Greenlee,<br />
W. L. Alward, <strong>and</strong> M. D. Abramoff, “Variance owing to observer, repeat<br />
imaging, <strong>and</strong> fundus camera type on cup-to-disc ratio estimates by<br />
stereo planimetry,” J. Glaucoma, vol. 18, pp. 305–310, 2009.<br />
[69] M. D. Abramoff, J. M. Reinhardt, S. R. Russell, J. C. Folk, V. B. Mahajan,<br />
M. Niemeijer, <strong>and</strong> G. Quellec, “Automated early detection of<br />
diabetic retinopathy,” <strong>Ophthalmology</strong>, pp. 1147–1154, 2010.<br />
[70] M. D. Abràmoff, M. Niemeijer, M. S. A. Suttorp-Schulten, M. A.<br />
Viergever, S. R. Russell, <strong>and</strong> B. van Ginneken, “Evaluation of a<br />
system for automatic detection of diabetic retinopathy from color<br />
fundus photographs in a large population of patients with diabetes,”<br />
Diabetes Care, vol. 31, no. 2, pp. 193–198, February 2008.
ABRÀMOFF et al.: RETINAL IMAGING AND IMAGE ANALYSIS 205<br />
[71] S. Philip, A. D. Fleming, K. A. Goatman, S. Fonseca, P. Mcnamee, G.<br />
S. Scotl<strong>and</strong>, G. J. Prescott, P. F. Sharp, <strong>and</strong> J. A. Olson, “The efficacy<br />
of automated “disease/no disease” grading for diabetic retinopathy in<br />
a systematic screening programme,” Brit. J. Ophthalmol., vol. 91, no.<br />
11, pp. 1512–1517, November 2007.<br />
[72] A. Hoover, V. Kouznetsova, <strong>and</strong> M. Goldbaum, “Locating blood vessels<br />
in retinal images by piecewise threshold probing of a matched filter<br />
response,” IEEE Trans. Med. <strong>Imaging</strong>, vol. 19, no. 3, pp. 203–210,<br />
2000, [Online]. Available: PM:10875704.<br />
[73] M. Niemeijer, J. S. Staal, B. van Ginneken, M. Loog, <strong>and</strong> M. D.<br />
Abramoff, “Comparative study of retinal vessel segmentation on a new<br />
publicly available database,” in Medical <strong>Imaging</strong>: <strong>Image</strong> <strong>Analysis</strong>.<br />
Proc. SPIE Medical <strong>Imaging</strong>, Vol. 5370, Bellingham, WA, 2004, pp.<br />
658–656, SPIE.<br />
[74] H. F. Jelinek, “Automated vessel segmentation of 35 mm colour nonmydriatic<br />
images in a community health screening project,” MG&V,<br />
vol. 17, no. 1, pp. 57–68, 2008.<br />
[75] J. V. B. Soares, J. J. G. Le, R. M. Cesar, H. F. Jelinek, <strong>and</strong> M. J. Cree,<br />
“<strong>Retinal</strong> vessel segmentation using the 2-D Gabor wavelet <strong>and</strong> supervised<br />
classification,” IEEE Trans. Med. <strong>Imaging</strong>, vol. 25, no. 10, pp.<br />
1214–1222, Oct 2006.<br />
[76] J. Staal, M. D. Abramoff, M. Niemeijer, M. A. Viergever, <strong>and</strong> G. B.<br />
van, “Ridge-based vessel segmentation in color images of the retina,”<br />
IEEE Trans. Med. <strong>Imaging</strong>, vol. 23, no. 4, pp. 501–509, Apr. 2004,<br />
[Online]. Available: PM:15084075.<br />
[77] M. Sonka <strong>and</strong> J. M. Fitzpatrick, H<strong>and</strong>book of Medical<br />
<strong>Imaging</strong>—Volume 2, Medical <strong>Image</strong> Processing <strong>and</strong> <strong>Analysis</strong>.<br />
Wellingham, WA: Int. Soc. Optical Engineering Press, 2000.<br />
[78] B. M. ter Haar Romeny, Front End Vision <strong>and</strong> Multi-Scale <strong>Image</strong> <strong>Analysis</strong>.<br />
Dordrecht: Kluwer, 2003.<br />
[79] M. Niemeijer, B. van Ginneken, <strong>and</strong> M. D. Abramoff, “Automatic<br />
determination of the artery vein ratio in retinal images,” in Medical<br />
<strong>Imaging</strong>: <strong>Image</strong> <strong>Analysis</strong>. Proc. SPIE Medical <strong>Imaging</strong>, Vol. 5376,<br />
Bellingham, WA, 2010.<br />
[80] T. Walter, J. C. Klein, P. Massin, <strong>and</strong> A. Erginay, “A contribution of<br />
image processing to the diagnosis of diabetic retinopathy-detection of<br />
exudates in color fundus images of the human retina,” IEEE Trans.<br />
Med. <strong>Imaging</strong>, vol. 21, no. 10, pp. 1236–1243, Oct. 2002, [Online].<br />
Available: PM:12585705.<br />
[81] T. Spencer, J. A. Olson, K. C. McHardy, P. F. Sharp, <strong>and</strong> J. V. Forrester,<br />
“An image-processing strategy for the segmentation <strong>and</strong> quantification<br />
of microaneurysms in fluorescein angiograms of the ocular fundus,”<br />
Comput. Biomed. Res., vol. 29, no. 4, pp. 284–302, 1996, [Online].<br />
Available: PM:8812075.<br />
[82] A. J. Frame, P. E. Undrill, M. J. Cree, J. C. Olson, K. C. Mchardy,<br />
P. F. Sharp, <strong>and</strong> J. V. Forrester, “A comparison of computer based<br />
classification methods applied to the detection of microaneurysms in<br />
ophthalmic fluorescein angiograms,” Comput. Biol. Med., vol. 28, pp.<br />
225–238, 1998.<br />
[83] J. H. Hipwell, F. Strachan, J. A. Olson, K. C. McHardy, P. F. Sharp,<br />
<strong>and</strong> J. V. Forrester, “Automated detection of microaneurysms in digital<br />
red-free photographs: A diabetic retinopathy screening tool,” Diabet.<br />
Med., vol. 17, no. 8, pp. 588–594, 2000.<br />
[84] M. Niemeijer, B. van Ginneken, J. Staal, M. S. A. Suttorp-Schulten, <strong>and</strong><br />
M. D. Abramoff, “Automatic detection of red lesions in digital color<br />
fundus photographs,” IEEE Trans. Med. <strong>Imaging</strong>, vol. 24, no. 4, pp.<br />
584–592, Apr. 2005.<br />
[85] M. Niemeijer, B. van Ginneken, S. R. Russell, M. S. Suttorp-Schulten,<br />
<strong>and</strong> M. D. Abramoff, “Automated detection <strong>and</strong> differentiation of<br />
drusen, exudates, <strong>and</strong> cotton-wool spots in digital color fundus<br />
photographs for early diagnosis of diabetic retinopathy,” Invest Ophthalmol.<br />
Vis. Sci., vol. 45, 2007.<br />
[86] M. J. Cree, J. A. Olson, K. C. McHardy, P. F. Sharp, <strong>and</strong> J. V. Forrester,<br />
“A fully automated comparative microaneurysm digital detection<br />
system,” Eye, vol. 11, pt. Pt 5, pp. 622–628, 1997.<br />
[87] G. G. Gardner, D. Keating, T. H. Williamson, <strong>and</strong> A. T. Elliott,<br />
“Automatic detection of diabetic retinopathy using an artificial neural<br />
network: A screening tool,” Brit. J. Ophthalmol., vol. 80, no. 11, pp.<br />
940–944, 1996, [Online]. Available: PM:0008976718.<br />
[88] C. Sinthanayothin, J. F. Boyce, T. H. Williamson, H. L. Cook, E.<br />
Mensah, S. Lal, <strong>and</strong> D. Usher, “Automated detection of diabetic<br />
retinopathy on digital fundus images,” Diabet. Med., vol. 19, no. 2, pp.<br />
105–112, 2002, [Online]. Available: PM:11874425.<br />
[89] G. Quellec, M. Lamard, P. M. Josselin, G. Cazuguel, B. Cochener,<br />
<strong>and</strong> C. Roux, “Optimal wavelet transform for the detection of microaneurysms<br />
in retina photographs,” IEEE Trans. Med. <strong>Imaging</strong>, vol. 27,<br />
no. 9, pp. 1230–1241, Sep. 2008.<br />
[90] A. Osareh, M. Mirmehdi, B. Thomas, <strong>and</strong> R. Markham, “Automated<br />
identification of diabetic retinal exudates in digital colour images,” Brit.<br />
J. Ophthalmol., vol. 87, no. 10, pp. 1220–1223, 2003, [Online]. Available:<br />
PM:14507751.<br />
[91] K. W. Tobin, E. Chaum, V. P. Govindasamy, <strong>and</strong> T. P. Karnowski, “Detection<br />
of anatomic structures in human retinal imagery,” IEEE Trans.<br />
Med. <strong>Imaging</strong>, vol. 26, no. 12, pp. 1729–1739, Dec. 2007.<br />
[92] S. Lee, J. M. Reinhardt, P. C. Cattin, <strong>and</strong> M. D. Abramoff, “Objective<br />
<strong>and</strong> expert-independent validation of retinal image registration algorithms<br />
by a projective imaging distortion model,” Med. <strong>Image</strong> Anal.,<br />
vol. 28, no. 1, 2010.<br />
[93] S. Lee, M. D. Abràmoff, <strong>and</strong> J. M. Reinhardt, “<strong>Retinal</strong> image mosaicing<br />
using the radial distortion correction model,” in Proc. SPIE Conf. Medical<br />
<strong>Imaging</strong>, San Diego, CA, Feb. 2008, vol. 6914.<br />
[94] K. Rohr, H. S. Stiehl, R. Sprengel, W. Beil, T. M. Buzug, J. Weese,<br />
<strong>and</strong> M. H. Kuhn, “Point-based elastic registration of medical image<br />
data using approximating thin-plate splines,” in VBC, 1996, pp.<br />
297–306.<br />
[95] M. Lamard, G. Cazuguel, G. Quellec, L. Bekri, C. Roux, <strong>and</strong> B. Cochener,<br />
“Content based image retrieval based on wavelet transform coefficients<br />
distribution,” in Proc. IEEE Int. Conf. 29th Annu. Eng. Med.<br />
Biol. Soc. EMBS, Aug. 2007, pp. 4532–4535.<br />
[96] C. E. Metz, B. A. Herman, <strong>and</strong> J.-H. Shen, “Maximum likelihood estimation<br />
of receiver operating characteristic (ROC) curves from continuously-distributed<br />
data,” Statistics Med., vol. 17, no. 9, pp. 1033–1053,<br />
December 1998.<br />
[97] M. Niemeijer, B. van Ginneken, M. Cree, A. Mizutani, G. Quellec, C.<br />
Sanchez, B. Zhang, R. Hornero, M. Lamard, C. Muramatsu, X. Wu, G.<br />
Cazuguel, J. You, A. Mayo, Q. Li, Y. Hatanaka, B. Cochener, C. Roux,<br />
F. Karray, M. Garcia, H. Fujita, <strong>and</strong> M. D. Abramoff, “Retinopathy online<br />
challenge: Automatic detection of microaneurysms in digital color<br />
fundus photographs,” IEEE Trans. Med. <strong>Imaging</strong>, vol. 29, no. 1, pp.<br />
185–195, Jan. 2010.<br />
[98] M. Niemeijer, M. D. Abramoff, <strong>and</strong> B. van Ginneken, “Information fusion<br />
for diabetic retinopathy CAD in digital color fundus photographs,”<br />
IEEE Trans. Med. <strong>Imaging</strong>, vol. 28, no. 5, pp. 775–785, May 2009.<br />
[99] [Online]. Available: http://reviewdb.lincoln.ac.uk<br />
[100] [Online]. Available: http://messidor.crihan.fr/index-en.php<br />
[101] [Online]. Available: http://vision.middlebury.edu/stereo/<br />
[102] D. Scharstein <strong>and</strong> R. Szeliski, “A taxonomy <strong>and</strong> evaluation of dense<br />
two-frame stereo correspondence algorithms,” Int. J. Computer Vis.,<br />
vol. 47, pp. 7–42, 2002.<br />
[103] [Online]. Available: http://www.isi.uu.nl/Research/Databases/<br />
DRIVE/<br />
[104] [Online]. Available: http://www.netflixprize.com<br />
[105] [Online]. Available: http://roc.healthcare.uiowa.edu<br />
[106] C. I. Sánchez, R. Hornero, A. Mayo, <strong>and</strong> M. García, “Mixture modelbased<br />
clustering <strong>and</strong> logistic regression for automated detection of microaneurysms<br />
in retinal images,” in Proc. SPIE Medical <strong>Imaging</strong> 2009:<br />
Computer Aided Diagnosis, Feb. 2009, vol. 7260, pp. 72 601M-1–72<br />
601M-8.<br />
[107] B. Zhang, X. Wu, J. You, Q. Li, <strong>and</strong> F. Karray, “Hierarchical detection<br />
of red lesions in retinal images by multiscale correlation filtering,” in<br />
Proc. SPIE Medical <strong>Imaging</strong> 2009: Computer Aided Diagnosis, Feb.<br />
2009, vol. 7260, pp. 72 601L-1–72 601L-12.<br />
[108] A. Mizutani, C. Muramatsu, Y. Hatanaka, S. Suemori, T. Hara, <strong>and</strong><br />
H. Fujita, “Automated microaneurysm detection method based on<br />
double-ring filter in retinal fundus images,” in Proc. SPIE Medical<br />
<strong>Imaging</strong> 2009: Computer Aided Diagnosis, Febr. 2009, vol. 7260, pp.<br />
72 601N-1–72 601N-8.<br />
[109] M. Cree, The Waikato Microaneurysm Detector 2008 [Online].<br />
Available: http://roc.healthcare.uiowa.edu/results/documentation/<br />
waikato.pdf<br />
[110] M. D. Abramoff, W. L. Alward, E. C. Greenlee, L. Shuba, C. Y. Kim,<br />
J. H. Fingert, <strong>and</strong> Y. H. Kwon, “Automated segmentation of the optic<br />
disc from stereo color photographs using physiologically plausible features,”<br />
Invest. Ophthalmol. Vis. Sci., vol. 48, pp. 1665–1673, 2007.<br />
[111] D. J. Calkins, Y. Tsukamoto, <strong>and</strong> P. Sterling, “Microcircuitry <strong>and</strong><br />
mosaic of a blue-yellow ganglion cell in the primate retina,” J. Neurosci.,<br />
vol. 18, no. 9, pp. 3373–3385, 1998, [Online]. Available:<br />
PM:9547245.<br />
[112] L. Tang, Y. H. Kwon, W. L. M. Alward, E. C. Greenlee, K. Lee, M.<br />
K. Garvin, <strong>and</strong> M. D. Abramoff, “3D reconstruction of the optic nerve<br />
head using stereo fundus images for computer-aided diagnosis of glaucoma,”<br />
in Proc. SPIE, 2010, vol. 7624, pp. 76 243D–76 243D-8.<br />
[113] T. Poggio <strong>and</strong> D. Marr, “Cooperative computation of stereo disparity,”<br />
Science, 1976.
206 IEEE REVIEWS IN BIOMEDICAL ENGINEERING, VOL. 3, 2010<br />
[114] S. T. Barnard <strong>and</strong> W. B. Thompson, “Disparity analysis of images,”<br />
IEEE Trans. Pattern Anal. Mach. Intell., vol. 2, no. 4, pp. 333–340,<br />
Apr. 1980.<br />
[115] D. Koozekanani, K. Boyer, <strong>and</strong> C. Roberts, “<strong>Retinal</strong> thickness measurements<br />
in optical coherence tomography using a Markov boundary<br />
model,” in Proc. IEEE Conf. Computer Vision Pattern Recognition,<br />
Jun. 2000, vol. 2, pp. 363–370.<br />
[116] D. Koozekanani, K. Boyer, <strong>and</strong> C. Roberts, “<strong>Retinal</strong> thickness<br />
measurements from optical coherence tomography using a Markov<br />
boundary model,” IEEE Trans. Med. <strong>Imaging</strong>, vol. 20, no. 9, pp.<br />
900–916, Sep. 2001.<br />
[117] H. Ishikawa, D. M. Stein, G. Wollstein, S. Beaton, J. G. Fujimoto, <strong>and</strong><br />
J. S. Schuman, “Macular segmentation with optical coherence tomography,”<br />
Invest. Ophthalmol. Vis. Sci., vol. 46, no. 6, pp. 2012–2017, Jun.<br />
2005.<br />
[118] A. Chan, J. S. Duker, H. Ishikawa, T. H. Ko, J. S. Schuman, <strong>and</strong> J. G.<br />
Fujimoto, “Quantification of photoreceptor layer thickness in normal<br />
eyes using optical coherence tomography,” Retina, vol. 26, no. 6, pp.<br />
655–660, 2006.<br />
[119] D. Cabrera Fernández, “Delineating fluid-filled region boundaries in<br />
optical coherence tomography images of the retina,” IEEE Trans. Med.<br />
<strong>Imaging</strong>, vol. 24, no. 8, pp. 929–945, Aug. 2005.<br />
[120] D. Cabrera Fernández, H. M. Salinas, <strong>and</strong> C. A. Puliafito, “Automated<br />
detection of retinal layer structures on optical coherence tomography<br />
images,” Opt. Expr., vol. 13, no. 25, pp. 10 200–10 216, 2005.<br />
[121] M. Shahidi, Z. Wang, <strong>and</strong> R. Zelkha, “Quantitative thickness measurement<br />
of retinal layers imaged by optical coherence tomography,” Amer.<br />
J. Ophthalmol., vol. 139, no. 6, pp. 1056–1061, Jun. 2005.<br />
[122] M. Baroni, P. Fortunato, <strong>and</strong> A. L. Torre, “Towards quantitative analysis<br />
of retinal features in optical coherence tomography,” Med. Eng.<br />
Phys., vol. 29, no. 4, pp. 432–441, May 2007.<br />
[123] M. Haeker (Garvin), M. D. Abràmoff, R. Kardon, <strong>and</strong> M. Sonka, “Segmentation<br />
of the surfaces of the retinal layer from OCT images,” in<br />
Proc. 9th Int. Conf. Medical <strong>Image</strong> Computing Computer-Assisted Intervention<br />
(MICCAI 2006), Part I, 2006, vol. 4190, pp. 800–807, ser.<br />
Lecture Notes in Computer Science, Springer-Verlag.<br />
[124] M. Haeker (Garvin), M. D. Abràmoff, X. Wu, R. Kardon, <strong>and</strong> M.<br />
Sonka, “Use of varying constraints in optimal 3-D graph search for<br />
segmentation of macular optical coherence tomography images,” in<br />
Proc. 10th Int. Conf. Medical <strong>Image</strong> Computing Computer-Assisted<br />
Intervention (MICCAI 2007), 2007, vol. 4791, pp. 244–251, ser.<br />
Lecture Notes in Computer Science, Springer-Verlag.<br />
[125] M. Haeker (Garvin), X. Wu, M. D. Abràmoff, R. Kardon, <strong>and</strong> M.<br />
Sonka, “Incorporation of regional information in optimal 3-D graph<br />
search with application for intraretinal layer segmentation of optical<br />
coherence tomography images,” in Inform. Process. Med. <strong>Imaging</strong><br />
(IPMI), 2007, vol. 4584, pp. 607–618.<br />
[126] M. K. Garvin, M. D. Abràmoff, R. Kardon, S. R. Russell, X. Wu, <strong>and</strong><br />
M. Sonka, “Intraretinal layer segmentation of macular optical coherence<br />
tomography images using optimal 3-D graph search,” IEEE Trans.<br />
Med. <strong>Imaging</strong>, vol. 27, no. 10, pp. 1495–1505, Oct. 2008.<br />
[127] K. Li, X. Wu, D. Z. Chen, <strong>and</strong> M. Sonka, “Optimal surface segmentation<br />
in volumetric images—A graph-theoretic approach,” IEEE Trans.<br />
Pattern Anal. Machine Intell., vol. 28, no. 1, pp. 119–134, Jan. 2006.<br />
[128] M. K. Garvin, M. D. Abràmoff, X. Wu, S. R. Russell, T. L. Burns, <strong>and</strong><br />
M. Sonka, “Automated 3-D intraretinal layer segmentation of macular<br />
spectral-domain optical coherence tomography images,” IEEE Trans.<br />
Med. <strong>Imaging</strong>, vol. 28, no. 9, pp. 1436–1447, Sep. 2009.<br />
[129] K. Lee, M. K. Garvin, S. Russell, M. Sonka, <strong>and</strong> M. D. Abràmoff,<br />
“Automated intraretinal layer segmentation of 3-D macular OCT scans<br />
using a multiscale graph search,” Invest. Ophthalmol. Vis. Sci., May<br />
2010, pp. E-abstract 1767.<br />
[130] B. J. Antony, M. D. Abràmoff, K. Lee, P. Sonkova, P. Gupta, M.<br />
Niemeijer, Z. Hu, <strong>and</strong> M. K. Garvin, “Automated 3D segmentation of<br />
intraretinal layers from optic nerve head optical coherence tomography<br />
images,” in Proc. SPIE Medical <strong>Imaging</strong> 2010: Biomedical Applications<br />
Molecular, Structural, Functional <strong>Imaging</strong>, R. C. Molthen <strong>and</strong> J.<br />
B. Weaver, Eds., 2010, vol. 7626, p. 76260U, SPIE.<br />
[131] M. K. Garvin, M. Sonka, R. H. Kardon, X. Wu, Y. H. Kwon, S. R.<br />
Russell, <strong>and</strong> M. D. Abramoff, “Three-dimensional analysis of SD OCT:<br />
Thickness assessment of six macular layers in normal subjects,” Invest.<br />
Ophthalmol. Vis. Sci., 2008, pp. E-Abstract 1879.<br />
[132] H. W. van Dijk, P. H. B. Kok, M. Garvin, M. Sonka, J. H. DeVries,<br />
R. P. J. Michels, M. E. J. van Velthoven, R. O. Schlingemann, F. D.<br />
Verbraak, <strong>and</strong> M. D. Abràmoff, “Selective loss of inner retinal layer<br />
thickness in type 1 diabetic patients with minimal diabetic retinopathy,”<br />
Invest. Ophthalmol. Vis. Sci., vol. 50, no. 7, pp. 3404–3409, Jul. 2009.<br />
[133] H. W. van Dijk, F. D. Verbraak, P. H. B. Kok, M. K. Garvin, M. Sonka,<br />
K. Lee, J. H. DeVries, R. P. J. Michels, M. E. J. van Velthoven, R. O.<br />
Schlingemann, <strong>and</strong> M. D. Abràmoff, “Decreased retinal ganglion cell<br />
layer thickness in type 1 diabetic patients,” Invest. Ophthalmol. Vis.<br />
Sci., 2010.<br />
[134] A. Fuller, R. Zawadzki, S. Choi, D. Wiley, J. Werner, <strong>and</strong> B.<br />
Hamann, “Segmentation of three-dimensional retinal image data,”<br />
IEEE Trans. <strong>Visual</strong> Comput. Graphics, vol. 13, no. 10, pp.<br />
1719–1726, Oct. 2007.<br />
[135] A. Yazdanpanah, G. Hamarneh, B. Smith, <strong>and</strong> M. Sarunic,<br />
“Intra-retinal layer segmentation in optical coherence tomography<br />
using an active contour approach,” in Medical <strong>Image</strong> Computing<br />
Computer-Assisted Intervention MICCAI 2009, Part II, LNCS,<br />
Guang-ZhongYang, D. Hawkes, D. Rueckert, A. Noble, <strong>and</strong> C. Taylor,<br />
Eds. New York: Springer-Verlag, 2009, vol. 5762, pp. 649–656.<br />
[136] A. Mishra, P. Fieguth, <strong>and</strong> D. Clausi, “Accurate boundary localization<br />
using dynamic programming on snake,” in Proc. Canadian Conf. Computer<br />
Robot Vision, 2008, pp. 261–268.<br />
[137] A. Mishra, A. Wong, K. Bizheva, <strong>and</strong> D. A. Clausi, “Intra-retinal layer<br />
segmentation in optical coherence tomography images,” Opt. Expr.,<br />
vol. 17, no. 26, pp. 23 719–23 728, 2009.<br />
[138] R. J. Zawadzki, A. R. Fuller, S. S. Choi, D. F. Wiley, B. Hamann, <strong>and</strong><br />
J. S. Werner, “Correction of motion artifacts <strong>and</strong> scanning beam distortions<br />
in 3D ophthalmic optical coherence tomography imaging,” in<br />
Proc. Ophthalmic Technologies XVII, 2007, vol. 6426, p. 642607.<br />
[139] S. Ricco, M. Chen, H. Ishikawa, G. Wollstein, <strong>and</strong> J. Schuman, “Correcting<br />
motion artifacts in retinal spectral domain optical coherence tomography<br />
via image registration,” in Proc. MICCAI, ser. Lecture Notes<br />
in Computer Science, G.-Z. Yang, D. J. Hawkes, D. Rueckert, J. A.<br />
Noble, <strong>and</strong> C. J. T. 0002, Eds. New York: Springer, 2009, vol. 5761,<br />
pp. 100–107.<br />
[140] G. Donato <strong>and</strong> S. Belongie, “Approximate thin plate spline mappings,”<br />
in Proc. 7th Eur. Conf. Computer Vision (ECCV 2002), Part III, LNCS<br />
2352, A. Heyden, G. Sparr, M. Nielsen, <strong>and</strong> P. Johansen, Eds., 2002,<br />
pp. 21–31.<br />
[141] B. J. Antony, L. Tang, M. Abràmoff, K. Lee, M. Sonka, <strong>and</strong> M. K.<br />
Garvin, “Automated method for the flattening of optical coherence tomography<br />
images,” Invest. Ophthalmol. Vis. Sci., May 2010, pp. E-abstract<br />
1781.<br />
[142] G. J. Jaffe <strong>and</strong> J. Caprioli, “Optical coherence tomography to detect<br />
<strong>and</strong> manage retinal disease <strong>and</strong> glaucoma,” Amer. J. Ophthalmol., vol.<br />
137, no. 1, pp. 156–169, 2004.<br />
[143] P. Massin, A. Girach, A. Erginay, <strong>and</strong> A. Gaudric, “Optical coherence<br />
tomography: A key to the future management of patients with diabetic<br />
macular oedema,” Acta Ophthalmol. Sc<strong>and</strong>., vol. 84, no. 4, pp.<br />
466–474, Aug. 2006.<br />
[144] R. M. Haralick, “Statistical <strong>and</strong> structural approaches to texture,” Proc.<br />
IEEE, vol. 67, no. 5, pp. 786–804, May 1979.<br />
[145] S. R. Fleagle, W. Stanford, T. Burns, <strong>and</strong> D. J. Skorton, “Feasibility of<br />
quantitative texture analysis of cardiac magnetic resonance imagery:<br />
Preliminary results,” in Proc. SPIE Medical <strong>Imaging</strong>, 1994, vol. 2168,<br />
pp. 23–32.<br />
[146] G. Quellec, M. Lamard, G. Cazuguel, B. Cochener, <strong>and</strong> C. Roux,<br />
“Adaptive non-separable wavelet transform via lifting <strong>and</strong> its application<br />
to content-based image retrieval,” IEEE Trans. <strong>Image</strong> Process.,<br />
vol. 19, no. 1, pp. 25–35, Jan. 2010.<br />
[147] Y. Xu, M. Sonka, G. McLennan, J. Guo, <strong>and</strong> E. A. Hoffman, “MDCT-<br />
Based 3-D texture classification of emphysema <strong>and</strong> early smoking related<br />
lung pathologies,” IEEE Trans. Med. <strong>Imaging</strong>, vol. 25, no. 4, pp.<br />
464–475, Apr. 2006.<br />
[148] G. Quellec, K. Lee, M. Dolejsi, M. K. Garvin, M. D. Abràmoff, <strong>and</strong><br />
M. Sonka, “Three-dimensional analysis of retinal layer texture: Identification<br />
of fluid-filled regions in SD-OCT of the macula,” IEEE Trans.<br />
Med. <strong>Imaging</strong>, vol. 29, no. 6, pp. 1321–1330, Jun. 2010.<br />
[149] D. C. Adler, T. H. Ko, <strong>and</strong> J. G. Fujimoto, “Speckle reduction in optical<br />
coherence tomography images by use of a spatially adaptive wavelet<br />
filter,” Opt. Lett., vol. 29, no. 24, pp. 2878–2880, 2004.<br />
[150] P. Puvanathasan <strong>and</strong> K. Bizheva, “Speckle noise reduction algorithm<br />
for optical coherence tomography based on interval type II fuzzy set,”<br />
Opt. Expr., vol. 15, no. 24, pp. 15 747–15 758, 2007.<br />
[151] S. Chitchian, M. A. Fiddy, <strong>and</strong> N. M. Fried, “Denoising during optical<br />
coherence tomography of the prostate nerves via wavelet shrinkage<br />
using dual-tree complex wavelet transform,” J. Biomed. Opt., vol. 14,<br />
no. 1, p. 014031, 2009.<br />
[152] C. A. Lingley-Papadopoulos, M. H. Loew, <strong>and</strong> J. M. Zara, “Wavelet<br />
analysis enables system-independent texture analysis of optical coherence<br />
tomography images,” J. Biomed. Opt., vol. 14, no. 4, 2009.
ABRÀMOFF et al.: RETINAL IMAGING AND IMAGE ANALYSIS 207<br />
[153] J. Kovacevic <strong>and</strong> W. Sweldens, “Wavelet families of increasing order<br />
in arbitrary dimensions,” IEEE Trans. <strong>Image</strong> Proc., vol. 9, no. 3, pp.<br />
480–496, Mar. 2000.<br />
[154] M. Niemeijer, M. K. Garvin, B. van Ginneken, M. Sonka, <strong>and</strong> M.<br />
D. Abràmoff, “Vessel segmentation in 3D spectral OCT scans of the<br />
retina,” in Proc. SPIE Medical <strong>Imaging</strong> 2008: <strong>Image</strong> Processing, 2008,<br />
vol. 6914, p. 69141R.<br />
[155] M. Niemeijer, M. Sonka, M. K. Garvin, B. van Ginneken, <strong>and</strong> M. D.<br />
Abràmoff, “Automated segmentation of the retinal vasculature in 3D<br />
optical coherence tomography images,” Invest. Ophthalmol. Vis. Sci.,<br />
2008, pp. E-Abstract 1832.<br />
[156] J. Xu, D. A. Tolliver, H. Ishikawa, G. Wollstein, <strong>and</strong> J. S. Schuman,<br />
“3D OCT retinal vessel segmentation based on boosting learning,” in<br />
Proc. World Congr. Medical Physics Biomedical Engineering, IFMBE,<br />
O. Dössel <strong>and</strong> W. C. Schlegel, Eds., Munich, Germany, Sep. 2009, vol.<br />
25/XI, pp. 179–182.<br />
[157] Z. Hu, M. Niemeijer, M. D. Abràmoff, K. Lee, <strong>and</strong> M. K. Garvin,<br />
“Automated segmentation of 3-D spectral OCT retinal blood vessels<br />
by neural canal opening false positive suppression,” in Proc. Medical<br />
<strong>Image</strong> Computing Computer-Assisted Intervention MICCAI 2010,<br />
LNCS, 2010, accepted for publication.<br />
[158] K. Lee, M. D. Abràmoff, M. Niemeijer, M. K. Garvin, <strong>and</strong> M. Sonka,<br />
“3D segmentation of retinal blood vessels in spectral-domain OCT volumes<br />
of the optic nerve head,” in Proc. SPIE Medical <strong>Imaging</strong> 2010:<br />
Biomedical Applications Molecular, Structural, Functional <strong>Imaging</strong>,<br />
Feb. 2010, vol. 7626, p. 76260V.<br />
[159] R. O. Duda <strong>and</strong> P. E. Hart, Pattern Classification <strong>and</strong> Scene <strong>Analysis</strong>.<br />
New York: Wiley, 1973.<br />
[160] P. Pudil, J. Novovičová, <strong>and</strong> J. Kittler, “Floating search methods in feature<br />
selection with nonmonotinic criterion functions,” Pattern Recog.<br />
Lett., vol. 15, no. 11, pp. 1119–1125, Nov. 1994.<br />
[161] R. O. Duda, P. E. Hart, <strong>and</strong> D. G. Stork, Pattern Classification, 2nd<br />
ed. New York: Wiley, 2000.<br />
[162] Y. Y. Boykov <strong>and</strong> M.-P. Jolly, “Interactive graph cuts for optimal<br />
boundary <strong>and</strong> region segmentation of objects in N-D images,” in Proc.<br />
Eighth IEEE Int. Conf. Computer Vision (ICCV), 2001, vol. 1, pp.<br />
105–112.<br />
[163] Y. Boykov <strong>and</strong> V. Kolmogorov, “An experimental comparison of<br />
min-cut/max-flow algorithms for energy minimization in vision,” IEEE<br />
Trans. Pattern Anal. Machine Intell., vol. 26, no. 9, pp. 1124–1137,<br />
Sep. 2004.<br />
[164] K. Lee, M. Niemeijer, M. K. Garvin, Y. H. Kwon, M. Sonka, <strong>and</strong> M.<br />
D. Abràmoff, “3-D segmentation of the rim <strong>and</strong> cup in spectral-domain<br />
optical coherence tomography volumes of the optic nerve head,”<br />
in Proc. SPIE Medical <strong>Imaging</strong> 2009: Biomedical Applications Molecular,<br />
Structural, Functional <strong>Imaging</strong>, 2009, pp. 7262–7283.<br />
[165] K. Lee, M. Niemeijer, M. K. Garvin, Y. H. Kwon, M. Sonka, <strong>and</strong> M.<br />
D. Abràmoff, “Segmentation of the optic disc in 3D-OCT scans of<br />
the optic nerve head,” IEEE Trans. Med. <strong>Imaging</strong>, vol. 29, no. 1, pp.<br />
159–168, Jan. 2010.<br />
[166] M. D. Abràmoff, K. Lee, M. Niemeijer, W.L.M. Alward, E. C.<br />
Greenlee, M. K. Garvin, M. Sonka, <strong>and</strong> Y. H. Kwon, “Automated<br />
segmentation of the cup <strong>and</strong> rim from spectral domain OCT of the<br />
optic nerve head,” Invest. Ophthalmol. Vis. Sci., vol. 50, no. 12, pp.<br />
5778–5784, Dec. 2009.<br />
[167] Z. Hu, M. Niemeijer, K. Lee, M. D. Abràmoff, M. Sonka, <strong>and</strong> M.<br />
K. Garvin, “Automated segmentation of the optic disc margin in<br />
3-D optical coherence tomography images using a graph-theoretic<br />
approach,” in Proc. SPIE Medical <strong>Imaging</strong> 2009: Biomedical Applications<br />
Molecular, Structural, Functional <strong>Imaging</strong>, 2009, vol. 7262,<br />
p. 72620U.<br />
[168] Z. Hu, M. Niemeijer, K. Lee, M. D. Abràmoff, M. Sonka, <strong>and</strong> M. K.<br />
Garvin, “Automated segmentation of the optic canal in 3D spectral-domain<br />
OCT of the optic nerve head (ONH) using retinal vessel suppression,”<br />
Invest. Ophthalmol. Vis. Sci., 2009, pp. E-abstract 3344.<br />
[169] Y. H. Kwon, Z. Hu, M. D. Abràmoff, K. Lee, <strong>and</strong> M. K. Garvin,<br />
“Automated segmentation of neural canal opening <strong>and</strong> optic cup in<br />
SD-OCT images,” in Proc. Amer. Glaucoma Soc. 20th Annu. Meeting,<br />
Mar. 2010.<br />
[170] Z. Hu, M. D. Abràmoff, Y. H. Kwon, K. Lee, <strong>and</strong> M. K. Garvin, “Automated<br />
segmentation of neural canal opening <strong>and</strong> optic cup in 3-D<br />
spectral optical coherence tomography images of the optic nerve head,”<br />
Invest. Ophthalmol. Vis. Sci., 2010, accepted for publication.<br />
[171] S. Arya, D. M. Mount, N. S. Netanyahu, R. Silverman, <strong>and</strong> A. Y.<br />
Wu, “An optimal algorithm for approximate nearest neighbor searching<br />
fixed dimensions,” J. ACM, vol. 45, pp. 891–923, 1998.<br />
[172] N. Strouthidis, H. Yang, B. Fortune, J. Downs, <strong>and</strong> C. Burgoyne, “Detection<br />
of the optic nerve head neural canal opening within three-dimensional<br />
histomorphometric <strong>and</strong> spectral domain optical coherence<br />
tomography data sets,” Invest. Ophthalmol. Vis. Sci., vol. 50, no. 5, pp.<br />
214–223, 2009.<br />
[173] N. G. Strouthidis, H. Yang, J. F. Reynaud, J. L. Grimm, S. K. Gardiner,<br />
B. Fortune, <strong>and</strong> C. F. Burgoyne, “Comparison of clinical <strong>and</strong> spectral<br />
domain optical coherence tomography optic disc margin anatomy,” Invest.<br />
Ophthalmol. Vis. Sci., vol. 50, no. 10, pp. 4709–4718, 2009.<br />
[174] R. Magjarevic, G. Troglio, A. Nappo, J. A. Benediktsson, G. Moser, S.<br />
B. Serpico, <strong>and</strong> E. Stefansson, Automatic change detection of retinal<br />
images vol. 25/11, pp. 281–284, 2009 [Online]. Available: http://dx.<br />
doi.org/10.1007/978-3-642-03891-4_75<br />
[175] X. You, B. Fang, Z. He, <strong>and</strong> Y. Tang, “A global-to-local matching<br />
strategy for registering retinal fundus images,” Lecture Notes Computer<br />
Science, vol. 3522, pp. 259–267, 2005.<br />
[176] A. Can, C. V. Stewart, B. Roysam, <strong>and</strong> H. L. Tanenbaum, “A featurebased<br />
robust, hierarchical algorithm for registering pairs of images of<br />
the curved human retina,” IEEE Trans. Pattern Anal. Machine Intell.,<br />
vol. 24, no. 3, pp. 347–364, Mar. 2002.<br />
[177] C. Stewart, C. Tasi, <strong>and</strong> B. Roysam, “The dual-bootstrap iterative<br />
closest point algorithm with application to retinal image registration,”<br />
IEEE Trans. Med. <strong>Imaging</strong>, vol. 22, no. 11, pp. 1379–1394, Nov. 2003.<br />
[178] P. C. Cattin, H. Bay, L. V. Gool, <strong>and</strong> G. Szekely, “Retina mosaicing<br />
using local features,” in Medical <strong>Image</strong> Computing Computer-Assisted<br />
Intervention (MICCAI), Copenhagen, Denmark, Oct. 2006, pp.<br />
185–192.<br />
[179] S. Lee, M. D. Abramoff, <strong>and</strong> J. M. Reinhardt, “Feature-based pairwise<br />
retinal image registration by radial distortion correction,” in Proc. SPIE<br />
Conf. Medical <strong>Imaging</strong>, J. P. Pluim <strong>and</strong> J. M. Reinhardt, Eds., San<br />
Diego, CA, 2007, vol. 6512 [Online]. Available: http://dx.doi.org/10.<br />
1117/12.710676<br />
[180] M.J.D. Powell, “An efficient method for finding the minimum of a<br />
function of several variables without calculating derivatives,” The<br />
Comput. J., vol. 7, pp. 155–162, 1964.<br />
[181] S. Lee, M. D. Abramoff, <strong>and</strong> J. M. Reinhardt, “<strong>Retinal</strong> atlas statistics<br />
from color fundus images,” in Proc. SPIE Conf. Medical <strong>Imaging</strong>, B.<br />
M. Dawant <strong>and</strong> D. R. Haynor, Eds., 2010, vol. 7623, p. 762310.<br />
[182] J. Chen, J. Tian, N. Lee, J. Zheng, R. T. Smith, <strong>and</strong> A. F. Laine, “A partial<br />
intensity invariant feature descriptor for multimodal retinal image<br />
registration,” IEEE Trans. Biomed. Eng., vol. 57, no. 7, pp. 1707–1718,<br />
Jul. 2010.<br />
[183] J. S. Kim, H. Ishikawa, M. L. Gabriele, G. Wollstein, R. A. Bilonick,<br />
L. Kagemann, J. G. Fujimoto, <strong>and</strong> J. S. Schuman, “<strong>Retinal</strong> nerve fiber<br />
layer thickness measurement comparability between time domain optical<br />
coherence tomography (OCT) <strong>and</strong> spectral domain OCT,” Invest.<br />
Ophthalmol. Vis. Sci., vol. 51, pp. 896–902, 2010.<br />
[184] M. Niemeijer, M. Garvin, K. Lee, B. van Ginneken, M. Abramoff, <strong>and</strong><br />
M. Sonka, “Registration of 3D spectral OCT volumes using 3D SIFT<br />
feature point matching,” in SPIE Medical <strong>Imaging</strong>, 2009, vol. 7259, p.<br />
72591I.<br />
[185] W. Cheung <strong>and</strong> G. Hamarneh, “N-SIFT: N-dimensional scale invariant<br />
feature transform for matching medical images,” in Proc. 4th IEEE Int.<br />
Symp. Biomedical <strong>Imaging</strong>: From Nano to Macro, 2007. ISBI , 2007,<br />
pp. 720–723.<br />
[186] D. G. Lowe, “Distinctive image features from scale-invariant keypoints,”<br />
Int. J. Comput. Vis., vol. 60, no. 2, pp. 91–110, 2004.<br />
[187] W. A. Cheung <strong>and</strong> G. Hamarneh, “Scale invariant feature transform for<br />
n-dimensional images (n-SIFT),” Insight J. 2007 [Online]. Available:<br />
http://hdl.h<strong>and</strong>le.net/1926/1321<br />
Michael D. Abràmoff (M’03-SM’09) received the<br />
M.D. degree from the University of Amsterdam in<br />
1994 <strong>and</strong> Ph.D. degree in 2001 from the University<br />
of Utrecht, The Netherl<strong>and</strong>s.<br />
He is an Associate Professor of <strong>Ophthalmology</strong><br />
<strong>and</strong> <strong>Visual</strong> Sciences at the University of Iowa,<br />
Iowa City, with joint appointments in Electrical <strong>and</strong><br />
Computer Engineering <strong>and</strong> Biomedical Engineering.<br />
He is Associate Director of the U.S. Department<br />
of Veterans’ Affairs Center of Excellence for the<br />
Prevention <strong>and</strong> Treatment of <strong>Visual</strong> Loss. He serves<br />
on the American Academy of <strong>Ophthalmology</strong> <strong>and</strong> the Iowa Medical Society.<br />
When he is not seeing patients with retinal disease or teaching medical students,
208 IEEE REVIEWS IN BIOMEDICAL ENGINEERING, VOL. 3, 2010<br />
residents <strong>and</strong> fellows, he oversees a highly successful retinal image analysis<br />
research program. His focus is on automated early detection of retinal diseases,<br />
image guided therapy of retinal disease, <strong>and</strong> computational phenotype-genotype<br />
association discovery. He holds seven patents <strong>and</strong> patent applications in<br />
this field.<br />
Dr. Abràmoff is Associate Editor of IEEE TRANSACTIONS ON MEDICAL<br />
IMAGING.<br />
Mona K. Garvin (M’09) received the B.S.E. degree<br />
in biomedical engineering in 2003, the B.S. degree<br />
in computer science in 2003, the M.S. degree in<br />
biomedical engineering in 2004, <strong>and</strong> the Ph.D.<br />
degree in biomedical engineering in 2008, all from<br />
the University of Iowa, Iowa City.<br />
She is an Assistant Professor in the Department of<br />
Electrical <strong>and</strong> Computer Engineering, University of<br />
Iowa, Iowa City. She is also affiliated with the Iowa<br />
Institute for Biomedical <strong>Imaging</strong> <strong>and</strong> the Veterans’<br />
Affairs Center of Excellence for the Prevention <strong>and</strong><br />
Treatment of <strong>Visual</strong> Loss. Her research interests include medical image analysis<br />
<strong>and</strong> ophthalmic imaging.<br />
Milan Sonka (F’03) received the Ph.D. degree from<br />
the Czech Technical University in Prague, Czech Republic,<br />
in 1983.<br />
He is Professor <strong>and</strong> Chair of the Department of<br />
Electrical <strong>and</strong> Computer Engineering, Professor of<br />
<strong>Ophthalmology</strong> <strong>and</strong> <strong>Visual</strong> Sciences, <strong>and</strong> Radiation<br />
Oncology at the University of Iowa, Iowa City, <strong>and</strong><br />
Co-director of the Iowa Institute for Biomedical<br />
<strong>Imaging</strong>. His research interests include medical<br />
imaging <strong>and</strong> knowledge-based image analysis with<br />
emphasis on cardiovascular, pulmonary, orthopedic,<br />
<strong>and</strong> ophthalmic image analysis. He is the first author of three editions of <strong>Image</strong><br />
Processing, <strong>Analysis</strong> <strong>and</strong> Machine Vision (1993, 1998, 2008) <strong>and</strong> co-authored<br />
or co-edited 18 books/proceedings. He has published more than 90 journal<br />
papers <strong>and</strong> over 340 other publications.<br />
Dr. Sonka is an AIMBE Fellow. He is Editor in Chief of the IEEE<br />
TRANSACTIONS ON MEDICAL IMAGING <strong>and</strong> member of the Editorial Board of<br />
the Medical <strong>Image</strong> <strong>Analysis</strong> Journal.