Population of West Sussex Issue 2 - West Sussex County Council
Population of West Sussex Issue 2 - West Sussex County Council
Population of West Sussex Issue 2 - West Sussex County Council

Create successful ePaper yourself
Turn your PDF publications into a flip-book with our unique Google optimized e-Paper software.
<strong>Population</strong> <strong>of</strong> <strong>West</strong> <strong>Sussex</strong> <strong>Issue</strong> 2<br />
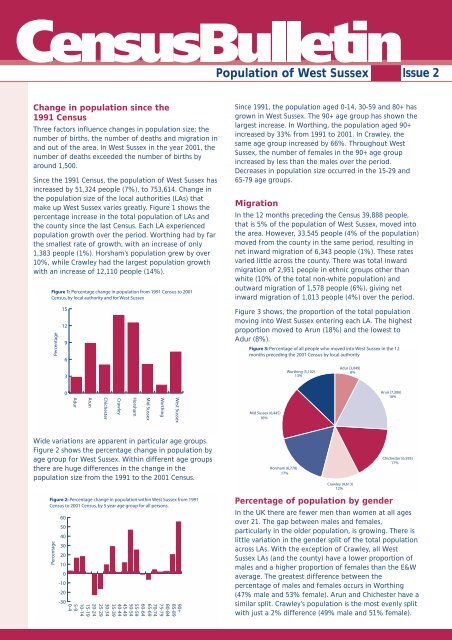
Change in population since the<br />
1991 Census<br />
Three factors influence changes in population size; the<br />
number <strong>of</strong> births, the number <strong>of</strong> deaths and migration in<br />
and out <strong>of</strong> the area. In <strong>West</strong> <strong>Sussex</strong> in the year 2001, the<br />
number <strong>of</strong> deaths exceeded the number <strong>of</strong> births by<br />
around 1,500.<br />
Since the 1991 Census, the population <strong>of</strong> <strong>West</strong> <strong>Sussex</strong> has<br />
increased by 51,324 people (7%), to 753,614. Change in<br />
the population size <strong>of</strong> the local authorities (LAs) that<br />
make up <strong>West</strong> <strong>Sussex</strong> varies greatly. Figure 1 shows the<br />
percentage increase in the total population <strong>of</strong> LAs and<br />
the county since the last Census. Each LA experienced<br />
population growth over the period. Worthing had by far<br />
the smallest rate <strong>of</strong> growth, with an increase <strong>of</strong> only<br />
1,383 people (1%). Horsham’s population grew by over<br />
10%, while Crawley had the largest population growth<br />
with an increase <strong>of</strong> 12,110 people (14%).<br />
Since 1991, the population aged 0-14, 30-59 and 80+ has<br />
grown in <strong>West</strong> <strong>Sussex</strong>. The 90+ age group has shown the<br />
largest increase. In Worthing, the population aged 90+<br />
increased by 33% from 1991 to 2001. In Crawley, the<br />
same age group increased by 66%. Throughout <strong>West</strong><br />
<strong>Sussex</strong>, the number <strong>of</strong> females in the 90+ age group<br />
increased by less than the males over the period.<br />
Decreases in population size occurred in the 15-29 and<br />
65-79 age groups.<br />
Migration<br />
In the 12 months preceding the Census 39,888 people,<br />
that is 5% <strong>of</strong> the population <strong>of</strong> <strong>West</strong> <strong>Sussex</strong>, moved into<br />
the area. However, 33,545 people (4% <strong>of</strong> the population)<br />
moved from the county in the same period, resulting in<br />
net inward migration <strong>of</strong> 6,343 people (1%). These rates<br />
varied little across the county. There was total inward<br />
migration <strong>of</strong> 2,951 people in ethnic groups other than<br />
white (10% <strong>of</strong> the total non-white population) and<br />
outward migration <strong>of</strong> 1,578 people (6%), giving net<br />
inward migration <strong>of</strong> 1,013 people (4%) over the period.<br />
Figure 3 shows, the proportion <strong>of</strong> the total population<br />
moving into <strong>West</strong> <strong>Sussex</strong> entering each LA. The highest<br />
proportion moved to Arun (18%) and the lowest to<br />
Adur (8%).<br />
Wide variations are apparent in particular age groups.<br />
Figure 2 shows the percentage change in population by<br />
age group for <strong>West</strong> <strong>Sussex</strong>. Within different age groups<br />
there are huge differences in the change in the<br />
population size from the 1991 to the 2001 Census.<br />
Percentage <strong>of</strong> population by gender<br />
In the UK there are fewer men than women at all ages<br />
over 21. The gap between males and females,<br />
particularly in the older population, is growing. There is<br />
little variation in the gender split <strong>of</strong> the total population<br />
across LAs. With the exception <strong>of</strong> Crawley, all <strong>West</strong><br />
<strong>Sussex</strong> LAs (and the county) have a lower proportion <strong>of</strong><br />
males and a higher proportion <strong>of</strong> females than the E&W<br />
average. The greatest difference between the<br />
percentage <strong>of</strong> males and females occurs in Worthing<br />
(47% male and 53% female). Arun and Chichester have a<br />
similar split. Crawley’s population is the most evenly split<br />
with just a 2% difference (49% male and 51% female).
Age structure<br />
The age structure <strong>of</strong> <strong>West</strong> <strong>Sussex</strong> LAs is shown in Figure<br />
4, along with the comparable age structures <strong>of</strong> <strong>West</strong><br />
<strong>Sussex</strong> and E&W. In E&W, 20% <strong>of</strong> the population is aged<br />
less than 16 years. The <strong>West</strong> <strong>Sussex</strong> proportion is slightly<br />
lower at 19%. All LAs in <strong>West</strong> <strong>Sussex</strong>, with the exception<br />
<strong>of</strong> Crawley and Horsham (both with 21%), had lower<br />
proportions than both <strong>West</strong> <strong>Sussex</strong> and E&W. The lowest<br />
proportions <strong>of</strong> this age group are found in Arun,<br />
Chichester and Worthing, all with around 17%-18%.<br />
<strong>West</strong> <strong>Sussex</strong> with lower densities than the county are<br />
Horsham and Chichester, with just 2.3 and 1.4 people per<br />
hectare respectively (See Figure 5).<br />
England Top Tens<br />
Table 1: England Top Tens<br />
In E&W, 16% <strong>of</strong> people are aged 65 and over. Within<br />
<strong>West</strong> <strong>Sussex</strong> the equivalent figure is 20%. Adur (22%),<br />
Arun (26%), Chichester (23%) and Worthing (23%) LAs<br />
have greater proportions <strong>of</strong> the 65s and over than both<br />
<strong>West</strong> <strong>Sussex</strong> and E&W. Crawley is the only LA with a<br />
lower proportion <strong>of</strong> 65s and over (15%) than E&W.<br />
In E&W, 64% <strong>of</strong> the population are aged 16-64 years,<br />
compared to 61% for <strong>West</strong> <strong>Sussex</strong>. In <strong>West</strong> <strong>Sussex</strong>, LA<br />
figures range from 57% in Arun to 64% in Crawley.<br />
The populations <strong>of</strong> Adur, Arun, Chichester and Worthing<br />
LAs are older than those <strong>of</strong> <strong>West</strong> <strong>Sussex</strong> and E&W.<br />
Horsham and Mid <strong>Sussex</strong> have slightly older age<br />
structures than E&W. Crawley has a younger population<br />
age structure than both <strong>West</strong> <strong>Sussex</strong> and E&W.<br />
<strong>Population</strong> density<br />
As a county, <strong>West</strong> <strong>Sussex</strong> (3.8 people per hectare) has a<br />
similar population density to E&W (3.4 people per<br />
hectare). There is, however, huge variation across LAs<br />
due to the mix <strong>of</strong> rural and urban areas within <strong>West</strong><br />
<strong>Sussex</strong>. The LA figures range from just 1.4 people per<br />
hectare in Chichester to 30 people per hectare in<br />
Worthing, which has almost eight times the density <strong>of</strong><br />
<strong>West</strong> <strong>Sussex</strong>, and almost nine times that <strong>of</strong> E&W.<br />
Crawley’s density <strong>of</strong> 22.2 people per hectare is also<br />
considerably above the county and E&W average.<br />
Whilst much lower than Worthing, the population<br />
densities <strong>of</strong> Adur and Arun are still considerably greater<br />
than <strong>West</strong> <strong>Sussex</strong> and E&W. Mid <strong>Sussex</strong> has a density<br />
equal to that <strong>of</strong> <strong>West</strong> <strong>Sussex</strong>. The only two LAs within<br />
Indicator LA Rank Value<br />
Highest proportion <strong>of</strong><br />
people aged 85+<br />
Highest proportion <strong>of</strong><br />
people <strong>of</strong> retirement age<br />
Highest proportion <strong>of</strong> females to<br />
males (sex ratio m/f)<br />
Worthing 1 4.6%<br />
Arun 4 4.2%<br />
Arun 6 29.0%<br />
Worthing 3 0.88<br />
Arun 4 0.89<br />
Chichester 9 0.90<br />
Table 1 summarises those LAs in <strong>West</strong> <strong>Sussex</strong> that lie in<br />
the top ten LAs across England for various population<br />
related variables. Further details can be found at:<br />
http:/www.statistics.gov.uk/census2001/top_ten_uk.asp<br />
Future bulletins<br />
Further Census bulletins will now be produced regularly<br />
by the <strong>West</strong> <strong>Sussex</strong> Census Joint Working Group.<br />
Planned topics for future bulletins include:<br />
• Health<br />
• Household Structure<br />
• Religion and ethnicity<br />
• Employment<br />
• Families<br />
• Education<br />
• Pensioners and older people<br />
• Migration<br />
• Journey to work<br />
<strong>West</strong> <strong>Sussex</strong> Census Joint Working Group. <strong>West</strong> <strong>Sussex</strong> <strong>County</strong> <strong>Council</strong> and<br />
the Public Health Observatory based at Adur, Arun and Worthing tPCT<br />
Compiled by: Kate Canning, Public Health Observatory,<br />
Adur, Arun and Worthing tPCT<br />
Crown Copyright material reproduced with the permission <strong>of</strong> the Controller <strong>of</strong> HMSO<br />
and the Queen’s Printer for Scotland<br />
www.healthinaaw.nhs.uk<br />
www.westsussex.gov.uk