ciprofloxacin, levofloxacin, moxifloxacin and garenoxacin
ciprofloxacin, levofloxacin, moxifloxacin and garenoxacin
ciprofloxacin, levofloxacin, moxifloxacin and garenoxacin

You also want an ePaper? Increase the reach of your titles
YUMPU automatically turns print PDFs into web optimized ePapers that Google loves.
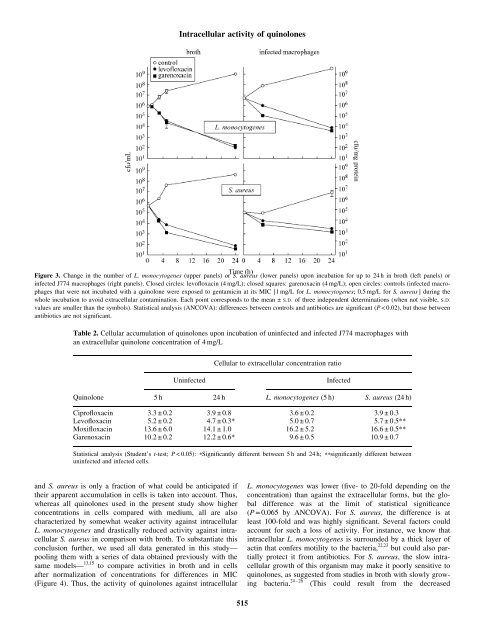
Intracellular activity of quinolones<br />
Figure 3. Change in the number of L. monocytogenes (upper panels) or S. aureus (lower panels) upon incubation for up to 24 h in broth (left panels) or<br />
infected J774 macrophages (right panels). Closed circles: <strong>levofloxacin</strong> (4 mg/L); closed squares: <strong>garenoxacin</strong> (4 mg/L); open circles: controls (infected macrophages<br />
that were not incubated with a quinolone were exposed to gentamicin at its MIC [1 mg/L for L. monocytogenes; 0.5 mg/L for S. aureus ] during the<br />
whole incubation to avoid extracellular contamination. Each point corresponds to the mean ± S.D. of three independent determinations (when not visible, S.D.<br />
values are smaller than the symbols). Statistical analysis (ANCOVA): differences between controls <strong>and</strong> antibiotics are significant (P < 0.02), but those between<br />
antibiotics are not significant.<br />
Table 2. Cellular accumulation of quinolones upon incubation of uninfected <strong>and</strong> infected J774 macrophages with<br />
an extracellular quinolone concentration of 4 mg/L<br />
Cellular to extracellular concentration ratio<br />
Uninfected<br />
Infected<br />
Quinolone 5 h 24 h L. monocytogenes (5 h) S. aureus (24 h)<br />
Ciprofloxacin 3.3 ± 0.2 3.9 ± 0.8 3.6 ± 0.2 3.9 ± 0.3<br />
Levofloxacin 5.2 ± 0.2 4.7 ± 0.3* 5.0 ± 0.7 5.7 ± 0.5**<br />
Moxifloxacin 13.6 ± 6.0 14.1 ± 1.0 16.2 ± 5.2 16.6 ± 0.5**<br />
Garenoxacin 10.2 ± 0.2 12.2 ± 0.6* 9.6 ± 0.5 10.9 ± 0.7<br />
Statistical analysis (Student’s t-test; P < 0.05): *Significantly different between 5 h <strong>and</strong> 24 h; **significantly different between<br />
uninfected <strong>and</strong> infected cells.<br />
<strong>and</strong> S. aureus is only a fraction of what could be anticipated if<br />
their apparent accumulation in cells is taken into account. Thus,<br />
whereas all quinolones used in the present study show higher<br />
concentrations in cells compared with medium, all are also<br />
characterized by somewhat weaker activity against intracellular<br />
L. monocytogenes <strong>and</strong> drastically reduced activity against intracellular<br />
S. aureus in comparison with broth. To substantiate this<br />
conclusion further, we used all data generated in this study—<br />
pooling them with a series of data obtained previously with the<br />
same models— 13,15 to compare activities in broth <strong>and</strong> in cells<br />
after normalization of concentrations for differences in MIC<br />
(Figure 4). Thus, the activity of quinolones against intracellular<br />
L. monocytogenes was lower (five- to 20-fold depending on the<br />
concentration) than against the extracellular forms, but the global<br />
difference was at the limit of statistical significance<br />
(P = 0.065 by ANCOVA). For S. aureus, the difference is at<br />
least 100-fold <strong>and</strong> was highly significant. Several factors could<br />
account for such a loss of activity. For instance, we know that<br />
intracellular L. monocytogenes is surrounded by a thick layer of<br />
actin that confers motility to the bacteria, 22,23 but could also partially<br />
protect it from antibiotics. For S. aureus, the slow intracellular<br />
growth of this organism may make it poorly sensitive to<br />
quinolones, as suggested from studies in broth with slowly growing<br />
bacteria. 24 – 26 (This could result from the decreased<br />
515