the new york state park system - Political Economy Research ...
the new york state park system - Political Economy Research ...
the new york state park system - Political Economy Research ...

Create successful ePaper yourself
Turn your PDF publications into a flip-book with our unique Google optimized e-Paper software.
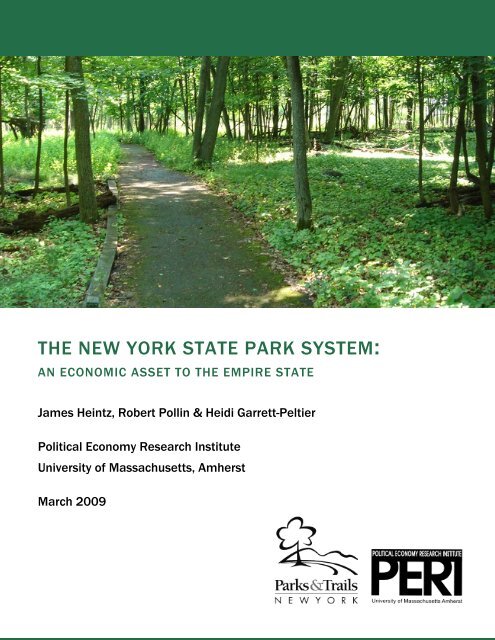
THE NEW YORK STATE PARK SYSTEM:<br />
AN ECONOMIC ASSET TO THE EMPIRE STATE<br />
James Heintz, Robert Pollin & Heidi Garrett-Peltier<br />
<strong>Political</strong> <strong>Economy</strong> <strong>Research</strong> Institute<br />
University of Massachusetts, Amherst<br />
March 2009
SUMMARY<br />
The New York State Park System makes a valuable contribution to <strong>the</strong> quality of<br />
life in New York State. This report documents ano<strong>the</strong>r contribution of <strong>the</strong> <strong>system</strong><br />
of <strong>the</strong> State Park System: its impact on <strong>the</strong> <strong>state</strong> and regional economies.<br />
The New York State Office of Parks, Recreation and Historic Preservation (OPRHP)<br />
operates and maintains 178 <strong>state</strong> <strong>park</strong>s and 35 <strong>state</strong> historic sites, covering a<br />
total of 325,000 acres. The <strong>park</strong> <strong>system</strong> represents a valuable collection of natural<br />
and recreational assets, including 1,350 miles of hiking trails, over 8,000<br />
campsites, numerous swimming pools, beaches, boat launches, nature centers<br />
and golf courses.<br />
New York State Parks generate substantial net economic benefits for <strong>the</strong> people<br />
and economy of <strong>the</strong> Empire State. On a <strong>state</strong>wide basis, direct spending by<br />
OPRHP and spending by visitors to <strong>state</strong> <strong>park</strong>s supports up to $1.9 billion in output<br />
and sales, $440 million in employment income, and 20,000 jobs. These benefits<br />
are distributed among <strong>the</strong> eleven regions that constitute <strong>the</strong> State Park<br />
System according to <strong>the</strong> number, size, and nature of <strong>the</strong> <strong>park</strong>s and historic sites in<br />
<strong>the</strong> various regions.<br />
The State Park System in 2008-2009 is supported by $341 million in <strong>state</strong> government<br />
expenditures, including $253 million in operating budget and $88 million<br />
in capital investments.<br />
Clearly, <strong>the</strong> impact of <strong>the</strong> State Park System on New York’s economy is sizeable:<br />
<strong>the</strong> benefits exceed <strong>the</strong> direct costs of maintaining <strong>the</strong> <strong>state</strong> <strong>park</strong>s many times<br />
over. The benefit-to-cost ratio is more than 5-to-1: more than $5 in benefits for<br />
every $1 in costs.<br />
This study focuses on two key channels through which <strong>the</strong> State Park System impacts<br />
New York’s economy: public spending on <strong>park</strong>s for operations and capital<br />
improvements and spending by visitors in <strong>park</strong>s and surrounding areas. In 2007-<br />
2008, <strong>the</strong> NYS Park System had 55.7 million visitors.<br />
Through <strong>the</strong>se two channels—public spending and spending by <strong>park</strong> visitors—we<br />
estimate <strong>the</strong> following economic benefits to New York’s economy.<br />
Business Sales Impacts<br />
• The <strong>state</strong> <strong>park</strong>s produce about $1.9 billion in annual sales for private businesses<br />
in <strong>the</strong> areas around <strong>the</strong> <strong>park</strong>s<br />
• About $744 million of visitor expenditure—i.e. around 40 percent of total visitor<br />
spending of $1.9 million—comes from visitors living outside <strong>the</strong> communities in<br />
which <strong>the</strong> <strong>park</strong>s are located. This non-local spending is key for generating net<br />
benefits for <strong>the</strong> <strong>park</strong>s, since local businesses would not have gained <strong>the</strong>se customers<br />
without <strong>the</strong> presence of <strong>the</strong> <strong>park</strong>s to attract visitors to <strong>the</strong> area.<br />
THE NEW YORK STATE PARK SYSTEM: AN ECONOMIC ASSET TO THE EMPIRE STATE / PAGE 1
• The $1.9 billion in economic activity generates revenues for <strong>the</strong> <strong>state</strong> through<br />
sales, business and income taxes.<br />
Job Creation and Compensation<br />
• The State Park System generates about 20,000 jobs.<br />
□ State spending produces about 6,600 jobs<br />
□ Visitor spending produces about 13,500 jobs<br />
• The total compensation to <strong>the</strong> roughly 20,000 people whose jobs are generated<br />
by <strong>the</strong> <strong>park</strong>s amounts to about $440 million per year<br />
• The average compensation from <strong>the</strong>se jobs is about $50,000 per year, including<br />
benefits<br />
ESTIMATED IMPACT OF STATE OPERATING EXPENDITURES,<br />
CAPITAL INVESTMENTS, AND VISITOR EXPENDITURES,<br />
NEW YORK STATE PARKS<br />
employment sales/output<br />
(upper bound)<br />
# jobs ($ millions)<br />
Allegany 860 $62<br />
Capital/Saratoga 2,929 $249<br />
Central 1,620 $134<br />
Finger Lakes 1,776 $141<br />
Genesee 675 $58<br />
Long Island 3,992 $410<br />
New York City 716 $61<br />
Niagara Frontier 4,701 $569<br />
Palisades 1,052 $94<br />
Taconic 957 $102<br />
Thousand Islands 882 $63<br />
<strong>state</strong> 20,159 $1,942<br />
source: see appendix<br />
Additional Economic Benefits<br />
The State Park System generates significant additional economic benefits to <strong>the</strong><br />
<strong>state</strong>, including maintaining <strong>the</strong> natural environment, providing an escape for millions<br />
of New Yorkers and o<strong>the</strong>rs from around <strong>the</strong> world, and protecting <strong>the</strong> <strong>state</strong>’s<br />
heritage for future generations. Because of <strong>the</strong>se additional benefits, our assessments<br />
of <strong>the</strong> economic impact of <strong>the</strong> State Park System underestimate <strong>the</strong> <strong>park</strong>s’<br />
true economic contribution.<br />
Additional economic benefits include:<br />
• Maintaining <strong>the</strong> <strong>state</strong>’s eco<strong>system</strong> and biodiversity<br />
• Providing opportunities for recreation<br />
• Reducing <strong>the</strong> negative effects from pollution<br />
THE NEW YORK STATE PARK SYSTEM: AN ECONOMIC ASSET TO THE EMPIRE STATE / PAGE 2
• Improving health outcomes<br />
• Preserving areas of historic importance<br />
• Influence business location decisions by contributing to a better quality of life<br />
for employees<br />
This report challenges <strong>the</strong> presumption that <strong>the</strong>re are stark trade-offs between<br />
generating jobs and protecting <strong>the</strong> environment. We specifically estimate <strong>the</strong> size<br />
of <strong>the</strong> economic contributions of <strong>the</strong> <strong>park</strong> <strong>system</strong> to <strong>the</strong> economies of each of <strong>the</strong><br />
eleven regions and to <strong>the</strong> New York State economy as a whole. We show that <strong>the</strong><br />
<strong>state</strong> spending of $341 million to maintain <strong>the</strong> State Park System generates economic<br />
benefits to <strong>the</strong> regional and <strong>state</strong> economies that dramatically exceed this<br />
investment. The direct <strong>state</strong> spending increases employment, supports local businesses,<br />
and generates numerous ripple effects throughout <strong>the</strong> regional economies.<br />
State Parks also attract visitors from outside <strong>the</strong> local community. These<br />
visitors spend money on food, shopping, transportation, recreation, and lodging,<br />
all of which contribute significantly to New York’s local and <strong>state</strong> economies.<br />
In addition, <strong>the</strong> State Park System improves <strong>the</strong> quality of life in New York and<br />
<strong>the</strong>reby influences business location decisions and <strong>the</strong> ability of <strong>the</strong> <strong>state</strong> to attract<br />
a high-quality workforce. Many of <strong>the</strong>se long-term economic benefits are not<br />
easy to value. Never<strong>the</strong>less, research studies that have attempted to quantify<br />
<strong>the</strong>se benefits suggest that <strong>the</strong> total contribution of <strong>the</strong> State Park System to <strong>the</strong><br />
<strong>state</strong> economy would exceed <strong>the</strong> estimates of <strong>the</strong> impact of government and visitor<br />
spending presented in this report.<br />
The primary focus of this report is <strong>the</strong> State Park System. However, <strong>the</strong> activities<br />
of OPRHP, as a <strong>state</strong> agency, are not restricted to <strong>state</strong> <strong>park</strong>s and historic sites.<br />
They include organizing <strong>the</strong> Empire State Games; administering <strong>the</strong> <strong>state</strong> recreational<br />
boating program; oversight of over 10,000 miles of snowmobile trails; administrating<br />
local grants-in-aid programs which support <strong>park</strong> and recreational trail<br />
development by community groups and municipalities; and overseeing <strong>the</strong> <strong>state</strong>’s<br />
historic preservation programs. All of <strong>the</strong>se activities generate economic benefits<br />
for local and <strong>state</strong> economies, from promoting tourism to raising property values.<br />
THE NEW YORK STATE PARK SYSTEM: AN ECONOMIC ASSET TO THE EMPIRE STATE / PAGE 3
INTRODUCTION<br />
The New York State Office of Parks, Recreation, and Historic Preservation (OPRHP)<br />
maintains and operates 178 <strong>state</strong> <strong>park</strong>s and 35 <strong>state</strong> historic sites, covering a<br />
total of 325,000 acres. These <strong>park</strong>s and historic sites attracted over 55 million<br />
visitors during <strong>the</strong> 2007/8 season. The <strong>park</strong> <strong>system</strong> represents a valuable collection<br />
of natural and recreational assets, including 1,350 miles of hiking trails,<br />
over 8,000 campsites, nature centers, swimming pools, beaches, boat launches,<br />
and golf courses. The <strong>park</strong> <strong>system</strong> clearly makes a valuable contribution to <strong>the</strong><br />
quality of life in New York State. This report documents ano<strong>the</strong>r contribution of <strong>the</strong><br />
State Park System: its impact on <strong>the</strong> regional and <strong>state</strong> economies.<br />
The New York State Parks System is divided into eleven administrative regions:<br />
Allegany, Saratoga/Capital, Central, Finger Lakes, Genesee, Long Island, New York<br />
City, Niagara Frontier, Palisades, Taconic, and Thousand Islands. In addition, New<br />
York State has two large forest preserves—<strong>the</strong> Adirondack Park and <strong>the</strong> Catskills—<br />
which are administered separately from <strong>the</strong> State Park System. Because of <strong>the</strong>ir<br />
separate status, we do not include <strong>the</strong> Adirondack Park or <strong>the</strong> Catskills in <strong>the</strong><br />
analysis of this report. For fiscal year 2008/9, <strong>state</strong> government expenditures on<br />
<strong>the</strong> <strong>park</strong> <strong>system</strong> total about $341 million. Approximately $88 million is dedicated<br />
to capital improvements (e.g. investments in buildings, interpretive centers, roads,<br />
bridges, and recreational facilities). The remaining $253 million represents <strong>the</strong><br />
operating expenditures which support on-going activities and services.<br />
This report challenges <strong>the</strong> presumption that <strong>the</strong>re are stark trade-offs between<br />
generating jobs and protecting <strong>the</strong> environment. We specifically estimate <strong>the</strong> size<br />
of <strong>the</strong> economic contributions of <strong>the</strong> <strong>park</strong> <strong>system</strong> to <strong>the</strong> economies of each of <strong>the</strong><br />
eleven regions and to <strong>the</strong> New York State economy as a whole. We show that <strong>the</strong><br />
<strong>state</strong> spending of $341 million to operate, maintain, and improve <strong>the</strong> Park System<br />
generates economic benefits to <strong>the</strong> regional and <strong>state</strong> economies that dramatically<br />
exceed this investment. The direct <strong>state</strong> spending increases employment,<br />
supports local businesses, and generates numerous ripple effects throughout <strong>the</strong><br />
regional economies. State <strong>park</strong>s also attract visitors from outside <strong>the</strong> local community.<br />
These visitors spend money on food, shopping, transportation, recreation,<br />
and lodging, all of which gives New York’s local economies an added boost.<br />
Table 1 summarizes our estimates of <strong>the</strong> impact of <strong>state</strong> spending and visitor expenditures<br />
on <strong>the</strong> eleven regions and New York State as a whole. 1 We estimate<br />
that <strong>the</strong> combination of <strong>state</strong> and visitor spending supports up to $1.9 billion in<br />
economic output and business sales and up to 20,000 jobs throughout <strong>the</strong> <strong>state</strong>.<br />
Clearly, <strong>the</strong> impact of <strong>the</strong> <strong>state</strong> <strong>park</strong> <strong>system</strong> on New York State’s economy is<br />
sizeable and <strong>the</strong> benefits exceed <strong>the</strong> direct costs of operating <strong>the</strong> <strong>state</strong> <strong>park</strong>s<br />
many times over.<br />
1 Table 1 shows <strong>the</strong> upper-end estimates of <strong>the</strong> impact of government and visitor spending. The report<br />
presents a range of estimates in subsequent sections.<br />
THE NEW YORK STATE PARK SYSTEM: AN ECONOMIC ASSET TO THE EMPIRE STATE / PAGE 4
TABLE 1. TOTAL VISITORS AND THE ESTIMATED IMPACT OF STATE<br />
OPERATING EXPENDITURES, CAPITAL INVESTMENTS, AND VISITOR<br />
EXPENDITURES, NEW YORK STATE PARKS<br />
visitors<br />
(2007/8)<br />
employment sales/output<br />
(upper bound)<br />
# jobs ($ millions)<br />
Allegany 1.9 million 860 $62<br />
Capital/Saratoga 3.3 million 2,929 $249<br />
Central 2.3 million 1,620 $134<br />
Finger Lakes 3.0 million 1,776 $141<br />
Genesee 1.2 million 675 $58<br />
Long Island 19.9 million 3,992 $410<br />
New York City 4.5 million 716 $61<br />
Niagara Frontier 10.3 million 4,701 $569<br />
Palisades 4.4 million 1,052 $94<br />
Taconic 3.1 million 957 $102<br />
Thousand Islands 1.7 million 882 $63<br />
<strong>state</strong> 55.7 million 20,159 $1,942<br />
source: see appendix<br />
Table 1 also presents economic impact assessments for each of <strong>the</strong> eleven <strong>park</strong><br />
regions. Two factors have a large influence on <strong>the</strong> relative size of <strong>the</strong> economic<br />
impacts in each region: (1) <strong>the</strong> size of <strong>the</strong> regional <strong>park</strong> <strong>system</strong> and (2) <strong>the</strong><br />
number of non-local visitors <strong>the</strong> region attracts. The regions with <strong>the</strong> largest<br />
aggregate impacts are Long Island, <strong>the</strong> Capital/Saratoga region, and <strong>the</strong> Niagara<br />
Frontier. The regions with <strong>the</strong> smallest total impacts are <strong>the</strong> Allegany region, <strong>the</strong><br />
Genesee region, and New York City. Although <strong>the</strong> <strong>state</strong> <strong>park</strong>s in <strong>the</strong> New York City<br />
region receive a large number of visitors each year, most of <strong>the</strong> visitors are local<br />
and <strong>the</strong>refore <strong>the</strong> direct effects of visitor spending are smaller. It is also important<br />
to remember that <strong>the</strong>se figures exclude <strong>the</strong> economic impact of various local and<br />
national <strong>park</strong>s and historic sites throughout <strong>the</strong> <strong>state</strong>.<br />
The economic impact estimates featured in this report emphasize <strong>the</strong> effects of<br />
spending associated with <strong>the</strong> <strong>state</strong> <strong>park</strong>s. However, <strong>the</strong> State Park System contributes<br />
to <strong>the</strong> economic well-being of <strong>the</strong> <strong>state</strong> in ways that go beyond <strong>the</strong> immediate<br />
impacts of government and visitor expenditures. These additional benefits<br />
include maintaining valuable eco<strong>system</strong>s and biodiversity, providing opportunities<br />
for recreation, mitigating <strong>the</strong> negative impacts of pollution, improving health outcomes,<br />
preserving areas of historic importance, and protecting <strong>the</strong> <strong>state</strong>’s<br />
heritage for future generations. The <strong>state</strong> <strong>park</strong>s improve <strong>the</strong> quality of life in New<br />
York and <strong>the</strong>reby influence business location decisions and <strong>the</strong> ability of <strong>the</strong> <strong>state</strong><br />
to attract a high-quality workforce. Many of <strong>the</strong>se long-term economic benefits are<br />
not easy to value. Never<strong>the</strong>less, research studies that have attempted to quantify<br />
<strong>the</strong>se benefits suggest that <strong>the</strong> total contribution of <strong>the</strong> <strong>park</strong> <strong>system</strong> to <strong>the</strong> <strong>state</strong><br />
economy would exceed <strong>the</strong> estimates of <strong>the</strong> impact of government and visitor<br />
THE NEW YORK STATE PARK SYSTEM: AN ECONOMIC ASSET TO THE EMPIRE STATE / PAGE 5
spending presented in Table 1. We do not attempt to assess <strong>the</strong> size of <strong>the</strong>se<br />
additional economic contributions in this report, but <strong>the</strong>y should not be ignored<br />
when interpreting our findings. Because of <strong>the</strong>se numerous additional benefits,<br />
our assessments of <strong>the</strong> economic impact of <strong>the</strong> <strong>state</strong> <strong>park</strong> <strong>system</strong>, even our<br />
upper-bound estimates, underestimate <strong>the</strong> <strong>park</strong>s’ true economic contribution.<br />
The primary focus of this report is <strong>the</strong> <strong>state</strong> <strong>park</strong> <strong>system</strong>. However, <strong>the</strong> activities of<br />
<strong>the</strong> New York State Office of Parks, Recreation, and Historic Preservation—as a<br />
<strong>state</strong> agency—are not restricted to <strong>the</strong> <strong>state</strong> <strong>park</strong>s and historic sites. These<br />
additional activities are varied and substantial. They include organizing <strong>the</strong> Empire<br />
State Games; administering <strong>the</strong> <strong>state</strong> recreational boating program; oversight of<br />
over 10,000 miles of snowmobile trails; administering local grants-in-aid programs<br />
which support <strong>park</strong> and recreational trail development by community groups and<br />
municipalities; and oversight of <strong>the</strong> <strong>state</strong>’s historic preservation programs. 2 All of<br />
<strong>the</strong>se activities generate economic benefits for local and <strong>state</strong> economies, from<br />
promoting tourism to raising property values. Therefore, <strong>the</strong> assessment of<br />
economic impacts contained in this report, which focuses exclusively on <strong>the</strong> <strong>park</strong>s<br />
and historic facilities, will not represent <strong>the</strong> full contribution of <strong>the</strong> Office of Parks,<br />
Recreation, and Historic Preservation to <strong>the</strong> New York State economy.<br />
The remainder of <strong>the</strong> report is organized as follows: In <strong>the</strong> next section, we<br />
discuss <strong>the</strong> approach we use to estimate <strong>the</strong> economic impacts of <strong>the</strong> New York<br />
State <strong>park</strong> <strong>system</strong>. We focus on how expenditures, by visitors and <strong>the</strong> <strong>state</strong>, affect<br />
jobs, economic output, and employment income. Following this general discussion,<br />
we estimate <strong>the</strong> economic impact of direct government spending on <strong>the</strong><br />
<strong>park</strong> <strong>system</strong>, in terms of operating expenditures and capital improvements. We<br />
<strong>the</strong>n assess <strong>the</strong> economic impact of visitor spending on <strong>the</strong> regional and <strong>state</strong><br />
economies, given <strong>the</strong> annual number of visitors to each of <strong>the</strong> regions. Finally, we<br />
conclude by reflecting on <strong>the</strong> analysis and summarizing our findings.<br />
2 These historic preservation programs include community preservation and development activities,<br />
<strong>the</strong> redevelopment of historic structures, maintaining <strong>the</strong> National Register of Historic Places for New<br />
York State, and <strong>the</strong> administration of <strong>state</strong> and federal tax benefit programs.<br />
THE NEW YORK STATE PARK SYSTEM: AN ECONOMIC ASSET TO THE EMPIRE STATE / PAGE 6
ECONOMIC IMPACTS OF THE NEW YORK PARK SYSTEM:<br />
MEASURING THE EFFECTS<br />
We examine three channels through which <strong>the</strong> <strong>state</strong> <strong>park</strong>s and historic sites<br />
impact <strong>the</strong> <strong>state</strong> economy: operating expenditures by Office of Parks, Recreation,<br />
and Historic Preservation; expenditures on capital improvements to <strong>the</strong> <strong>park</strong>s’<br />
infrastructure; and spending by <strong>the</strong> tens of millions of visitors who come to enjoy<br />
<strong>the</strong> <strong>park</strong>s. By ‘operating expenditures’ we refer to <strong>the</strong> recurring categories of<br />
expenditures that are necessary to keep <strong>the</strong> <strong>park</strong> <strong>system</strong> going. Operating<br />
expenditures include personnel costs, administrative services, and office and<br />
maintenance supplies. Capital improvements represent durable investments in<br />
<strong>the</strong> physical infrastructure of <strong>the</strong> <strong>park</strong>s and historic sites: roads, bridges,<br />
buildings, sea walls, and <strong>the</strong> restoration of recreational facilities. When visitors<br />
come to <strong>the</strong> <strong>park</strong>s, <strong>the</strong>y also spend money in <strong>the</strong> region, on groceries, eating out,<br />
car expenses, lodging, and o<strong>the</strong>r kinds of shopping. All of <strong>the</strong>se categories of<br />
expenditures will affect <strong>the</strong> local and <strong>state</strong> economies, by increasing business<br />
sales, creating jobs, and generating <strong>new</strong> sources of income.<br />
Before moving directly into considering <strong>the</strong> impact of <strong>the</strong>se categories of spending<br />
on employment, economic activity, and incomes, it is useful to review <strong>the</strong> approach<br />
we use to generate <strong>the</strong> estimates.<br />
Expansion of spending affects economic activity through three distinct effects.<br />
These are:<br />
1. Direct effects: <strong>the</strong> impact generated directly by <strong>the</strong> expenditure itself (e.g. <strong>state</strong><br />
spending used to hire <strong>park</strong> staff or to repair a road);<br />
2. Indirect effects: <strong>the</strong> <strong>new</strong> jobs and economic output associated with increased<br />
demand for materials, goods, and services linked to direct spending (e.g. when<br />
<strong>park</strong> visitors eat in a local restaurant, <strong>the</strong>y create indirect demand for <strong>the</strong> food<br />
that is used to prepare <strong>the</strong> meal);<br />
3. Induced effects: <strong>the</strong> expansion of economic activity that results when people<br />
who get <strong>the</strong> jobs generated by <strong>the</strong> direct and indirect effects spend <strong>the</strong>ir incomes<br />
on goods and services.<br />
We begin by focusing first on direct and indirect effects. Direct and indirect effects<br />
are fairly straightforward to measure within <strong>the</strong> framework of our model, based on<br />
<strong>state</strong>-level input-output accounts. Estimating induced effects involves a broader<br />
set of considerations, including <strong>the</strong> current <strong>state</strong> of <strong>the</strong> economy. Therefore, we<br />
briefly consider <strong>the</strong> question of induced effects separately below.<br />
Input-Output Model for Estimating Direct and Indirect Job Creation<br />
Our primary tool for generating estimates of <strong>the</strong> economic impacts of <strong>park</strong>s<br />
spending is a model based on <strong>state</strong>-level and county-level input-output tables. In<br />
<strong>the</strong> technical appendix, we discuss <strong>the</strong> operation of <strong>the</strong> input-output model in<br />
more detail. Here we present a brief non-technical summary of this discussion.<br />
THE NEW YORK STATE PARK SYSTEM: AN ECONOMIC ASSET TO THE EMPIRE STATE / PAGE 7
The input-output model captures in great detail <strong>the</strong> relationships that exist<br />
between different industries in <strong>the</strong> production of goods and services. We also<br />
observe <strong>the</strong> interconnections between consumers of goods and services, including<br />
households and governments, and <strong>the</strong> various producing industries. The<br />
input-output model enables us to estimate <strong>the</strong> effects on <strong>the</strong> regional and <strong>state</strong><br />
economies of an increase in final demand for <strong>the</strong> products or services of a given<br />
industry. For example, we can estimate <strong>the</strong> number of jobs directly created in<br />
local supermarkets and food stores when <strong>park</strong> visitors spend money on groceries.<br />
We can also estimate <strong>the</strong> jobs that are indirectly created in o<strong>the</strong>r industries<br />
through <strong>the</strong> additional visitor spending. Overall, <strong>the</strong> input-output model allows<br />
us to estimate <strong>the</strong> economy-wide outcomes that result from a given level of<br />
spending in a particular area, including <strong>the</strong> effect on jobs, <strong>the</strong> value of output and<br />
sales, and incomes.<br />
The estimates from <strong>the</strong> input-output model also take into account leakages. The<br />
most important leakages occur when visitors or <strong>state</strong> agencies purchase goods or<br />
services produced outside of <strong>the</strong> local and <strong>state</strong> economies. Spending on <strong>the</strong>se<br />
goods does not raise <strong>the</strong> demand for local output. The estimates we present in<br />
this report take into account <strong>the</strong>se leakages, given <strong>the</strong> level of domestic spending<br />
in each of <strong>the</strong> <strong>park</strong> regions.<br />
Estimating Induced Job Creation<br />
It is more difficult to assess <strong>the</strong> size of <strong>the</strong> induced employment effects—or what,<br />
within standard economic models, is commonly termed <strong>the</strong> consumption<br />
multiplier—than to estimate direct and indirect effects. The induced effects<br />
represent a different category of multiplier in that <strong>the</strong>y capture <strong>the</strong> increase in<br />
employment that occurs when <strong>the</strong> income generated by <strong>the</strong> direct and indirect job<br />
creation is spent.<br />
There are aspects of <strong>the</strong> induced effects which we can estimate with a high<br />
degree of confidence. In particular, we have a good sense of what is termed <strong>the</strong><br />
‘consumption function’: what percentage of <strong>the</strong> additional money people receive<br />
from being <strong>new</strong>ly employed will be spent. But we cannot know with an equivalent<br />
degree of confidence what <strong>the</strong> overall employment effects will always be of that<br />
extra spending. To begin with, <strong>the</strong> magnitude of <strong>the</strong> induced effect will depend on<br />
existing conditions in <strong>the</strong> economy. If unemployment is high, this will mean that<br />
<strong>the</strong>re are a good number of people able and willing to take jobs if <strong>new</strong><br />
employment opportunities open up. But if unemployment is low, <strong>the</strong>re will be less<br />
room for economic activity to expand, even if <strong>new</strong>ly employed people have more<br />
money to spend.<br />
Similarly, if <strong>the</strong>re is slack in <strong>the</strong> economy’s physical resources, <strong>the</strong> capacity to<br />
expand employment will be greater, and <strong>the</strong> induced effects larger. If <strong>the</strong> economy<br />
is operating at a high level of activity <strong>the</strong>re is not likely to be a large<br />
employment gain beyond what resulted from <strong>the</strong> initial direct and indirect effects.<br />
According to <strong>the</strong> New York State Department of Labor and <strong>the</strong> U.S. Bureau of<br />
Labor Statistics, <strong>the</strong> average unemployment rate for <strong>the</strong> <strong>state</strong> was 7.0 percent as<br />
THE NEW YORK STATE PARK SYSTEM: AN ECONOMIC ASSET TO THE EMPIRE STATE / PAGE 8
of January 2009. This is <strong>the</strong> highest level of unemployment in over 15 years.<br />
Therefore, <strong>the</strong>re appears to be a good deal of slack in <strong>the</strong> <strong>state</strong> economy.<br />
Because <strong>the</strong>re is evidence of excess capacity in <strong>the</strong> <strong>state</strong> economy, we assume<br />
that <strong>the</strong> induced effects will be more or less unconstrained. We calculate <strong>the</strong> size<br />
of <strong>the</strong> induced effects by estimating how much of <strong>the</strong> additional employment<br />
income earned as a result of <strong>the</strong> increased spending linked to <strong>state</strong> <strong>park</strong>s is spent<br />
on household consumption. Using our basic input-out model, we <strong>the</strong>n estimate<br />
<strong>the</strong> number of jobs, <strong>the</strong> value of output, and <strong>the</strong> employment income that this<br />
additional consumption spending would generate, assuming that <strong>the</strong>re is ample<br />
excess capacity in <strong>the</strong> economy due to <strong>the</strong> prevailing high levels of unemployment.<br />
The details of this analysis are summarized in <strong>the</strong> appendix.<br />
Given <strong>the</strong> current economic climate, we report <strong>the</strong> total estimated economic<br />
impact which includes <strong>the</strong> direct, indirect, and induced effects in <strong>the</strong> main body of<br />
<strong>the</strong> report, since we feel <strong>the</strong>se estimates represent <strong>the</strong> most accurate assessment<br />
of <strong>the</strong> economic impacts of <strong>the</strong> <strong>park</strong> <strong>system</strong> today. In order to provide a<br />
more complete picture of <strong>the</strong> range of estimates, we also present <strong>the</strong> economic<br />
impacts limited to <strong>the</strong> direct and indirect effects in <strong>the</strong> appendix of <strong>the</strong> report for<br />
comparison purposes. We stress that <strong>the</strong> estimates that exclude <strong>the</strong> induced<br />
effects would be more appropriate when <strong>the</strong> New York State economy is booming<br />
and <strong>the</strong>re is little or no excess capacity.<br />
Economic Benefits Not Linked to State or Visitor Expenditures<br />
Our assessment of <strong>the</strong> economic impacts of <strong>the</strong> <strong>park</strong> <strong>system</strong> is restricted to a<br />
consideration of government and visitor expenditures. However, as discussed<br />
earlier, <strong>the</strong> <strong>state</strong> <strong>park</strong> <strong>system</strong> generates economic benefits that go beyond <strong>the</strong><br />
immediate impacts of direct expenditures. These contributions include sustaining<br />
valuable eco<strong>system</strong> services, mitigating pollution, improving health outcomes, and<br />
protecting <strong>the</strong> <strong>state</strong>’s natural and historic heritage.<br />
A 2004 study of <strong>the</strong> economic value of New Jersey <strong>state</strong> <strong>park</strong>s and forests<br />
included an estimate of <strong>the</strong> economic contribution of various eco<strong>system</strong> services<br />
(Mates and Reyes, 2004). Eco<strong>system</strong> services refer to processes within <strong>the</strong><br />
natural environment which are essential for sustaining <strong>the</strong> economy over time.<br />
These include protecting <strong>the</strong> water supply, removing pollutants, supporting soil<br />
formation, preventing erosion, securing <strong>the</strong> habitats of species important to<br />
humans, and maintaining environmental stability. The study estimated <strong>the</strong> annual<br />
value of <strong>the</strong>se eco<strong>system</strong> services for New Jersey to be between $395 million and<br />
$605 million. Given <strong>the</strong> greater size of <strong>the</strong> New York <strong>park</strong> <strong>system</strong>, <strong>the</strong> benefits of<br />
eco<strong>system</strong> services provided by <strong>the</strong> <strong>state</strong> <strong>park</strong>s in New York would be<br />
proportionately larger.<br />
Similarly, a report of <strong>the</strong> Texas Comptroller of Public Accounts estimated <strong>the</strong> costs<br />
<strong>the</strong> <strong>state</strong> would have to incur to remove pollutants and to manage storm water if<br />
<strong>the</strong> <strong>state</strong> <strong>park</strong>s did not provide <strong>the</strong>se services (Texas Comptroller, 2008). The total<br />
estimated costs would have been $159 million. The analysis was restricted to<br />
THE NEW YORK STATE PARK SYSTEM: AN ECONOMIC ASSET TO THE EMPIRE STATE / PAGE 9
metropolitan <strong>state</strong> <strong>park</strong>s only, so <strong>the</strong> total impact of <strong>the</strong> entire <strong>park</strong> <strong>system</strong> in<br />
Texas would have been larger.<br />
To give a final example, <strong>the</strong> U.S. Fish and Wildlife Service conducted a study of <strong>the</strong><br />
economic impact of wildlife viewing, as a recreational activity, for <strong>the</strong> country as a<br />
whole and each of <strong>the</strong> <strong>state</strong>s (Leonard, 2008). The report estimates that wildlife<br />
viewing in New York State supports nearly $1.6 billion in sales for <strong>the</strong> <strong>state</strong><br />
economy. The <strong>state</strong> <strong>park</strong>s in New York are essential for realizing <strong>the</strong>se benefits.<br />
Much wildlife viewing takes place in <strong>the</strong> <strong>state</strong> <strong>park</strong>s. Even when wildlife viewing<br />
occurs outside of <strong>the</strong> <strong>park</strong> <strong>system</strong>, <strong>the</strong> <strong>park</strong>s still provide crucial habitats and<br />
maintain biodiversity throughout <strong>the</strong> <strong>state</strong>. Although <strong>the</strong> economic benefits of<br />
wildlife viewing and bird watching cannot be entirely attributed particular <strong>state</strong><br />
<strong>park</strong>s, <strong>park</strong>s provide critical habitat and eco<strong>system</strong>s which support wildlife viewing<br />
and bird watching.<br />
This report does not attempt to place a dollar value on all <strong>the</strong>se potential benefits.<br />
The analytical focus is narrower: we only consider <strong>the</strong> impacts of government and<br />
visitor expenditures. Never<strong>the</strong>less, as this review of research studies suggests,<br />
o<strong>the</strong>r economic benefits are sizeable and should not be forgotten when interpreting<br />
<strong>the</strong> economic impacts detailed in <strong>the</strong> remaining sections of this report.<br />
THE NEW YORK STATE PARK SYSTEM: AN ECONOMIC ASSET TO THE EMPIRE STATE / PAGE 10
DIRECT GOVERNMENT SPENDING TO MAINTAIN<br />
NEW YORK STATE PARKS AND HISTORIC SITES:<br />
OPERATING EXPENDITURES AND CAPITAL IMPROVEMENTS<br />
For fiscal year 2008/9, expenditures for <strong>the</strong> State Park System by OPRHP total<br />
$341 million. Table 2 shows how <strong>the</strong>se expenditures were distributed among <strong>the</strong><br />
eleven regions. The table also presents a breakdown between operating<br />
expenditures and capital expenditures. Operating expenditures refer to recurring<br />
spending needed to finance <strong>the</strong> day-to-day activities involved in running <strong>the</strong> New<br />
York State <strong>system</strong> of <strong>park</strong>s and historic sites. Expenditures on personnel,<br />
including salaries and benefits, account for a significant share of total operating<br />
expenditures. In fiscal year 2008/9, approximately 68 percent of total operating<br />
expenditures went towards salaries and benefits. O<strong>the</strong>r recurring expenses (e.g.<br />
supplies, printing, transportation, utilities, etc.) account for <strong>the</strong> remaining portion<br />
of <strong>the</strong>se expenditures.<br />
TABLE 2. STATE EXPENDITURES ON THE NEW YORK STATE PARK<br />
SYSTEM, OFFICE OF PARKS, RECREATION, AND HISTORIC<br />
PRESERVATION, FISCAL YEAR 2008/9<br />
operating capital total<br />
($ million)<br />
Allegany $9.60 $4.50 $14.20<br />
capital $47.60 $11.00 $58.60<br />
Central $13.60 $5.40 $19.00<br />
Finger Lakes $13.90 $4.00 $17.90<br />
Genesee $8.10 $4.40 $12.50<br />
Long Island $66.30 $19.40 $85.70<br />
New York City $17.80 $5.00 $22.70<br />
Niagara $25.10 $5.30 $30.40<br />
Palisades $24.90 $7.50 $32.30<br />
Taconic $15.40 $15.10 $30.40<br />
Thousand Islands $10.90 $6.10 $17.00<br />
<strong>state</strong> $253.10 $87.60 $340.70<br />
source: OPRHP<br />
Capital expenditures refer to investments in physical infrastructure. The New York<br />
State <strong>park</strong> <strong>system</strong> maintains a variety of public assets: buildings, nature centers,<br />
cabins, camping facilities, dams, roads, bridges, swimming pools, boat launches<br />
and marinas, septic <strong>system</strong>s, and golf courses. Capital expenditures constitute<br />
any spending use to repair, upgrade, or invest in entirely <strong>new</strong> public assets. Since<br />
<strong>the</strong> activities associated with operating expenditures are distinct from those<br />
associated with capital expenditures, we analyze <strong>the</strong> impact of <strong>the</strong>se two types of<br />
government spending separately.<br />
The New York <strong>park</strong>s region with <strong>the</strong> highest level of total expenditure is <strong>the</strong> Long<br />
Island region, followed by <strong>the</strong> Capital/Saratoga region. One reason why <strong>the</strong> total<br />
THE NEW YORK STATE PARK SYSTEM: AN ECONOMIC ASSET TO THE EMPIRE STATE / PAGE 11
expenditure figures for <strong>the</strong> Capital/Saratoga region are higher than o<strong>the</strong>r regions<br />
is that <strong>the</strong> Office of Parks, Recreation, and Historic Preservation is located in<br />
Albany (and hence <strong>the</strong> Capital region). Therefore, central administrative activities<br />
are included in <strong>the</strong> total for this region. Two of <strong>the</strong> western regions, Allegany and<br />
Genesee, have <strong>the</strong> lowest expenditures, but <strong>the</strong>se two regions also have <strong>the</strong><br />
lowest number of <strong>state</strong> <strong>park</strong>s of all <strong>the</strong> agency’s regions—four and six<br />
respectively—and no <strong>state</strong> historic sites administered by OPRHP.<br />
Table 3 presents estimates of economic impact of <strong>the</strong> operating expenditures by<br />
region and for <strong>the</strong> <strong>state</strong> as a whole. The table shows estimates which include<br />
direct, indirect, and induced effects. We present three indicators that demonstrate<br />
<strong>the</strong> economic impact:<br />
• Employment: <strong>the</strong> number of jobs that are supported by New York State<br />
spending for fiscal year 2008/9.<br />
• Output and sales: <strong>the</strong> total value of economic output (e.g. business sales) that<br />
expenditures support.<br />
• Employee compensation: <strong>the</strong> amount of income from employment that <strong>the</strong><br />
expenditures support.<br />
We present <strong>the</strong>se three different indicators to provide a more complete picture of<br />
<strong>the</strong> impact of direct operating expenditures on local and <strong>state</strong> economies.<br />
TABLE 3. ECONOMIC IMPACT OF STATE OPERATING EXPENDITURES FOR<br />
FISCAL YEAR 2008/9 ON REGIONAL AND STATE ECONOMIES, DIRECT,<br />
INDIRECT, AND INDUCED EFFECTS<br />
operating<br />
expenditures employment output<br />
($ million) # jobs<br />
($ millions)<br />
Allegany $9.60 225 $15.20 $5.20<br />
Capital/Saratoga $47.60 1,058 $83.60 $25.90<br />
Central $13.60 334 $25.10 $8.90<br />
Finger Lakes $13.90 309 $23.60 $8.70<br />
Genesee $8.10 210 $15.70 $5.50<br />
Long Island $66.20 1,376 $125.30 $44.40<br />
New York City $17.70 421 $34.30 $13.20<br />
Niagara Frontier $25.10 390 $47.10 $20.60<br />
Palisades $24.90 520 $43.90 $13.10<br />
Taconic $15.40 306 $27.90 $9.30<br />
Thousand Islands $10.90 244 $16.00 $4.40<br />
<strong>state</strong> $253.10 5,393 $458 $159<br />
source: see appendix<br />
total compensation<br />
(wages and<br />
benefits)<br />
THE NEW YORK STATE PARK SYSTEM: AN ECONOMIC ASSET TO THE EMPIRE STATE / PAGE 12
We can interpret <strong>the</strong> estimated economic impacts directly from Table 3. For<br />
example, <strong>state</strong> <strong>park</strong> operating expenditures for <strong>the</strong> Niagara Frontier region are<br />
estimated to total $25 million in 2008/9. We estimate that <strong>the</strong>se operational<br />
expenditures support 390 jobs. Turning to output and sales, <strong>the</strong> total impact is<br />
estimated to be $47.1 million: $25 million in direct spending and $22.1 million<br />
due to indirect linkages to o<strong>the</strong>r sectors and induced output generated by <strong>the</strong><br />
increased spending of those who get additional income from <strong>the</strong> jobs created.<br />
On a <strong>state</strong>wide basis, we estimate that <strong>the</strong> operational expenditures of $253<br />
million in fiscal year 2008/9 support 5,393 jobs. The total employment income<br />
associated with <strong>the</strong>se jobs is $159 million. Finally, <strong>the</strong> total <strong>state</strong>wide impact on<br />
economic output is $458 million.<br />
We perform a similar exercise with capital expenditures. Table 4 summarizes <strong>the</strong><br />
estimates including direct, indirect, and induced effects. The interpretation of <strong>the</strong><br />
tables is <strong>the</strong> same as for Table 3, only now we focus on capital improve-ments.<br />
For <strong>the</strong> entire <strong>state</strong>, annual capital expenditures for 2008/9 support 1,241 jobs,<br />
$150 million in sales and economic output, and $52 million in employee<br />
compensation.<br />
TABLE 4. ECONOMIC IMPACT OF STATE CAPITAL EXPENDITURES FOR FISCAL<br />
YEAR 2008/9 ON REGIONAL AND STATE ECONOMIES, DIRECT, INDIRECT,<br />
AND INDUCED EFFECTS<br />
capital<br />
expenditures employment output<br />
($ million) # jobs<br />
employment<br />
income<br />
Allegany $4.50 70 $6.80<br />
($ millions)<br />
$1.90<br />
Capital/Saratoga $11.00 164 $19.00 $6.30<br />
Central $5.40 85 $9.50 $3.20<br />
Finger Lakes $4.00 60 $6.60 $2.10<br />
Genesee $4.20 68 $7.70 $2.50<br />
Long Island $19.40 260 $34.40 $12.70<br />
New York City $5.00 77 $9.00 $3.20<br />
Niagara Frontier $5.30 63 $9.10 $3.60<br />
Palisades $7.50 111 $12.90 $4.20<br />
Taconic $15.10 196 $25.60 $9.00<br />
Thousand Islands $6.10 87 $9.20 $2.90<br />
<strong>state</strong> $87.40 1,241 $150 $52 source: see<br />
appendix<br />
Public investments in improving and maintaining <strong>park</strong> facilities can generate<br />
economic benefits beyond those featured in Table 4. For example, improved<br />
facilities (e.g. a <strong>new</strong> nature center) will likely increase future visitation. More<br />
visitors will produce a larger total impact, as those visitors spend money in <strong>the</strong><br />
local economy. In addition, better attractions may encourage visitors to spend<br />
more money locally or to stay for longer periods of time. We do not attempt to<br />
THE NEW YORK STATE PARK SYSTEM: AN ECONOMIC ASSET TO THE EMPIRE STATE / PAGE 13
estimate <strong>the</strong>se long-run effects in this report, but it is important to keep in mind<br />
that <strong>the</strong>se benefits will exist.<br />
We summarize <strong>the</strong> impact of direct spending on <strong>the</strong> <strong>state</strong> <strong>park</strong> <strong>system</strong> by <strong>the</strong><br />
Office of Parks, Recreation, and Historic Preservation by combining <strong>the</strong>se two sets<br />
of estimates. Table 5 presents <strong>the</strong> total economic impact of all <strong>state</strong> expenditures<br />
for fiscal year 2008/9. Total <strong>state</strong> expenditures on <strong>state</strong> <strong>park</strong>s support an<br />
estimated 6,635 jobs, $211 million in employment income, and $608 million in<br />
economic activity as measured by <strong>the</strong> value of output and sales.<br />
TABLE 5. ECONOMIC IMPACT OF TOTAL STATE EXPENDITURES FOR<br />
FISCAL YEAR 2008/9 ON REGIONAL AND STATE ECONOMIES,<br />
DIRECT, INDIRECT, AND INDUCED EFFECTS<br />
p y<br />
employment output income<br />
# jobs<br />
($ millions)<br />
Allegany 294 $22.00 $7.10<br />
Capital/Saratoga 1,221 $102.60 $32.20<br />
Central 419 $34.70 $12.10<br />
Finger Lakes 370 $30.10 $10.70<br />
Genesee 278 $23.40 $8.00<br />
Long Island 1,636 $159.70 $57.10<br />
New York City 498 $43.30 $16.40<br />
Niagara Frontier 454 $56.20 $24.20<br />
Palisades 631 $56.80 $17.40<br />
Taconic 502 $53.50 $18.20<br />
Thousand Islands 331 $25.30 $7.30<br />
<strong>state</strong> 6,635 $608 $211<br />
source: see appendix<br />
JOB OPPORTUNITIES FOR THE GREEN THE NEW ECONOMY YORK STATE / page PARK 2 SYSTEM: AN ECONOMIC ASSET TO THE EMPIRE STATE / PAGE 14
THE IMPACT OF VISITOR SPENDING:<br />
NEW YORK STATE PARKS AND HISTORIC SITES<br />
Visitor spending in <strong>the</strong> State Park System: Overview<br />
Direct spending by <strong>the</strong> Office of Parks, Recreation, and Historic Preservation in<br />
each of <strong>the</strong> <strong>park</strong> regions represents only one category of spending that will impact<br />
<strong>the</strong> regional and <strong>state</strong> economies. The spending of visitors to New York State<br />
<strong>park</strong>s will also have an immediate impact on employment, business sales, and income.<br />
In this section, we estimate <strong>the</strong> economic impacts of visitor spending for<br />
<strong>the</strong> <strong>park</strong> <strong>system</strong>.<br />
In many respects, <strong>the</strong> impact of visitor spending is identical to <strong>the</strong> effects of o<strong>the</strong>r<br />
categories of expenditures. Visitor spending has a direct impact on demand for local<br />
goods and services. However, <strong>the</strong> direct impact of visitor spending generates<br />
second-round effects throughout <strong>the</strong> local economy: <strong>the</strong> indirect effects. When<br />
visitors spend money locally, businesses will need to purchase more supplies, increase<br />
employment, and expand <strong>the</strong>ir use of various services. Finally, <strong>the</strong> additional<br />
employment that visitor spending generates increases local incomes and<br />
purchasing power. When this money gets spent, <strong>the</strong> economy receives ano<strong>the</strong>r<br />
boost—through <strong>the</strong> induced effects.<br />
In order to trace <strong>the</strong>se effects throughout <strong>the</strong> regions, we need estimates of how<br />
much visitors to <strong>the</strong> <strong>park</strong>s actually spend. Ideally, in-depth studies of <strong>the</strong> economic<br />
impact of <strong>state</strong> <strong>park</strong>s will collect this information through surveys administered<br />
to visitors. These surveys collect information on total spending, <strong>the</strong> different<br />
categories of spending (e.g. lodging, food, transportation, etc.), <strong>the</strong> type of visitor<br />
(e.g. local/non-local), and <strong>the</strong> length of <strong>the</strong> stay (e.g. day trip, overnight, or<br />
multiple nights). The information collected is compiled and estimates of total<br />
spending for <strong>the</strong> entire <strong>park</strong> <strong>system</strong> are calculated. The input-output model, described<br />
earlier, <strong>the</strong>n produces estimates of <strong>the</strong> regional and <strong>state</strong>wide impact of<br />
visitor spending.<br />
For this report visitor expenditures are based on studies of o<strong>the</strong>r <strong>park</strong> <strong>system</strong>s in<br />
<strong>the</strong> United States, combined with information on visitor numbers in New York. To<br />
develop <strong>the</strong>se estimates, we reviewed a number of economic impact studies of<br />
<strong>state</strong> <strong>park</strong> <strong>system</strong>s, individual <strong>park</strong>s, and national <strong>park</strong>s, monuments, and historic<br />
sites in order to develop reasonable estimates of spending per visitor that could<br />
be applied to <strong>the</strong> New York <strong>park</strong>s. The appendix describes <strong>the</strong>se studies and discusses<br />
<strong>the</strong> estimates in greater depth.<br />
Here we will simply summarize our findings and assumptions. Since we have information<br />
on <strong>the</strong> number of visitors to New York State <strong>park</strong>s, we estimate total<br />
visitor expenditures by multiplying an estimate of average spending per visitor,<br />
drawn from o<strong>the</strong>r studies, by <strong>the</strong> actual number of visitors to <strong>the</strong> <strong>park</strong>s and historic<br />
sites in New York. We restrict our attention to estimates from research studies<br />
of o<strong>the</strong>r <strong>state</strong> <strong>park</strong> <strong>system</strong>s. We limit our focus for three reasons. (1) The<br />
current study is focused on <strong>the</strong> <strong>state</strong> <strong>park</strong> <strong>system</strong> in New York, so <strong>the</strong>re is a natu-<br />
THE NEW YORK STATE PARK SYSTEM: AN ECONOMIC ASSET TO THE EMPIRE STATE / PAGE 15
al parallel between <strong>the</strong> current study and <strong>the</strong> o<strong>the</strong>r <strong>state</strong> <strong>park</strong> studies. (2) Individual<br />
<strong>park</strong>s vary widely in terms of facilities, attractions, and, <strong>the</strong>refore, spending<br />
per visitor. Using spending estimates from single <strong>park</strong>s or historic sites will generate<br />
a range of estimates that is too wide to be useful. Averaging across a <strong>park</strong> <strong>system</strong><br />
tends to smooth out <strong>the</strong>se individual variations. (3) National <strong>park</strong>s have been<br />
studied extensively and we review a number of <strong>the</strong> relevant estimates in <strong>the</strong> appendix.<br />
In general, visitors to national <strong>park</strong>s tend to spend more on average than<br />
visitors to <strong>state</strong> <strong>park</strong>s. One reason for this is that a large fraction of visitors travel<br />
long distances with <strong>the</strong> sole purpose of visiting a particular national <strong>park</strong>. Using<br />
average spending calculations from national <strong>park</strong>s to estimate spending in <strong>state</strong><br />
<strong>park</strong>s will <strong>the</strong>refore tend to inflate <strong>the</strong> economic impacts. We prefer to err on <strong>the</strong><br />
side of caution and <strong>the</strong>refore use <strong>the</strong> national <strong>park</strong>s spending estimates for comparison<br />
purposes only.<br />
After reviewing studies of <strong>state</strong> <strong>park</strong>s in Missouri, Texas, California, Minnesota,<br />
Arizona, and North Carolina, we feel that a reasonable range for per visitor spending,<br />
expressed in 2007/8 dollars, would be from $17 to $35. Note that <strong>the</strong>se are<br />
average figures for all types of visitors, locals and non-locals alike. Many local visitors<br />
to <strong>the</strong> New York State <strong>park</strong>s are likely to spend less than $17 per person. Outof-<strong>state</strong><br />
visitors with larger transportation, lodging, and food costs will likely spend<br />
more than $35 per person. This pattern is certainly true for <strong>the</strong> studies we reviewed.<br />
Therefore, to best extent possible, we made adjustments to <strong>the</strong> average<br />
spending figures so that <strong>the</strong> estimates were comparable, given <strong>the</strong> composition of<br />
local and non-local visitors to <strong>the</strong> New York State <strong>park</strong>s. See <strong>the</strong> appendix for<br />
more details.<br />
Total number of visitors and estimates of <strong>the</strong>ir expenditures<br />
Table 6 presents figures for total number of visitors by region to <strong>the</strong> New York<br />
State <strong>park</strong>s for <strong>the</strong> 2007/8 season and our estimates of a credible range for total<br />
visitor expenditures. We present a low-end estimate and a high-end estimate. The<br />
low-end estimate is calculated by assuming that <strong>park</strong> visitors spend, on average,<br />
$17 per person. The high-end estimate is calculated by assuming that spending<br />
levels amounted to $35 per visitor. As Table 6 indicates, <strong>the</strong>re were 55.7 million<br />
visitors to New York State <strong>park</strong>s during <strong>the</strong> 2007/8 season. 3 Using our proposed<br />
range for per visitor spending, we estimate that total visitor spending would have<br />
been between $946 million and $1.9 billion.<br />
3 Note ‘visitors’ refer to <strong>the</strong> number of visits by individuals over <strong>the</strong> course of <strong>the</strong> season. Therefore, a<br />
single individual can be counted as more than one visitor.<br />
THE NEW YORK STATE PARK SYSTEM: AN ECONOMIC ASSET TO THE EMPIRE STATE / PAGE 16
TABLE 6. VISITORS TO NEW YORK STATE PARKS IN THE 2007/8<br />
SEASON AND ESTIMATED TOTAL VISITOR EXPENDITURE<br />
attendance<br />
total visitor spending<br />
($ million)<br />
(thousands) low high<br />
Allegany 1,981 $33.70 $69.30<br />
Capital/Saratoga 3,300 $56.10 $115.50<br />
Central 2,349 $39.90 $82.20<br />
Finger Lakes 2,958 $50.30 $103.50<br />
Genesee 1,234 $21.00 $43.20<br />
Long Island 19,798 $336.60 $692.90<br />
New York City 4,503 $76.60 $157.60<br />
Niagara Frontier 10,292 $175.00 $360.20<br />
Palisades 4,411 $75.00 $154.40<br />
Taconic 3,113 $52.90 $109.00<br />
Thousand Islands 1,718 $29.20 $60.10<br />
<strong>state</strong> 55,657 $946.20 $1,948.00<br />
source: visitor numbers, 2007 NYS Statistical Yearbook;<br />
visitor spending estimates, see text<br />
To avoid overestimating <strong>the</strong> economic impact of visitor spending, we exclude<br />
spending by local users of <strong>the</strong> <strong>park</strong>s. The simplifying assumption we adopt is that<br />
spending by locals in <strong>the</strong> local economy would generally happen anyway. Of<br />
course, if <strong>the</strong> <strong>park</strong> did not exist, locals would spend <strong>the</strong>ir money on different<br />
goods and services, but much of <strong>the</strong> spending would occur regardless. For example,<br />
instead of buying food for a picnic, families would buy food for lunch at home.<br />
The types of food would be different, but local spending would still occur. Most<br />
studies of <strong>the</strong> economic impact of visitor spending in <strong>park</strong>s assume that <strong>the</strong> net<br />
effect of <strong>the</strong> expenditures of local visitors is zero or close to zero. 4 We adopt this<br />
same convention in this study. The same argument does not apply to non-local<br />
visitors, particularly those whose primary purpose is to visit <strong>the</strong> <strong>park</strong>. If <strong>the</strong> <strong>park</strong><br />
did not exist, spending in <strong>the</strong> local economy by <strong>the</strong>se individuals would be zero.<br />
Moreover, non-local visitors are likely to incur expenses, e.g. in terms of transportation<br />
and lodging, which <strong>the</strong>y would not have incurred if <strong>the</strong>y spent <strong>the</strong>ir leisure<br />
time in <strong>the</strong>ir home communities. Therefore, spending by non-local visitor represents<br />
a net increase in demand from <strong>the</strong> perspective of <strong>the</strong> regional economy.<br />
Three of <strong>the</strong> studies of <strong>state</strong> <strong>park</strong> <strong>system</strong>s include a breakdown of total spending<br />
by local visitors and total spending by non-local visitors: Minnesota, Missouri,<br />
and Texas. From <strong>the</strong>se studies, we calculate that <strong>the</strong> ratio of non-local visitor<br />
4 We can think of examples where <strong>the</strong> existence of a <strong>park</strong> may cause locals to increase <strong>the</strong>ir total<br />
spending—e.g. purchasing sporting equipment using income that <strong>the</strong>y would have saved. However,<br />
estimating <strong>the</strong> size of <strong>the</strong>se effects would be complicated and subject to errors. By assuming that<br />
<strong>the</strong>se effects are negligible, we adopt a more conservative approach to our estimates and guard<br />
against exaggerating <strong>the</strong> economic impact of <strong>park</strong> visitors.<br />
THE NEW YORK STATE PARK SYSTEM: AN ECONOMIC ASSET TO THE EMPIRE STATE / PAGE 17
spending to average visitor spending is about 2.0 (see appendix). That is, nonlocal<br />
visitors spend twice as much compared to <strong>the</strong> average across all visitors.<br />
We have survey information, collected by <strong>the</strong> New York State Office of Parks, Recreation,<br />
and Historic Preservation, on <strong>the</strong> distance visitors travelled to visit <strong>park</strong>s<br />
in each of <strong>the</strong> regions. For <strong>the</strong> purposes of this study, we define non-local visitors<br />
in New York State to be those visitors who travelled more than 80 miles to visit<br />
one of <strong>the</strong> <strong>park</strong>s. Table 7 summarizes non-local visitors expressed as a percentage<br />
of total visitors for each of <strong>the</strong> New York <strong>park</strong> regions. Table 7 also presents<br />
estimates of total non-local visitor spending, assuming that non-local visitors<br />
spend twice as much as <strong>the</strong> average visitor. The figures for total non-local visitor<br />
spending by region are used to estimate <strong>the</strong> economic impacts of visitor spending.<br />
Note that <strong>the</strong> Niagara Frontier region has <strong>the</strong> highest levels of non-local visitor expenditures.<br />
This is because <strong>the</strong> <strong>park</strong>s in this region attract many more visitors who<br />
travel a significant distance.<br />
TABLE 7. SHARE OF NON- LOCAL VISITORS AND ESTIMATED<br />
TOTAL NON- LOCAL VISITOR EXPENDITURES BY REGION<br />
non-local visitor<br />
expenditures<br />
non-local visitors ($ millions)<br />
(percent) low high<br />
Allegany 18.20% $12.20 $25.20<br />
Capital/Saratoga 36.20% $40.60 $83.60<br />
Central 32.40% $25.90 $53.30<br />
Finger Lakes 31.70% $31.80 $65.60<br />
Genesee 20.80% $8.70 $18.00<br />
Long Island 9.50% $64.20 $132.20<br />
New York City 2.90% $4.50 $9.20<br />
Niagara Frontier 37.80% $132.40 $272.70<br />
Palisades 6.80% $10.20 $20.90<br />
Taconic 12.20% $12.90 $26.50<br />
Thousand Islands 21.40% $12.50 $25.70<br />
<strong>state</strong> 18.50% $35 6 $ 733<br />
source: non-local visitors, OPRHP; expenditures, see text<br />
We also need to determine how <strong>park</strong> visitors are likely to spend <strong>the</strong>ir money.<br />
Again we turn to <strong>the</strong> detailed studies that already exist for guidance. More details<br />
of our review of <strong>the</strong>se studies are provided in <strong>the</strong> appendix. Here we report our<br />
conclusions. In general, <strong>the</strong> expenditures of <strong>park</strong> visitors are concentrated in six<br />
broad categories: groceries, restaurants and bars, general shopping/retail, recreational<br />
goods, lodging, and transportation/automobile. Spending by category varies<br />
between local and non-local visitors, but here we are focusing on spending by nonlocals<br />
only. Table 8 presents <strong>the</strong> composition of non-local visitor spending used to<br />
generate <strong>the</strong> economic impact assessments.<br />
THE NEW YORK STATE PARK SYSTEM: AN ECONOMIC ASSET TO THE EMPIRE STATE / PAGE 18
TABLE 8. SHARES OF NON- LOCAL VISITOR<br />
EXPENDITURES BY CATEGORY, USED TO ESTIMATE<br />
ECONOMIC IMPACTS<br />
groceries and retail food shops 12%<br />
transportation and automobile 20%<br />
eating out (restaurants and bars) 22%<br />
general shopping (non-food) 12%<br />
recreational equipment 9%<br />
lodging (all types) 25%<br />
source: see appendix<br />
Economic impacts of visitor expenditures<br />
We now estimate <strong>the</strong> economic impact of visitor spending. Table 9 presents our<br />
projections of <strong>the</strong> impact of visitor expenditures in terms of employment, output<br />
and sales, and employment income for each of <strong>the</strong> <strong>park</strong> regions and for <strong>the</strong> <strong>state</strong><br />
as a whole. The table shows estimates that include <strong>the</strong> induced effects in addition<br />
to <strong>the</strong> direct and indirect impacts. In both tables, we present a low-end estimate<br />
and a high-end estimate, corresponding to <strong>the</strong> low and high estimates of non-local<br />
visitor spending.<br />
TABLE 9. ECONOMIC IMPACT OF ESTIMATED NON- LOCAL VISITOR<br />
EXPENDITURES ON REGIONAL AND STATE ECONOMIES, DIRECT, INDIRECT<br />
AND INDUCED EFFECTS (2007/8 SEASON)<br />
employment output employment Income<br />
low high low high low high<br />
# jobs ($ millions)<br />
Allegany 275 566 $19 $40 $5 $11<br />
Capital/Saratoga 830 1,708 $71 $147 $22 $45<br />
Central 583 1,201 $48 $99 $13 $28<br />
Finger Lakes 683 1,406 $54 $111 $15 $32<br />
Genesee 192 396 $17 $35 $5 $10<br />
Long Island 1,145 2,356 $121 $250 $34 $70<br />
New York City 106 218 $9 $18 $2 $5<br />
Niagara Frontier 2,063 4,247 $249 $512 $75 $154<br />
Palisades 204 421 $18 $37 $5 $11<br />
Taconic 221 455 $23 $48 $7 $14<br />
Thousand Islands 267 550 $18 $38 $6 $11<br />
<strong>state</strong> 6,569 13,524 $648 $1,334 $190 $391<br />
source: see appendix<br />
We estimate that <strong>the</strong> total employment supported by visitor spending would range<br />
between 6,569 and 13,524, <strong>the</strong> impact on output and sales would be between<br />
$648 million and $1.3 billion, and <strong>the</strong> additional employment income earned<br />
would range between $190 and $391 million.<br />
THE NEW YORK STATE PARK SYSTEM: AN ECONOMIC ASSET TO THE EMPIRE STATE / PAGE 19
We recommend that future studies of this kind include field-based visitor surveys<br />
to generate expenditure figures. In <strong>the</strong> current study, we base our analysis of <strong>the</strong><br />
impact of visitor spending on careful, comparable studies of o<strong>the</strong>r <strong>state</strong> <strong>park</strong> <strong>system</strong>s.<br />
To explore whe<strong>the</strong>r our findings are reasonable, we compare our assessment<br />
of <strong>the</strong> economic impacts of <strong>state</strong> <strong>park</strong>s in New York with <strong>the</strong> economic<br />
impacts of <strong>state</strong> <strong>park</strong>s contained in <strong>the</strong>se o<strong>the</strong>r studies.<br />
Our estimates of <strong>the</strong> total expenditures of <strong>the</strong> 55.7 million visitors to New York<br />
State <strong>park</strong>s total between $946 million and $1.9 billion (see Table 6). We estimate<br />
that non-local visitors account for between $356 and $733 million of <strong>the</strong>se<br />
total expenditures. This spending would support approximately 6,500 to 13,500<br />
jobs, depending on <strong>the</strong> level of visitor expenditures. A recent study of visitor<br />
spending in 79 Texas <strong>state</strong> <strong>park</strong>s found that non-local visitors spent an estimated<br />
$283 million (Crompton and Culpepper, 2006). In 2006, <strong>the</strong> total number of visitors<br />
(local and non-local) was 9.8 million, less than a fifth of <strong>the</strong> New York total.<br />
The estimated total employment impact of this spending was 8,079 jobs. Given<br />
that our estimates of non-local expenditures in New York State <strong>park</strong>s are 125% to<br />
260% higher than those of <strong>the</strong> Texas <strong>park</strong>s examined in <strong>the</strong> study, our assessment<br />
of <strong>the</strong> employment impacts of visitor spending in New York appear reasonable,<br />
if not conservative, in light of <strong>the</strong> findings of <strong>the</strong> Texas study.<br />
A study of <strong>the</strong> economic impact of <strong>state</strong> <strong>park</strong> visitors in Missouri in 2002 found<br />
that <strong>the</strong>re were 13.8 million visitors to <strong>the</strong> <strong>state</strong>’s <strong>park</strong>s (Cole, Vessell, and Zhu,<br />
2003), roughly one-quarter of <strong>the</strong> number of visitors to New York <strong>park</strong>s. In <strong>the</strong><br />
Missouri study, out-of-<strong>state</strong> visitors were estimated to have spent a total of $100<br />
million and this spending would have supported 2,013 jobs. These numbers are<br />
of roughly <strong>the</strong> same magnitude as our estimates, if we account for <strong>the</strong> fact that<br />
<strong>the</strong>re are about four times as many visitors to New York <strong>park</strong>s and that non-local<br />
spending was four to seven times <strong>the</strong> out-of-<strong>state</strong> spending in <strong>the</strong> Missouri study.<br />
A study of fourteen <strong>park</strong>s in <strong>the</strong> North Carolina <strong>state</strong> <strong>park</strong> <strong>system</strong> estimated that<br />
non-local visitors to <strong>the</strong>se <strong>park</strong>s totaled 3.4 million and spent $80 million during<br />
<strong>the</strong> 2005/6 season (Greenwood and Vick, 2008). The total employment impact<br />
of this spending was estimated to be 2,120 jobs. Our estimate of non-local spending<br />
linked to <strong>the</strong> New York State <strong>park</strong>s is between 4.5 and nine times higher than<br />
that found in North Carolina. Scaling up <strong>the</strong> employment impact by <strong>the</strong>se factors<br />
would make <strong>the</strong> North Carolina projections approximately consistent with, or<br />
much larger than, our range of estimates, depending on whe<strong>the</strong>r we scale up by a<br />
factor of 4.5 or nine.<br />
The point of <strong>the</strong>se comparisons is not to argue that <strong>the</strong> New York State estimates<br />
are equivalent to <strong>the</strong> economic impact estimates from <strong>the</strong>se o<strong>the</strong>r <strong>state</strong>s. Our objective<br />
in making <strong>the</strong>se comparisons is simpler: to show that <strong>the</strong> range of estimates<br />
we have generated for New York State is credible when compared to o<strong>the</strong>r<br />
studies that are based on actual survey data. From this comparison, we find that<br />
<strong>the</strong> estimates from studies of o<strong>the</strong>r <strong>state</strong> <strong>park</strong> <strong>system</strong>s are more in line with our<br />
upper-bound assessment of <strong>the</strong> economic impact of <strong>park</strong>s in New York State. We<br />
also do not put a precise dollar value on <strong>the</strong> numerous economic benefits which<br />
THE NEW YORK STATE PARK SYSTEM: AN ECONOMIC ASSET TO THE EMPIRE STATE / PAGE 20
are not directly tied to government and visitor expenditures and which we discussed<br />
at length earlier in <strong>the</strong> report. Therefore, we feel that our upper-bound estimates<br />
are a reasonable, if not conservative, estimate of <strong>the</strong> economic benefits<br />
of <strong>the</strong> New York <strong>state</strong> <strong>park</strong> <strong>system</strong>.<br />
THE NEW YORK STATE PARK SYSTEM: AN ECONOMIC ASSET TO THE EMPIRE STATE / PAGE 21
CONCLUSIONS<br />
The New York State <strong>park</strong>s generate sizeable economic benefits for <strong>the</strong> economies<br />
of <strong>the</strong> <strong>park</strong>s regions and for <strong>the</strong> <strong>state</strong> as a whole. On a <strong>state</strong>wide basis, spending<br />
by <strong>the</strong> Office of Parks, Recreation, and Historic Preservation and visitors to <strong>the</strong><br />
<strong>state</strong> <strong>park</strong>s supports up to 20,000 jobs, $1.9 billion in output and sales, and<br />
$440 million in employment income. 5 These benefits are distributed among <strong>the</strong><br />
eleven regions which constitute <strong>the</strong> New York State <strong>park</strong> <strong>system</strong>. The <strong>state</strong> <strong>park</strong>s<br />
are currently supported by $341 million in total expenditures, including $88 million<br />
in capital investments. This investment in <strong>the</strong> <strong>state</strong> <strong>park</strong>s clearly pays off in<br />
terms of real economic dividends.<br />
Although <strong>the</strong> total economic benefits of <strong>the</strong> <strong>park</strong>s and historic sites are large, it<br />
would be a mistake to reduce <strong>the</strong>ir value to a matter of jobs and business sales.<br />
The <strong>park</strong> <strong>system</strong> makes numerous economic contributions that are real and valuable,<br />
but difficult to assess and price. These benefits include maintaining <strong>the</strong><br />
natural environment, providing an escape for millions of New Yorkers and o<strong>the</strong>rs<br />
from around <strong>the</strong> world, and protecting <strong>the</strong> <strong>state</strong>’s heritage for future generations.<br />
Investments in <strong>the</strong> <strong>park</strong> <strong>system</strong> generate many different kinds of returns<br />
and all of <strong>the</strong>se benefits should be considered in assessing <strong>the</strong> real contribution<br />
of <strong>the</strong> <strong>park</strong> <strong>system</strong>.<br />
5 These numbers have been rounded off, but are based on <strong>the</strong> estimates in Tables 5 and 9.<br />
THE NEW YORK STATE PARK SYSTEM: AN ECONOMIC ASSET TO THE EMPIRE STATE / PAGE 22
APPENDIX<br />
A. The Input-Output Model and Employment Multipliers<br />
1. The Regional Input-Output Models<br />
National input-output tables (i.e. I-O tables) are compiled by <strong>the</strong> Bureau of Economic<br />
Analysis (BEA). Every five years <strong>the</strong> Census Department ga<strong>the</strong>rs data (in its<br />
“Economic Census”) and <strong>the</strong> BEA uses this data along with information from o<strong>the</strong>r<br />
Census programs, including annual surveys that cover selected industries, such<br />
as manufacturing and services. The I-O tables also incorporate data collected and<br />
tabulated by o<strong>the</strong>r Federal agencies—including <strong>the</strong> U.S. Departments of Agriculture,<br />
Education, and Energy—and data from a number of private organizations<br />
(Horowitz and Planting, 2006). However, <strong>the</strong> input-output matrices made available<br />
through <strong>the</strong> BEA are suited for national-level analysis only.<br />
To calculate <strong>the</strong> detailed employment impact assessments contained in this report,<br />
we used <strong>the</strong> social accounting and impact assessment software package,<br />
IMPLAN Pro (Version 2.0). IMPLAN is calibrated to <strong>the</strong> BEA I-O tables and includes<br />
a highly detailed level of industrial disaggregation: over 500 different sectors. Our<br />
input-output model is calibrated using 2007 data. State-level and county-level<br />
data files are available for use with <strong>the</strong> IMPLAN software. We use <strong>the</strong> 2007<br />
county-level files for New York State to generate our estimates. Regional models—<br />
corresponding to <strong>the</strong> eleven <strong>park</strong>s regions in New York State—were created by<br />
pooling county-level data.<br />
2. Using <strong>the</strong> Input-Output Model to Examine Economic Multipliers<br />
To study <strong>the</strong> effects on employment, output/sales, and employee compensation<br />
with <strong>the</strong> regional I-O models, we use <strong>the</strong> IMPLAN software to generate <strong>the</strong> relevant<br />
multipliers. Employment multipliers are computed based on an employmentoutput<br />
ratio. The assumption is that employment/output ratios remain fixed in <strong>the</strong><br />
short-run. Therefore, output multipliers—derived from <strong>the</strong> Leontief inverse matrix—<br />
can be converted into employment multipliers by using <strong>the</strong> employment-output ratios.<br />
Similarly, output multipliers can also be converted into multipliers for employee<br />
compensation using fixed coefficients. The IMPLAN software performs<br />
<strong>the</strong>se calculations automatically.<br />
The I-O model can also be used to calculate induced effects. The assumption is<br />
that a fixed proportion of <strong>the</strong> compensation employees receive is spent on household<br />
purchases. When total compensation goes up, household consumption (a<br />
category of final demand) increases proportionately. However, <strong>the</strong> I-O model of induced<br />
effects, computed by endogenizing <strong>the</strong> household sector, tends to generate<br />
implausibly large multiplier effects. Therefore, we do not use <strong>the</strong> direct I-O estimates<br />
of induced effects in our calculations but instead use a different methodology,<br />
described later in <strong>the</strong> appendix.<br />
THE NEW YORK STATE PARK SYSTEM: AN ECONOMIC ASSET TO THE EMPIRE STATE / PAGE 23
3. Categories of spending and I-O multipliers<br />
To perform <strong>the</strong> kind of economic impact analysis featured in this report we<br />
needed to match <strong>the</strong> expenditure categories with <strong>the</strong> disaggregated sectors in<br />
order to calculate <strong>the</strong> various multipliers. These multipliers are <strong>the</strong>n used to estimate<br />
<strong>the</strong> economic impacts of increasing <strong>the</strong> relevant category of expenditure. In<br />
cases where more than one industrial sector is relevant, we constructed a<br />
weighted average of <strong>the</strong> different sectors in which we arbitrarily select <strong>the</strong> weights<br />
based on our review of <strong>the</strong> studies of o<strong>the</strong>r <strong>state</strong> <strong>park</strong> <strong>system</strong>s. 6 For this study,<br />
<strong>the</strong> categories of expenditure and <strong>the</strong> corresponding sectors used are as follows.<br />
• Direct operating expenditures on <strong>park</strong>s and historic sites: Parks, historic<br />
sites, museums, and zoos<br />
• Capital expenditures on <strong>park</strong> infrastructure: Non-residential construction<br />
• Visitor expenditures on groceries: Food retail establishments<br />
• Visitor expenditures on restaurants: Food service and drinking establishments<br />
• Visitor expenditures on automobiles: 90% gas station establishments, 5%<br />
automobile repair services, 5% automobile rental services.<br />
• Visitor expenditures on recreational equipment: sporting goods retail establishments<br />
• Visitor expenditures on lodging: 50% hotels and motels, 50% o<strong>the</strong>r lodging<br />
services<br />
• Visitor expenditures on o<strong>the</strong>r retail: general merchandising<br />
B. Calculating induced effects<br />
Induced effects refer to <strong>the</strong> additional employment, output, and income that are<br />
produced when <strong>the</strong> additional employee compensation generated by an initial<br />
demand stimulus—as captured by <strong>the</strong> direct and indirect effects—is spent. The<br />
magnitude of <strong>the</strong> induced effects depends on how <strong>the</strong> additional employment income<br />
translates into household expenditures and <strong>the</strong> size of <strong>the</strong> multiplier effects<br />
associated with <strong>the</strong> increase in household spending.<br />
Induced effects are often estimated by endogenizing <strong>the</strong> household sector in <strong>the</strong><br />
input-output model. The assumption is that increases in employee compensation<br />
(or value added) finance greater household spending, as reflected in <strong>the</strong> vector of<br />
household consumption in overall final demand. The endogenous household<br />
model often yields very large induced effects, in part because <strong>the</strong> propensity to<br />
consume out of employee compensation (or value-added) implicit in <strong>the</strong> endogenous<br />
household input-output model is large.<br />
Instead of relying on <strong>the</strong> consumption function which is implicit in <strong>the</strong> input-output<br />
accounts, we estimate <strong>the</strong> relationship between real gross employee compensation<br />
and real personal consumption expenditures econometrically using a dynamic<br />
6 In <strong>the</strong>se cases, altering <strong>the</strong> weights does not change <strong>the</strong> magnitude of <strong>the</strong> overall multipliers in any<br />
meaningful way.<br />
THE NEW YORK STATE PARK SYSTEM: AN ECONOMIC ASSET TO THE EMPIRE STATE / PAGE 24
empirical model for <strong>the</strong> entire U.S. This gives us a more accurate sense of how<br />
household consumption responds to changes in employee compensation. We<br />
<strong>the</strong>n integrate this estimated relationship into our basic input-output model to<br />
calculate induced effects.<br />
The first step of <strong>the</strong> process is to estimate <strong>the</strong> relationship between personal consumption<br />
expenditures and employee compensation. To do this, we begin with <strong>the</strong><br />
following dynamic empirical model:<br />
Ct = α + β1Ct-1 + β2Ct-2 + β3Ct-3 + γEt + μt<br />
In <strong>the</strong> above equation, Ct represents real personal consumption expenditures in<br />
time period ‘t,’ Et represents real employee compensation, and μt is a stochastic<br />
error term. We are interested in how changes in employee compensation affect<br />
changes in personal consumption expenditures. Therefore, we estimate <strong>the</strong> model<br />
in first differences. First differencing also insures that <strong>the</strong> variables are stationary<br />
(based on augmented Dickey-Fuller unit root tests). The GDP-deflator for personal<br />
consumption expenditures is used to transform nominal values into real variables.<br />
The time series is quarterly, and extends from 1950 to 2007. All data comes from<br />
<strong>the</strong> Bureau of Economic Analysis, U.S. Department of Commerce.<br />
The estimated model is (rounding off <strong>the</strong> coefficients):<br />
Ct = 7.83 + 0.10 Ct-1 + 0.20 Ct-2 + 0.21 Ct-3 + 0.30 Et<br />
(3.2) (1.7) (3.5) (3.6) (5.9)<br />
T-values are reported in paren<strong>the</strong>ses. From this model, we can calculate <strong>the</strong> impact<br />
of a change in employee compensation on personal consumption expenditures,<br />
taking into account <strong>the</strong> dynamic feedback effects captured by <strong>the</strong> lag<br />
endogenous variables:<br />
γ<br />
0 .2952<br />
= = 0.6132<br />
1 - (β1 + β2 + β3 ) 1 - 0.5186<br />
This implies that a $1 million increase in gross employee compensation will be<br />
associated with a $613,200 increase in household consumption.<br />
Next, we need to estimate <strong>the</strong> feedback effects; that is, <strong>the</strong> impact of <strong>the</strong> increase<br />
in household consumption on employee compensation. Additional household consumption<br />
expenditures will increase <strong>the</strong> vector of final demand in <strong>the</strong> input-output<br />
model and, through direct and indirect employment effects, raise employee compensation.<br />
For example, using our input-out model for <strong>the</strong> Palisades region and restricting <strong>the</strong><br />
estimates to direct and indirect effects only, we find that a $1 increase in household<br />
final demand is associated with an increase in employee compensation of<br />
$0.222. 7 We obtain similar estimates for each of <strong>the</strong> o<strong>the</strong>r <strong>park</strong>s regions.<br />
7 We use <strong>the</strong> IMPLAN calibrated model and restrict our focus to households with annual incomes<br />
between $25,000 and $100,000, under <strong>the</strong> assumption that <strong>the</strong> vast majority of <strong>the</strong> jobs created<br />
would affect households with incomes in this range.<br />
THE NEW YORK STATE PARK SYSTEM: AN ECONOMIC ASSET TO THE EMPIRE STATE / PAGE 25
We can now estimate <strong>the</strong> multipliers—in terms of employment, output, and employment<br />
income—for each additional $1 million in employee compensation generated<br />
by <strong>the</strong> direct and indirect effects of any particular final demand stimulus.<br />
We do this for each of <strong>the</strong> <strong>park</strong> regions. First, we calculate <strong>the</strong> total impact on<br />
household consumption of a $1 increase in employee compensation. This would<br />
be given by <strong>the</strong> following expression:<br />
total impact on HH consumption = x + x 2 y + x 3 y 2 + x 4 y 3 + …….<br />
In which ‘x’ is <strong>the</strong> estimated propensity to consume out of additional employee<br />
compensation (0.6132 according to our estimates described above) and ‘y’ is <strong>the</strong><br />
additional employee compensation generated by a $1 increase in final household<br />
demand (0.222 from <strong>the</strong> basic input-output model for <strong>the</strong> Palisades region). We<br />
can factor out a single ‘x,’ giving us:<br />
total impact on HH consumption = x[1 + xy + (xy) 2 + (xy) 3 + …….]<br />
The expression in <strong>the</strong> brackets is an infinite series. Since xy
souri, North Carolina, and Texas. 8 Three of <strong>the</strong>se studies—Minnesota, Texas and<br />
Missouri—contain information on average spending by locals and non-locals. 9 The<br />
Arizona and North Carolina Studies restricted <strong>the</strong>ir attention to spending by nonlocals<br />
only. Citations for all <strong>the</strong>se studies are contained in <strong>the</strong> list of references.<br />
We first focused on estimating <strong>the</strong> ratio of spending of non-locals to average<br />
spending for <strong>the</strong> three <strong>state</strong> studies for which we had estimates of non-local and<br />
average spending: Minnesota, Missouri, and Texas. One challenge is that average<br />
spending will be influenced by <strong>the</strong> composition of <strong>the</strong> visitors: <strong>the</strong> more non-local<br />
visitors, <strong>the</strong> greater <strong>the</strong> average spending. However, we have information on <strong>the</strong><br />
composition of visitors for each of <strong>the</strong>se <strong>state</strong>s. In addition, we have estimates of<br />
<strong>the</strong> composition of non-local visitors for <strong>the</strong> New York State <strong>park</strong> <strong>system</strong>. If define<br />
‘non-local visitors’ in New York to include all those who drove more than 80 miles<br />
to visit a <strong>park</strong>, <strong>the</strong>n 18.5 percent of all visitors to New York State <strong>park</strong>s are nonlocal.<br />
We can adjust <strong>the</strong> average spending numbers for Minnesota, Missouri, and<br />
Texas to reflect <strong>the</strong> visitor composition in New York; that is, we calculate what average<br />
spending per visitor would be if <strong>the</strong> share of non-local visitors were identical<br />
to <strong>the</strong> share in New York.<br />
TABLE A1. SUMMARY OF CALCULATIONS OF THE RATIO OF NON- LOCAL<br />
VISITOR SPENDING TO AVERAGE VISITOR SPENDING BASED ON STUDIES<br />
OF MINNESOTA, MISSOURI, AND TEXAS<br />
<strong>state</strong><br />
spending by<br />
locals<br />
spending by nonlocals<br />
average spending<br />
% non-local<br />
adjusted average<br />
spending<br />
Minnesota $14.37 $39.75 $25.45 41.6% $19.07 2.1<br />
Missouri $28.30 $34.91 $29.67 20.9% $29.52 1.2<br />
Texas $9.81 $45.20 $42.54 91.7% $16.37 2.8<br />
source: see appendix<br />
ratio: nonlocal<br />
to<br />
average<br />
Table A1 summarizes this information. From <strong>the</strong> adjusted averages, we calculate<br />
<strong>the</strong> average ratio of non-local visitor spending to average spending. The average<br />
ratio of non-local spending to average visitor spending across <strong>the</strong>se <strong>state</strong>s is 2.0.<br />
Next we review <strong>the</strong> estimates of average visitor spending for all six <strong>state</strong>s. We<br />
make adjustments to <strong>the</strong> reported average spending to make <strong>the</strong> dollar amounts<br />
more applicable to New York State. For Minnesota, Missouri, and Texas, we use<br />
<strong>the</strong> adjusted average visitor spending numbers from Table A1. For North Carolina<br />
8 We also reviewed estimates from Ohio and Michigan. However, <strong>the</strong>se studies did not report estimates<br />
of <strong>the</strong> number of visitors and focused only on total spending. Therefore, we did not include<br />
<strong>the</strong>m in our analysis since it would be difficult to make comparisons with <strong>the</strong> New York State <strong>park</strong>s.<br />
9 In addition, <strong>the</strong> Texas study also separates out spending by ‘casual’ visitors—those individuals who<br />
visited <strong>the</strong> <strong>park</strong>, but whose primary purpose for visiting <strong>the</strong> area was something different.<br />
THE NEW YORK STATE PARK SYSTEM: AN ECONOMIC ASSET TO THE EMPIRE STATE / PAGE 27
and Arizona, we know average spending by non-locals, but not <strong>the</strong> spending by locals<br />
or <strong>the</strong> composition of visitors. Therefore, we compute average visitor spending<br />
assuming that <strong>the</strong> ratio of non-local spending to average spending is 2.0 (as<br />
calculated above). For California, we have no additional information to make any<br />
adjustments. These figures are summarized in Table A2.<br />
TABLE A2. ESTIMATES OF AVERAGE SPENDING PER VISITOR, ADJUSTED<br />
TO MAKE THE ESTIMATES MORE APPLICABLE TO THE<br />
NEW YORK STATE ANALYSIS<br />
<strong>state</strong> year<br />
average<br />
spending<br />
(reported)<br />
adjusted<br />
average<br />
spending<br />
in 2007/8<br />
dollars<br />
California 2002 $30.51 $30.51 $35.84<br />
Missouri 2002 $29.67 $29.52 $34.67<br />
Texas 2006 $42.54 $16.37 $17.16<br />
North Carolina 2006 $23.56 $11.78 $12.35<br />
Arizona 2001 $50.28 $25.14 $29.99<br />
Minnesota 2001 $25.45 $19.07 $22.76<br />
Note: Average reported spending in Arizona and North Carolina reflects spending by<br />
non-local visitors only.<br />
The studies reviewed here were conducted in different years. Therefore, <strong>the</strong> average<br />
spending amounts need to be corrected for inflation. We <strong>the</strong>refore express<br />
each of <strong>the</strong> adjusted average spending amounts in 2007/2008 dollars, since we<br />
are using New York State visitor data from <strong>the</strong> 2007/8 season. The adjusted, inflation-corrected<br />
estimates of average spending range from $12.35 (North Carolina)<br />
to $35.84 (California). To avoid excessive influence from <strong>the</strong> maximum and<br />
minimum estimates, we drop <strong>the</strong> highest and lowest values. The adjusted average<br />
visitor expenditure from <strong>the</strong> remaining four <strong>state</strong>s ranges from $17 to $35 (rounding<br />
off <strong>the</strong> dollar figures). We use this range in <strong>the</strong> economic impact assessment<br />
detailed in <strong>the</strong> report. Note that this implies that average spending per non-local<br />
visitor would be between $34 and $70.<br />
Finally, we need to estimate <strong>the</strong> share of expenditures in each of six expenditure<br />
categories: groceries, eating out (restaurants/bars), recreational equipment, o<strong>the</strong>r<br />
shopping/retail, automobile/transport, and lodging. We focus only on <strong>the</strong> spending<br />
patterns of non-local visitors. We have estimates of <strong>the</strong> distribution of nonlocal<br />
visitor spending (divided into <strong>the</strong>se six categories) for four out of <strong>the</strong> six<br />
<strong>state</strong>s: Texas, North Carolina, Arizona, and Minnesota. Table A3 summarizes this<br />
information. We calculate <strong>the</strong> median share across <strong>the</strong> four <strong>state</strong>s and use this<br />
distribution of visitor spending in our estimates for New York.<br />
THE NEW YORK STATE PARK SYSTEM: AN ECONOMIC ASSET TO THE EMPIRE STATE / PAGE 28
TABLE A3. DISTRIBUTION OF NON- LOCAL VISITOR EXPENDITURES ACROSS SIX<br />
SPENDING CATEGORIES<br />
Texas North Carolina Arizona Minnesota median<br />
groceries 23% 12% --- 9% 12%<br />
eating out 17% 22% --- 25% 22%<br />
food total 40% 35% 32% 34% 34%<br />
recreation<br />
equipment 10% 9% --- 2% 9%<br />
o<strong>the</strong>r retail 12% 11% --- 14% 12%<br />
retail total 22% 20% 23% 15% 21%<br />
lodging 11% 27% 23% 35% 25%<br />
automobile 28% 19% 22% 15% 20%<br />
source: see appendix<br />
We can compare <strong>the</strong>se estimates to studies of visitors to National Parks, National<br />
Monuments, and National Historic Sites. <strong>Research</strong>ers at Michigan State University<br />
devised a <strong>system</strong> for estimating <strong>the</strong> economic impacts of National Parks Service<br />
(NPS) visitor spending. This <strong>system</strong> is called <strong>the</strong> “Money Generation Model”, version<br />
2, or just MGM2 (website: web4.canr.msu.edu/mgm2). The Money Generation<br />
Model was originally developed by Ken Hornback; Daniel Stynes and Dennis<br />
Propst updated <strong>the</strong> estimation technique and developed MGM2. The MGM2 database<br />
contains estimates of total visitor spending and total number of visitors to<br />
various NPS facilities.<br />
Based on <strong>the</strong> information in <strong>the</strong> MGM2 database, we calculated <strong>the</strong> median of<br />
average spending of visitors to NPS facilities in New York State in 2003. We <strong>the</strong>n<br />
expressed this median in 2007/8 dollars. Median visitor spending was $48.11<br />
across all <strong>the</strong> NPS sites in New York State. We performed a similar calculation for<br />
all NPS facilities in <strong>the</strong> New England <strong>state</strong>s. Median visitor spending, expressed in<br />
2007/8 dollars, across all NPS sites in New England was $65.76. Estimates of<br />
spending per visitor for National Parks typically are higher than average visitor<br />
spending for <strong>state</strong> <strong>park</strong> <strong>system</strong>s. This is because National Parks, on average, attract<br />
more non-local visitors who travel longer distances (and incur larger expenses)<br />
to visit <strong>the</strong> National Parks. The median per visitor expenditure figures for<br />
NPS site in New York and New England are certainly higher than <strong>the</strong> estimates obtained<br />
from our review of o<strong>the</strong>r <strong>state</strong> <strong>park</strong> studies. However, <strong>the</strong> expenditure figures<br />
for NPS sites in <strong>the</strong> nor<strong>the</strong>ast do fall within our range for non-local<br />
expenditures per visitor (between $34 and $70). This suggests that our estimates<br />
of non-local visitor expenditures are probably reasonable when compared to estimates<br />
applied to <strong>the</strong> National Parks.<br />
D. Economic Impact Assessments: Direct and Indirect Effects Only<br />
Tables A4 through A7 replicate <strong>the</strong> tables in <strong>the</strong> main text of <strong>the</strong> report that<br />
present <strong>the</strong> estimates of <strong>the</strong> economic impacts of government and visitor spending.<br />
However, Tables A4 through A7 only include <strong>the</strong> direct and indirect effects.<br />
THE NEW YORK STATE PARK SYSTEM: AN ECONOMIC ASSET TO THE EMPIRE STATE / PAGE 29
Induced effects are excluded from <strong>the</strong>se estimates. Table A4 corresponds to Table<br />
3, Table A5 to Table 4, Table A6 to Table 5, and Table A7 to Table 9.<br />
TABLE A4. ECONOMIC IMPACT OF STATE OPERATING<br />
EXPENDITURES FOR FISCAL YEAR 2008/9 ON REGIONAL<br />
AND STATE ECONOMIES, DIRECT AND INDIRECT EFFECTS ONLY<br />
employment<br />
# jobs<br />
output<br />
($ million)<br />
Allegany 203 $11.6 $4.7<br />
Capital/Saratoga 948 $64.8 $22.1<br />
Central 294 $18.6 $7.6<br />
Finger Lakes 274 $17.6 $7.6<br />
Genesee 186 $11.6 $4.7<br />
Long Island 1,212 $92.7 $37.6<br />
New York City 361 $24.4 $11.2<br />
Niagara Frontier 328 $32.3 $17.5<br />
Palisades 468 $34.4 $11.3<br />
Taconic 277 $21.3 $8.0<br />
Thousand Islands 227 $13.1 $3.9<br />
<strong>state</strong> 4,777 $342 $136<br />
source: see appendix<br />
employment<br />
income<br />
TABLE A5. ECONOMIC IMPACT OF STATE CAPITAL<br />
EXPENDITURES FOR FISCAL YEAR 2008/9 ON REGIONAL<br />
AND STATE ECONOMIES, DIRECT AND INDIRECT EFFECTS ONLY<br />
employment output<br />
employment<br />
income<br />
# jobs<br />
($ million)<br />
Allegany 62 $5.6 $1.7<br />
Capital/Saratoga 137 $14.4 $5.4<br />
Central 70 $7.2 $2.7<br />
Finger Lakes 52 $5.1 $1.8<br />
Genesee 57 $5.9 $2.1<br />
Long Island 213 $25.1 $10.7<br />
New York City 62 $6.6 $2.7<br />
Niagara Frontier 52 $6.5 $3.0<br />
Palisades 94 $9.8 $3.7<br />
Taconic 168 $19.1 $7.7<br />
Thousand Islands 76 $7.3 $2.6<br />
<strong>state</strong> 1,044 $113 $44<br />
source: see appendix<br />
THE NEW YORK STATE PARK SYSTEM: AN ECONOMIC ASSET TO THE EMPIRE STATE / PAGE 30
TABLE A6. ECONOMIC IMPACT OF TOTAL STATE EXPENDITURES<br />
FOR FISCAL YEAR 2008/9 ON REGIONAL AND STATE<br />
ECONOMIES, DIRECT AND INDIRECT EFFECTS ONLY<br />
employment<br />
# jobs<br />
output<br />
($ million)<br />
Allegany 264 $17.2 $6.4<br />
Capital/Saratoga 1,085 $79.1 $27.5<br />
Central 364 $25.9 $10.4<br />
Finger Lakes 326 $22.7 $9.5<br />
Genesee 243 $17.5 $6.8<br />
Long Island 1,426 $117.8 $48.3<br />
New York City 423 $31.1 $13.9<br />
Niagara Frontier 381 $38.9 $20.5<br />
Palisades 562 $44.2 $15.0<br />
Taconic 444 $40.4 $15.7<br />
Thousand Islands 303 $20.4 $6.5<br />
<strong>state</strong> 5,822 $455 $181<br />
source: see appendix<br />
employment<br />
income<br />
TABLE A7. ECONOMIC IMPACT OF ESTIMATED NON-LOCAL VISITOR<br />
EXPENDITURES ON REGIONAL AND STATE ECONOMIES, DIRECT AND<br />
INDIRECT EFFECTS ONLY (2007/8 SEASON)<br />
employment output employment income<br />
low high low high low high<br />
# jobs ($ million)<br />
Allegany 253 521 $14 $30 $5 $10<br />
Capital/Saratoga 738 1,518 $52 $108 $19 $38<br />
Central 523 1,077 $33 $69 $11 $24<br />
Finger Lakes 620 1,277 $39 $80 $14 $28<br />
Genesee 171 353 $12 $24 $4 $8<br />
Long Island 1,019 2,098 $83 $172 $29 $59<br />
New York City 95 195 $6 $12 $2 $4<br />
Niagara Frontier 1,838 3,784 $168 $346 $63 $131<br />
Palisades 184 378 $13 $27 $5 $9<br />
Taconic 199 410 $16 $34 $6 $12<br />
Thousand Islands 246 507 $15 $30 $5 $10<br />
<strong>state</strong> 5,885 12,117 $452 $931 $162 $334<br />
source: see appendix<br />
THE NEW YORK STATE PARK SYSTEM: AN ECONOMIC ASSET TO THE EMPIRE STATE / PAGE 31
REFERENCES<br />
Arizona Department of Commerce (2001). ‘Economic Impact of Arizona State Parks.’ Prepared<br />
by <strong>the</strong> Arizona Hospitality <strong>Research</strong> and Source Center, Nor<strong>the</strong>rn Arizona University, June 2009.<br />
California Department of Parks and Recreation, Marketing Division (2001). ‘Economic Impacts<br />
on Local Economies by Visitors to California State Parks from 1999 to 2002: An Update of <strong>the</strong><br />
1995 Analysis.” October 2001. (www.<strong>park</strong>s.ca.gov/pages/712/files/102501b2.pdf)<br />
Cole, Shu Tian, C. Randal Vessell, and Tao Zhu (2003). ‘2002 State Economic Impacts of Missouri<br />
State Park Visitors.’ Report submitted to <strong>the</strong> Missouri Department of Natural Resources,<br />
Division of State Parks, February 2003.<br />
Crompton, John L. and Juddson Culpepper (2006). ‘The Economic Contributions of Texas State<br />
Parks in Fiscal Year 2006.’ Report commissioned by <strong>the</strong> Texas Coalition for Conservation,<br />
Dec. 2006.<br />
Greenwood, Jerusha B. and Candace G. Vick (2008). ‘Economic Contribution of Visitors to Selected<br />
North Carolina State Parks.’ Report Prepared for <strong>the</strong> North Carolina Department of Environment<br />
and Natural Resources, Division of Parks and Recreation, May, 2008.<br />
Horowitz, Karen and Mark Planting. (2006). ‘Concepts and Methods of <strong>the</strong> Input-Output Accounts,’<br />
Bureau of Economic Analysis, Washington, DC, September.<br />
Leonard, Jerry (2008). ‘Wildlife Watching in <strong>the</strong> U.S.: The Economic Impacts on National and<br />
State Economies in 2006.’ U.S. Fish and Wildlife Service, Washington, DC.<br />
Mates, William J. and Reyes, Jorge L. (2004). ‘Economic Value of New Jersey State Parks and<br />
Forests.’ Report Prepared for <strong>the</strong> New Jersey Department of Environmental Protection, Division<br />
of Science, <strong>Research</strong>, and Technology.<br />
Minnesota Department of Natural Resources (2002). ‘Contributions of <strong>the</strong> Minnesota State<br />
Park System to State and Regional Economies’ (Office of Management and Budget Services),<br />
August 2002.<br />
Stynes, Daniel and Ya-Yen Sun (2005). ‘Impacts of Visitor Spending on <strong>the</strong> Local <strong>Economy</strong>:<br />
Fort Stanwix National Monument, 2003.’ National Park Service, Social Science Program and<br />
Michigan State University.<br />
Texas Comptroller of Public Accounts (2008). ‘Texas State Parks: Natural Economic Assets,’<br />
Austin, TX, September.<br />
THE NEW YORK STATE PARK SYSTEM: AN ECONOMIC ASSET TO THE EMPIRE STATE / PAGE 32