Lab 8 - Normal Distributions - SLC Home Page
Lab 8 - Normal Distributions - SLC Home Page
Lab 8 - Normal Distributions - SLC Home Page

Create successful ePaper yourself
Turn your PDF publications into a flip-book with our unique Google optimized e-Paper software.
QUANTITATIVE METHODS<br />
Martin Huard<br />
Winter 2005<br />
LAB 8<br />
<strong>Normal</strong> <strong>Distributions</strong><br />
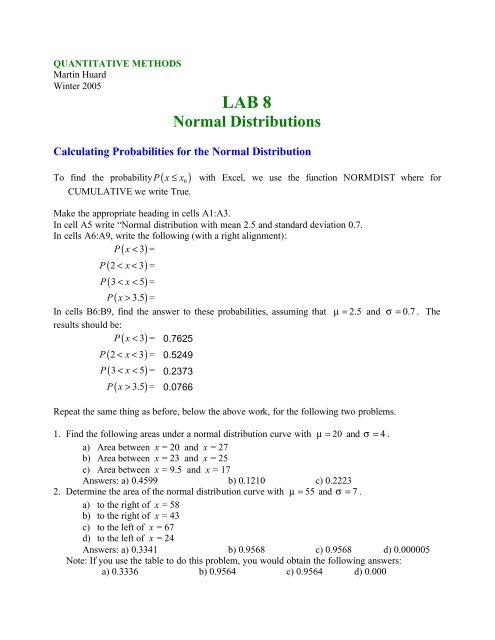
Calculating Probabilities for the <strong>Normal</strong> Distribution<br />
To find the probability P( x≤ x 0 ) with Excel, we use the function NORMDIST where for<br />
CUMULATIVE we write True.<br />
Make the appropriate heading in cells A1:A3.<br />
In cell A5 write “<strong>Normal</strong> distribution with mean 2.5 and standard deviation 0.7.<br />
In cells A6:A9, write the following (with a right alignment):<br />
P x< 3 =<br />
P<br />
P<br />
( )<br />
( 2< x< 3)<br />
=<br />
( 3< x< 5)<br />
=<br />
P( x> 3.5)<br />
=<br />
In cells B6:B9, find the answer to these probabilities, assuming that µ = 2.5 and σ = 0.7 . The<br />
results should be:<br />
P x< 3 = 0.7625<br />
P<br />
P<br />
( )<br />
( 2< x< 3)<br />
= 0.5249<br />
( 3< x< 5)<br />
= 0.2373<br />
P( x> 3.5)<br />
= 0.0766<br />
Repeat the same thing as before, below the above work, for the following two problems.<br />
1. Find the following areas under a normal distribution curve with µ = 20 and σ = 4 .<br />
a) Area between x = 20 and x = 27<br />
b) Area between x = 23 and x = 25<br />
c) Area between x = 9.5 and x = 17<br />
Answers: a) 0.4599 b) 0.1210 c) 0.2223<br />
2. Determine the area of the normal distribution curve with µ = 55 and σ = 7 .<br />
a) to the right of x = 58<br />
b) to the right of x = 43<br />
c) to the left of x = 67<br />
d) to the left of x = 24<br />
Answers: a) 0.3341 b) 0.9568 c) 0.9568 d) 0.000005<br />
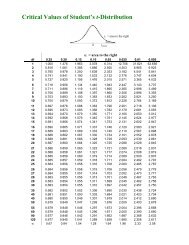
Note: If you use the table to do this problem, you would obtain the following answers:<br />
a) 0.3336 b) 0.9564 c) 0.9564 d) 0.000
QM<br />
<strong>Lab</strong> 8 – <strong>Normal</strong> <strong>Distributions</strong><br />
Finding the x value<br />
For this, we use the command NORMINV, where the probability P( x≤ x 0 ) is entered, that is, the<br />
area to the left of x<br />
0.<br />
Go to Sheet 2, rename it and give the appropriate headings.<br />
Answer the following questions in cells B6:B11<br />
Let x be a continuous random variable that follows a normal distribution with a mean of 200 and a<br />
standard deviation of 25.<br />
a) Find the value of x so that the area under the normal curve to the left of x is<br />
approximately 0.6330.<br />
b) Find the value of x so that the area under the normal curve to the right of x is<br />
approximately 0.05.<br />
c) Find the value of x so that the area under the normal curve to the right of x is<br />
approximately 0.8051.<br />
d) Find the value of x so that the area under the normal curve to the left of x is<br />
approximately 0.015.<br />
e) Find the value of x so that the area under the normal curve between µ and x is<br />
approximately 0.4525 and the value of x is smaller than µ .<br />
f) Find the value of x so that the area under the normal curve between µ and x is<br />
approximately 0.48 and the value of x is greater than µ .<br />
Answers: a) 208.50 b) 241.12 c) 178.50 d) 145.75 e) 158.26 f) 251.34<br />
Winter 2005 Martin Huard 2