Chapter 1 - Introduction - South East Natural Resources ...
Chapter 1 - Introduction - South East Natural Resources ...
Chapter 1 - Introduction - South East Natural Resources ...

You also want an ePaper? Increase the reach of your titles
YUMPU automatically turns print PDFs into web optimized ePapers that Google loves.
<strong>Introduction</strong><br />
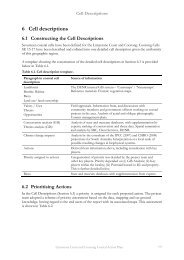
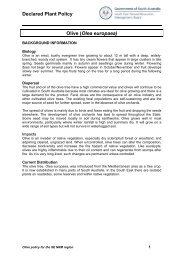
1.3 The Definition of Coastal Cells<br />
Seventeen coastal cells have been defined for the region on the basis of physical parameters:<br />
landform, coastal wind and wave energy levels, shown in the Base Maps included in Appendix 1.<br />
The cells define relatively small sub-regional scale landform units along the coast: for example a<br />
bay between headlands, a sand dune mass, or an area of low cliffs of common orientation, may<br />
be coastal cells. In Figure 1.2 above the boundary of cell SE11 with SE10 and SE12 is shown.<br />
The size of individual cells varies, but the average length of coastline of a cell is approximately 25<br />
kilometres. The cells provide units of workable scale, in terms of bringing together a large<br />
amount of data for an area small enough to discuss local management issues.<br />
These cells are used in the report for mapping and descriptive units, i.e. as the geographical units<br />
for which conservation priority, threats and actions are to be established. The cells are numbered<br />
SE1 Piccaninnie Ponds then sequentially north- west to SE17, Coorong - Murray Mouth.<br />
1.4 Methods Used<br />
The core of the methods used involves the assembly of data on conservation (32 sets) and threats<br />
(20 sets) within the defined coastal area. Within each set of data, values (from 0 to 9) are ascribed,<br />
with expert help, for presence or absence, frequency, or rareness. These values are placed on<br />
digital maps (or layers): each layer showing values from 0 to 9 for each pixel on the map; any one<br />
layer consisting of millions of such values set out on a fixed grid. Geographic Information<br />
Systems software was used to obtain statistics and summaries for the cell and the region;<br />
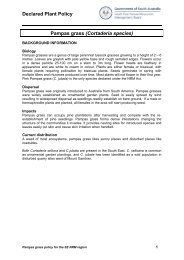
conservation or threat values can be summarised for each point on the map. For example, in<br />
Figure 1.3 below the conservation values are summarised for the Robe area. When this is<br />
compared with the threat values, spatial correlation is visually apparent.<br />
These methods depend on spatial layout and their value is most visually apparent at the local (or<br />
cell) scale. However statistics for the whole region can be derived from the analysis and used to<br />
focus on features of the whole regional map.<br />
The data is presented as a snapshot in time (although the most recent survey data is used, the<br />
dates vary); however, the most significant thing about many sets of data is change and the<br />
direction of change. Notably change in extent of habitat is critical for fauna. If there is repetition<br />
at a later date of this methodology for the region, then this will become apparent with each future<br />
iteration of the process. In this project, the local ‘cell descriptions’ are used to note local changes,<br />
where these can be identified and where they are a concern to the conservation of the natural<br />
assets of the region.<br />
Limestone Coast and Coorong Coastal Action Plan 15