Vanishing Actâ¦.. - Green Lake County
Vanishing Actâ¦.. - Green Lake County
Vanishing Actâ¦.. - Green Lake County

You also want an ePaper? Increase the reach of your titles
YUMPU automatically turns print PDFs into web optimized ePapers that Google loves.
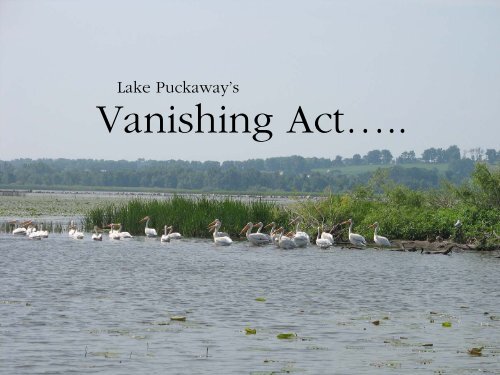
<strong>Lake</strong> Puckaway’s<br />
<strong>Vanishing</strong> Act…..
A lake of many cultures…..<br />
Supporting Families for<br />
Thousands of Years
“It is easy to lose one's way, especially as the River<br />
leading thither is so full of wild rice that it is difficult to<br />
find the Channel”<br />
Father Marquette (1673)<br />
1600 2009
The Expeditions of Zebulon Montgomery Pike<br />
(1805-1807) – “The lake is three leagues long (9<br />
miles), this is full of wild rice, and has a a great<br />
many fowl in their season.”
“Wau-bun” (1855)<br />
This lake has its name from the long flags or<br />
rushes which are found in its waters in great<br />
abundance, and of which the squaws<br />
manufacture the coarse matting used in<br />
covering their wigwams.<br />
Besides this, the wild rice abounds to such an extent in many places, that it almost<br />
completely obstructs the progress of even a moderate-sized boat, so that a passage<br />
through its tangled masses is with difficulty forced by the oars.<br />
1600 2009
Nee Pee Nauk Duck Hunting Club, whose diary tells of members around 1885:<br />
“Shooting lousy. We killed only 30 canvasback, 50 bluebill, 21 pintail, and 18 redhead.”<br />
“Fishing only fair. We caught 63 smallmouth and 66 pike.”<br />
1600 2009
“The boys were fed up with puddle<br />
ducks, and wanted to get into the diving<br />
game.” For these reasons the Caw-Caw<br />
Club moved to <strong>Lake</strong> Puckaway, which<br />
was found more suitable than Poygan,<br />
and most of its history was made on that<br />
famous celery lake.<br />
1869<br />
Not far north of<br />
Horicon…lies <strong>Lake</strong><br />
Puckaway, like<br />
Koshkonong, this<br />
was a famous “wild<br />
celery” lake.<br />
1600 2009<br />
“…fantastic bags of game were secured, and sadly<br />
it must be confessed that occasionally excess<br />
birds, impossible to keep in those pre-refrigeration<br />
days were buried under the hillside brush.”
In 1837 and 1839, the Corps examined the waterway's feasibility and<br />
recommended a “slack-water” (lock and dam) system. After numerous<br />
memorials from the territorial legislature, Congress authorized a land<br />
grant for the waterway project in 1846.
Goal of the Lock & Dam (1846):<br />
Link <strong>Green</strong> Bay to the Mississippi
Original Lock and Dam built around 1860 soon feel into disrepair
The Princeton Dam was built by the Army Corps of Engineers in 1897 in an effort to<br />
provide water deep enough for commercial freight steamers.
In 1922, War Department abandoned the Upper Fox River canal project<br />
planned to make the river navigable to barges between <strong>Green</strong> Bay and the<br />
Wisconsin River.
1941<br />
Wild rice emerged along the entire shoreline. It<br />
formed an almost impenetrable bed throughout<br />
the eastern basin, with only the navigation<br />
channel remaining open.<br />
1600 2009
By 1946, local residents noticed a significant decline in aquatic<br />
plants, and water quality was reduced
Historical Management<br />
• 1946 – Puckaway Restoration League<br />
attempts to improve declining emergent<br />
plants by planting hundreds of lbs of wild<br />
rice.<br />
• 1949 – Large expanses of open water<br />
start to develop.
Historical Management<br />
• 1951: “Only 2550 Acres” of Emergent<br />
Plants Remain, Nearly Half of previous<br />
decades<br />
• 1950-1951: Water levels are drawn down<br />
for 2 consecutive springs to improve plant<br />
growth.
“Should the openings<br />
continue to expand, the<br />
breakup of this marsh (<strong>Lake</strong><br />
Puckaway) can be expected<br />
with conditions similar to<br />
Beaver Dam <strong>Lake</strong> and <strong>Lake</strong><br />
Koshkonong appearing.<br />
Intensive prosecution of the<br />
carp and careful regulation of<br />
water levels is necessary to<br />
avoid such a<br />
development…Largely<br />
because of high water the<br />
carp are able to invade the<br />
shallows which had the best<br />
stands of wild rice and<br />
arrowhead. Both are now<br />
scarce in former areas of<br />
abundance. To maintain the<br />
marsh ecology of <strong>Lake</strong><br />
Puckaway a decrease in the<br />
water level of 6 inches to 1<br />
foot from what it was on<br />
August 11, 1952 is justified.”<br />
(Thompson 1959)
Historical Accounts<br />
• “Wild rice has “precipitously declined”<br />
since 1880, whereas is is no longer a<br />
dominant species.” - 1959<br />
• “Once famous fish and waterfowl haven<br />
into a dead mud puddle” - 1959
1977<br />
o Almost no submergent plants were present in the muddy waters.<br />
o Carp comprised of 76% of the fishery.<br />
o Secchi disc measurements in August were 6 inches.<br />
o <strong>Lake</strong> Puckaway Protection & Rehabilitation District (LPPRD) forms<br />
1600 2009
WI DNR worked with LPPRD and LPIA to develop a management plan.<br />
The 1978 Three-phase plan:<br />
Partial drawdown of the lake<br />
Mechanical removal of carp<br />
Restocking of game fish species.
Historical Management<br />
• 1983-1984: Plant restoration project<br />
planted wild rice, wild celery, sago<br />
pondweed.<br />
• 1991 Fishery Study Shows change in<br />
fisheries.
Prior to 1977 <strong>Lake</strong> Plan Implementation 1991
GOAL:<br />
Maintain and Improve Water Quality, Sport Fishing, and a Natural<br />
and Serene Environment that is enjoyed by many Families of <strong>Lake</strong><br />
Residents and Visitors for years into the future.
1. Why do we care about reduction in emergent beds?<br />
2. How do we measure it?<br />
3. What is causing the reduction?<br />
4. How do we manage it?
1. Why do we care about reduction in emergent beds?
A diverse emergent plant community is important to lakes –<br />
Especially in shallow, littoral dominated system, such as Puckaway
A lake without plants is like a forest<br />
without trees…..
Endangered Species, such as the Foster’s Tern, is found on <strong>Lake</strong><br />
Puckaway, and uses dead emergent vegetation to nest on.
2. How do we measure it?
<strong>Lake</strong>s and Vegetation vary year to year depending on<br />
weather patterns…..But….What is the TREND over time?
1946
August 23rd 1941
September 23rd 1950
June 25th 1964
Algae<br />
Bloom<br />
September 7 th 1971
2005<br />
2006
2005<br />
Increased Vegetation Growth Noticed<br />
throughout the <strong>Lake</strong><br />
2006
May<br />
2006<br />
2005<br />
2004<br />
2003<br />
Fox Rvier Discharge at Berlin in May (cfs)<br />
10 years > or @<br />
10% of average<br />
20-Yr AVG<br />
2002<br />
2001<br />
2000<br />
1999<br />
1998<br />
1997<br />
1996<br />
1995<br />
1994<br />
1993<br />
1992<br />
1991<br />
1990<br />
1989<br />
1988<br />
1987<br />
1986<br />
1985<br />
1984<br />
1983<br />
1982<br />
1981<br />
1980<br />
3,500<br />
3,000<br />
2,500<br />
2,000<br />
1,500<br />
1,000<br />
500<br />
0<br />
Last significant low flow<br />
20 years ago
1989<br />
2005<br />
1999<br />
2006
1950<br />
1989 1999
1989<br />
1999<br />
2005<br />
2006
1986<br />
2005
How do we Quantify the rate and amount of loss?
Macro-Scale Analysis:<br />
Use photo analysis to compare<br />
mid-summer emergent & floating<br />
leaf growth<br />
1989-2009<br />
Federal Agricultural Program<br />
Photography<br />
(mid-summer flights)
•Scanned and GeoReferenced 7000 Aerial Images<br />
•Created a Composite Image for Each Year<br />
•Used Mapping Software to define each visible plant bed<br />
•Software measures exact acreage of the plant beds<br />
Approx. 651 acres<br />
1989 Photographic<br />
Analysis of visible<br />
emergent and/or floating<br />
leaf aquatic plant beds
1986<br />
695 Acres<br />
1989<br />
651 Acres 6% Decrease<br />
over 3 years<br />
(2% per year)
1989<br />
651 Acres<br />
1999<br />
483 Acres >25% Decrease<br />
over 10 years<br />
(2.5% per year)
2005<br />
2006
Almost 2000 acres of loss over<br />
60 years – that is over 3<br />
square miles!
Micro-Scale Analysis:<br />
Establish set sample<br />
points throughout the lake<br />
and conduct a plant<br />
survey annually at the<br />
same location.<br />
Use GPS to delineate<br />
edge of emergent plant<br />
beds for comparison over<br />
time.<br />
Begin monitoring in 2010.
3. What causing the reduction?
Sensitive to Water levels<br />
<strong>Green</strong> = Normal Red = Flooding Yellow = Drought Brown = Extended Drought<br />
(WI DNR Upper Fox Basin)
Carp<br />
Algae Blooms<br />
High Water<br />
Plant Stressors<br />
Turbidity<br />
Wave Action
High Water Effects on Plants<br />
• Decreased Light Penetration<br />
• Increased Turbidity from Wave Action<br />
• Increased Algae Blooms<br />
• Higher Energy Needs to Reach Surface<br />
• Increased Wave Force<br />
• Prop Damage from More Boat Access
Shift in Fish<br />
Population???<br />
Minnow/Aquatic<br />
Insect Eating Fish<br />
Sight Feeding<br />
Predator Fish<br />
Prey – Aquatic Insects,<br />
Littoral<br />
Filter/Benthic<br />
Feeding Fish<br />
Cause or Symptom???<br />
Prey –<br />
Zooplankton, Free<br />
Floating/Benthic
Prior to 1977 <strong>Lake</strong> Plan Implementation 1991
•Algae prevents light front reaching<br />
bottom.<br />
•Decreasing water depth allows<br />
sunlight to reach bottom<br />
•Rooted plants become<br />
established<br />
•Rooted plants utilize<br />
phosphorus<br />
•Reduced phosphorus results<br />
in less algal blooms<br />
•Reduced algal blooms<br />
results in clearer water<br />
•Clearer water allows more<br />
sunlight to reach the bottom<br />
for rooted plants
Water Level Changes<br />
Fish, Habitat, & Recreation<br />
25<br />
Fish Spawning Period<br />
20<br />
N. PIKE<br />
WAL.E<br />
YEL. P<br />
Bass &<br />
Panfish<br />
Frogs &<br />
Turtles<br />
Burrow to<br />
Hibernate<br />
Relative Water Level<br />
15<br />
10<br />
Submergent<br />
Plants<br />
Establish<br />
Emergent Plants Establish &<br />
Maintain<br />
Recreational Navigation Season<br />
Duck Hunt<br />
5<br />
Memorial Day<br />
July 4<br />
Labor Day<br />
0<br />
Spring Summer Fall<br />
Jan Feb Mar Apr May Jun Jul Aug Sep Oct Nov Dec<br />
Jan Feb Mar Apr May Jun Jul Aug Sep Oct Nov Dec<br />
Current Natural<br />
(WI DNR/UWEX Upper Fox Basin)
Resiliency:<br />
a:capable of withstanding shock without<br />
permanent deformation or rupture<br />
b:tending to recover from or adjust easily to<br />
misfortune or change<br />
Not to be confused with:<br />
Resistant:<br />
a:impervious to being affected<br />
b:resistant to change
Unstable <strong>Lake</strong> Conditions?
Established Plant Bed<br />
Established Lawn<br />
“Resilience” allows them to “bounce-back”<br />
from flooding/drought/abuse
Established Plant Bed<br />
Established Lawn<br />
Continual Abuse/Neglect will eliminate desired<br />
plants.
Establishing new plant beds require special<br />
conditions/care, not unlike establishing a new<br />
lawn………
Newly Established Plant Bed<br />
Newly Established Lawn<br />
Proper Seed Bed –<br />
Firm/Consolidated<br />
Proper Seed Bed<br />
Erosion Control –<br />
Low Wave<br />
Action/Suspended<br />
Sediment<br />
Erosion Control<br />
Appropriate Water<br />
Appropriate Water<br />
– Moist or Shallow<br />
Conducted at<br />
Proper Time of<br />
Year
Moving Forward by Looking<br />
Back…<br />
Establish a Baseline Trend with<br />
Historical Data<br />
Set Objectives<br />
Establish Strategy to achieve<br />
Objectives<br />
Continuously Monitor and Adjust<br />
Strategy<br />
Set/Change Strategy<br />
based on Monitoring<br />
Implement Strategy<br />
Monitor Effects
Adaptive Management<br />
approach that incorporates the<br />
results of a new monitoring<br />
program into management<br />
action in order to adapt and<br />
learn over time.
4 Variables of Water Level<br />
Fluctuations<br />
Timing (Season)<br />
Magnitude (How Much?)<br />
Duration (How Long?)<br />
Frequency
Stabilized Water Levels effect plant establishment<br />
Water level management has become a very effective<br />
and widely recommended practice over the past decade<br />
to reestablish aquatic plant beds which have been<br />
diminished by continue stress and abuse.
Management Activities<br />
• Historical Photo Analysis<br />
• Increase carp removal<br />
• Dredgebank Enhancement<br />
• Carp Exclosures monitoring plots<br />
• Aquatic Plant Monitoring<br />
• AIS Monitoring<br />
• Water Level Monitoring<br />
• Shoreland Restoration<br />
• Boater Education (maps, kiosk, etc)<br />
• Cormorant Control<br />
• Water Level Manipulation<br />
• Fisheries Study<br />
• Watershed Management (Runoff Control Projects, NMP,<br />
etc)<br />
• Historical Data Collection
Take Home Message….<br />
Modified water levels are a lake<br />
stressor that needs to be<br />
managed.<br />
(i.e. <strong>Lake</strong>s with artificially manipulated water levels need to<br />
be properly managed to meet the needs of the lake to<br />
prevent degradation over time.)
Questions?