VAM End of Year Information PowerPoint
VAM End of Year Information PowerPoint
VAM End of Year Information PowerPoint

Create successful ePaper yourself
Turn your PDF publications into a flip-book with our unique Google optimized e-Paper software.
June 27, 2013
• Provide an overview <strong>of</strong> the Compass tool’s<br />
multiple measures <strong>of</strong> student growth.<br />
• Describe how value-added data is generated<br />
and how it contributes to Compass ratings<br />
• Identify supports available to help educators<br />
access and understand value-added data.
Measures <strong>of</strong> Student<br />
Outcomes<br />
•Student Learning Targets<br />
(SLT)<br />
•Valued-added Measures<br />
(<strong>VAM</strong>), where available.<br />
Measures <strong>of</strong><br />
Pr<strong>of</strong>essional Practice<br />
•Evidence and ratings<br />
from classroom<br />
observations and<br />
walkthroughs<br />
• These measures work together to help leaders<br />
determine teachers’ annual compass rating.
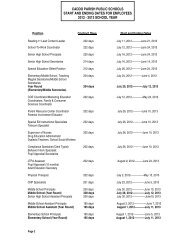
TIMELINE<br />
June 27 --<strong>VAM</strong> data available<br />
on CIS<br />
July 16 --Teachers should be<br />
able to view final ratings.<br />
July 25 – Phone/in person<br />
conferences finished and<br />
documents electronically/<br />
personally signed<br />
DISTRICT CONTACTS<br />
• Charles Lowder, Jimmy<br />
Kennedy, Pateece Davis-<br />
Hardy, Kathy Gallant<br />
• Technical questions (e.g.,<br />
questions about the way in<br />
which a score was<br />
calculated) should be sent<br />
to compass@la.gov<br />
NOTE: CIS will be unavailable from July 5 th – 8 th
The value-added model provides information about the extent to which students met, exceeded, or fell short<br />
<strong>of</strong> their expected performance on state tests, based upon the student’s past achievement history and<br />
individual characteristics.<br />
Value-added calculations start with an expected score that is based on each student’s unique characteristics.<br />
Student Factors<br />
Impact on Student’s Expected Score<br />
Prior year math score = 290 Expected score = 320<br />
The average score this year for students who scored a 290 on the prior<br />
year’s math test is 320<br />
Student attendance:<br />
10 absences<br />
Number <strong>of</strong> suspensions = 1<br />
- 5 points from expected score<br />
The average impact <strong>of</strong> 10 absences on a student’s math score is -5 points<br />
(1/2 point per absence)<br />
- 15 points from expected score<br />
The average impact <strong>of</strong> one suspension on a student’s math scores is -15<br />
points<br />
…a similar calculation is completed for each <strong>of</strong> the student factors that <strong>VAM</strong> addresses*…<br />
Student’s final expected score 320 – 5 – 15 = 300<br />
Note that additional student factors are considered, not just the three<br />
examples listed here.
At the end <strong>of</strong> the year, each student’s expected score is compared to her actual score:<br />
Student Expected Score Actual Score Difference<br />
Student A 300 310 +10<br />
Student B 360 360 0<br />
Student C 440 445 +5<br />
Average +5<br />
The difference between student’s expected and actual scores are averaged to provide<br />
each teacher with a value-added score.<br />
This teacher would earn a value added score <strong>of</strong> +5, in the 55 th percentile,<br />
Effective: Pr<strong>of</strong>icient.<br />
This score tells us that, on average, this teacher’s students scored five points higher<br />
than would be expected. In this example, a +5 score maps to the 55 th percentile. This<br />
means that the teacher’s score is higher than 55% <strong>of</strong> teachers in the state. The 55 th<br />
percentile is in the Effective: Pr<strong>of</strong>icient range.
• Student-level scores and information: Individual<br />
results for each student, including expected and actual<br />
scores, and student characteristics taken into account.<br />
• Value-added scores: The average difference between<br />
the scores students were expected to achieve and<br />
their actual scores in a given content area.<br />
• Value-added percentile: The percentage <strong>of</strong> teachers<br />
who received a lower score than the teacher for whom<br />
the report was generated, in the same content area.<br />
• Compass effectiveness level: The effectiveness level<br />
(e.g., Effective: Pr<strong>of</strong>icient) corresponding to a teacher’s<br />
percentile ranking.
Actual Score: The score<br />
a student actually<br />
received for the current<br />
academic year.<br />
Expected Score: Report<br />
will show the student’<br />
expected score for the<br />
current academic year.<br />
Student Characteristics: Report<br />
will show many <strong>of</strong> the student<br />
charact3ristics taken into<br />
account when generating the<br />
expected score.
Teachers with value-added data will receive a Compass effectiveness rating based<br />
on their percentile ranking.<br />
1st – 10th percentiles Ineffective (1.00)<br />
11th-20th percentiles Effective: Emerging (2.00)<br />
21st-79th percentiles Effective Range<br />
80th-99th percentiles Highly Effective (4.00)<br />
•Teachers between the 20th<br />
and 80th percentiles will not<br />
automatically be assigned a<br />
student growth rating.<br />
•Instead, evaluators will assign<br />
a rating <strong>of</strong> Effective: Emerging<br />
(2.00) or Effective: Pr<strong>of</strong>icient<br />
(3.00) based on a review <strong>of</strong><br />
value-added and student<br />
learning target data.<br />
•Guidance for evaluators on<br />
assigning ratings is available<br />
here
Additional <strong>Information</strong>:<br />
• Frequently Asked Questions about Value-Added<br />
• Value-Added Overview<br />
• Compass <strong>End</strong>-<strong>of</strong>-<strong>Year</strong> Guide