Transport Strategy - Transport Modelling Templates by David Ashley
Transport Strategy - Transport Modelling Templates by David Ashley
Transport Strategy - Transport Modelling Templates by David Ashley

Create successful ePaper yourself
Turn your PDF publications into a flip-book with our unique Google optimized e-Paper software.
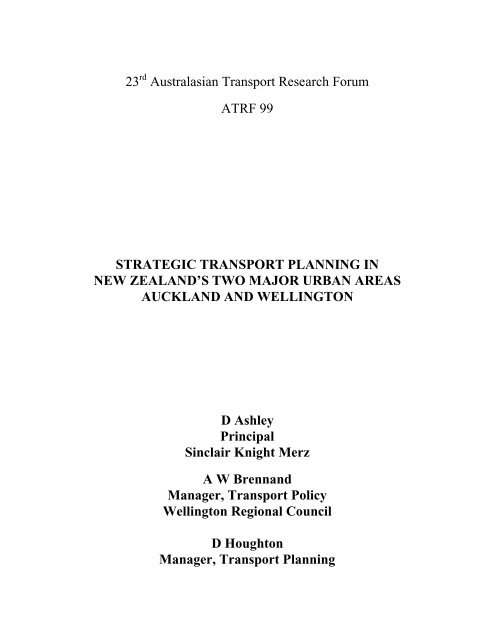
23 rd Australasian <strong>Transport</strong> Research Forum<br />
ATRF 99<br />
STRATEGIC TRANSPORT PLANNING IN<br />
NEW ZEALAND’S TWO MAJOR URBAN AREAS<br />
AUCKLAND AND WELLINGTON<br />
D <strong>Ashley</strong><br />
Principal<br />
Sinclair Knight Merz<br />
A W Brennand<br />
Manager, <strong>Transport</strong> Policy<br />
Wellington Regional Council<br />
D Houghton<br />
Manager, <strong>Transport</strong> Planning
<strong>Ashley</strong>, Brennand, Houghton<br />
Auckland Regional Council
Strat. Trans. Planning in NZ’s Two Major Urban Areas – Auck and Wgtn<br />
It would be really helpful to have a number of maps/figures (see text).<br />
Introduction<br />
This paper outlines the processes recently used in developing integrated transport<br />
strategies for two of New Zealand’s major urban areas - Auckland and Wellington -<br />
and describes the resulting strategies.<br />
<strong>Transport</strong> strategies for Oceanic cities which are technically well-founded and<br />
influential are rare. In New Zealand, there is a move to change this situation and our<br />
purpose in this paper is to illustrate a successful process of strategy development and,<br />
<strong>by</strong> contrasting its results in two rather different contexts, provide some information on<br />
its potential value.<br />
The paper starts with some background to transport planning in New Zealand and to the<br />
cities themselves, then discusses the process of strategy development applied in<br />
Auckland and Wellington, and its findings. Finally we offer some overall conclusions<br />
on the value of the process and its outcomes.<br />
The Regional Land <strong>Transport</strong> <strong>Strategy</strong><br />
In New Zealand the Land <strong>Transport</strong> Act 1 sets out a hierarchical planning process<br />
involving, among other matters, a National Land <strong>Transport</strong> <strong>Strategy</strong>, Regional Land<br />
<strong>Transport</strong> Strategies 2 and individual transport infrastructure projects. It is required that<br />
transport infrastructure projects must be ‘not inconsistent with’ the Regional Land<br />
<strong>Transport</strong> <strong>Strategy</strong>, and this in turn is required to be ‘not inconsistent with’ the National<br />
Land <strong>Transport</strong> <strong>Strategy</strong>. In practice, only recently has a national transport strategy<br />
been issued in draft form, and regional transport strategies have commonly been so<br />
vague as to exert little constraint on transport scheme promoters. There is nothing<br />
unusual about this position, but both Auckland and Wellington Regional Councils and<br />
the transport funding agency Transfund New Zealand wished to see the regional<br />
transport strategies much strengthened in the current round of updates.<br />
Thus the Regional Land <strong>Transport</strong> <strong>Strategy</strong> is intended to establish the framework for<br />
the development of the region’s transport system. The legislation requires it to:<br />
(a)<br />
(b)<br />
(c)<br />
identify the future land transport needs of the regions;<br />
identify the most desirable means of responding to such needs in a safe and cost<br />
effective manner, having regard to the effect the transport system is likely to<br />
have on the environment;<br />
identify an appropriate role for each land transport mode in the region …<br />
including freight traffic, public passenger transport, cycling and pedestrian<br />
traffic;<br />
1 The term ‘land transport’ is used to refer to public and private transport modes in New Zealand.<br />
2 Covering city regions, such as Auckland and Wellington, and rural regions.
<strong>Ashley</strong>, Brennand, Houghton<br />
(d)<br />
state the best means of achieving the objectives referred to in paragraphs (b) and<br />
(c)”<br />
Because the process described herein is strategic rather than detailed and because there<br />
exist detailed procedures for evaluating individual transport infrastructure projects in<br />
New Zealand, the transport strategy is generally expressed in terms of the corridor in<br />
which a transport improvement is envisaged and the general nature or capacity of the<br />
improvements. It is intended that the subsequent detailed studies would identify the<br />
optimal infrastructure project.<br />
The City Regions<br />
Auckland<br />
The Auckland region is situated towards the northern end of New Zealand’s North<br />
Island. The region’s population was 1.1 million in 1996 with x of these located in the<br />
urban part of the region; 29% of New Zealand’s population now resides in the<br />
Auckland region. Over the previous 5 years, Auckland’s average population growth<br />
was 17% [Don, please check this statistic], such that Auckland absorbed over half of<br />
New Zealand’s growth in this period. Substantial further growth is anticipated,<br />
projections of Auckland’s population in 2021 ranging from 1.4 to 1.6 million,<br />
corresponding to growth of between 27% and 45% over 1996.<br />
Employment in the Auckland region was 440,000 3 in 1996, of which a mere 11% was<br />
located in the CBD (down from 13% in 1991 and 15% in 1986). Main employment<br />
sectors in 1996 were Trade/Hospitality (26%), Manufacturing (21%), Community<br />
Services (21%) and Business Services (16%). The Auckland region is home to 38% of<br />
New Zealand’s business enterprises. 75% of New Zealand’s imports and 42% of<br />
export <strong>by</strong> value come through Auckland’s ports and airports.<br />
Auckland has developed around two harbours, the Waitemata and the Manukau, which<br />
together with their estuaries define a central isthmus containing the CBD and port<br />
(Figure 1). The central isthmus is the historic core of the region and still contains 34%<br />
of the region’s urban population and 53% of its urban jobs. Development of the region<br />
over time has resulted in 29% of the population now living to the south of the central<br />
isthmus, 20% to the north and 16% to the west; population densities are relatively low.<br />
Travel between the central isthmus and the north, west and south is constrained <strong>by</strong> the<br />
harbours, particularly in the case of the northern sector which is joined to the main<br />
urban area <strong>by</strong> a single 8 lane bridge, the Auckland Harbour Bridge. Rail corridors exist<br />
from the CBD to the west and to the south but the rail lines terminate 1 km from the<br />
centre of the CBD in an unprepossessing ‘central’ station, and this has limited their<br />
attractiveness to passengers (rail accounts for an insignificant proportion of travel in the<br />
region, most public transport journeys being <strong>by</strong> bus). A six lane motorway traverses<br />
3 Full time equivalent.
Strat. Trans. Planning in NZ’s Two Major Urban Areas – Auck and Wgtn<br />
the region from north to south, touching the edge of the CBD, and another six lane<br />
motorway connects the CBD and the North-South motorway with the west. <strong>Transport</strong><br />
studies in the 1960’s established a series of road corridors which allowed the<br />
construction of the motorway and major arterial system, but there is now only very<br />
limited ability to construct more road capacity in these corridors, particularly through<br />
the central isthmus.<br />
The Northern, Southern and North Western motorways not only form the major<br />
connections between the geographical sectors, but also form the main road connections<br />
to the CBD. The central parts of the motorway system have been at capacity for some<br />
years with extensive delays in the morning and evening peaks, and are now also<br />
approaching capacity in the interpeak.<br />
It follows that the main issues for the Auckland regional transport strategy related to<br />
urban form, the role of passenger transport, north-south accessibility and the harbour<br />
crossing, and road pricing.<br />
Urban Form<br />
The Auckland region has been going through a period of rapid growth and it has<br />
become apparent that the expected future growth cannot be accommodated within the<br />
planned urban area at current development densities. Nor can the expected growth be<br />
accommodated without considerable infrastructure investment - the capacity of water<br />
supply and sewage treatment plants for example need to be significantly increased, as<br />
does the transport system. There is strong community feeling that the spread of urban<br />
development into the rural areas, particularly the environmentally sensitive coastal<br />
areas to the north and east, and the native bush areas to the west, must be halted, or at<br />
least slowed dramatically. Car ownership is very high (1.55 cars/household in 1996)<br />
and reliance on the car is seen as a prime driver of sprawl (the average length of the<br />
journey to work increased <strong>by</strong> 40% between 1986 and 1996). High quality passenger<br />
transport systems, particularly rail, are seen as a catalyst to more intense, mixed use<br />
development that would enable much of the expected growth to be absorbed into the<br />
existing urban area, while also reducing the need for car use.<br />
The local authorities of the region have joined together to address these issues and have<br />
prepared a Growth <strong>Strategy</strong> for the region, with a theme of increased development<br />
around selected nodes and corridors, particularly around the rail lines. The Growth<br />
<strong>Strategy</strong> is currently progressing through a pubic consultation phase.<br />
Role of Passenger <strong>Transport</strong><br />
Closely allied with concerns over urban form are concerns that over reliance on cars is<br />
a leading cause of congestion. Journey to work mode share across the region for car<br />
use has grown from 63% in 1986 to 70% in 1996, with passenger transport mode share<br />
dropping from 12% to 6% in the same period. Rail mode share is now 1%. There is a<br />
strongly held view in the community that if passenger transport is improved, its mode<br />
share will increase and congestion will be relieved. Central to this issue is a long<br />
standing proposal to extend passenger rail to the heart of the CBD and significantly
<strong>Ashley</strong>, Brennand, Houghton<br />
upgrade rail stations, services and rolling stock (possibly to LRT). The rail company<br />
however is now privately owned and is primarily a freight business. It is proving<br />
difficult to reach a satisfactory commercial arrangement with the rail company for<br />
upgrading passenger services.<br />
North-South Accessibility<br />
The main north-south transport corridor comprises the Northern and Southern<br />
Motorways which converge on a single crossing of the Waitemata Harbour - the<br />
Auckland Harbour Bridge. This was constructed as a four lane facility in 1959 and<br />
extended to 8 lanes in 1969. It has been operating in excess of capacity in the morning<br />
peak hour for more than ten years. The road approaches to the Bridge, particularly on<br />
the southern side, are also at capacity with no likely prospects of significant<br />
improvement through a heavily urbanised area and involving a number of major<br />
engineering structures. This heavily congested central spine to the road system affects<br />
the motorway feeders so that cross-town as well as north-south traffic is caught in the<br />
congestion. Providing more road capacity is not simply a matter of finding a new<br />
location for a bridge or tunnel across the Waitemata Harbour, but of developing a new<br />
north-south route from a point north of the harbour to a point about 11 km south of the<br />
harbour. There are no obviously buildable routes, with the candidates all being either<br />
very environmentally damaging, very disruptive to local communities, very expensive,<br />
or all three.<br />
Road Pricing<br />
Numerous international studies, as well as studies of the Auckland transport system<br />
have shown that congestion pricing has the potential to be a very powerful demand<br />
management and funding tool. The New Zealand Government has been working<br />
towards restructuring the road sector in a way which would enable road pricing to be<br />
introduced as a practicable option in future. Public understanding and acceptance of<br />
road pricing however is very low and there are numerous practical and political<br />
challenges to overcome before it can be a major contributor to improved transport.<br />
Wellington<br />
The Wellington region is situated at the southern end of New Zealand’s North Island.<br />
Its 1996 population was 414,000 with most (373,000) located in the urban part of the<br />
region. The dominant population centre is Wellington city, the nation’s capital which<br />
has a population of 158,000. Population growth over the previous 5 years was small<br />
(0.7% per annum), while projections show steady, low growth in the region up to the<br />
year 2001 of 0.9% per annum, and modest growth thereafter. The limited growth is<br />
however expected to be focused in the Wellington City to Kapiti Coast corridor (Figure<br />
2).<br />
The urban part of the region provides employment for 168,000 4 . The dominant<br />
employment centre is Wellington city which employs 102,000 (full time equivalents) of<br />
which 68,900 are located in the central business district - this is more than 40% of the<br />
4 Full time equivalent.
Strat. Trans. Planning in NZ’s Two Major Urban Areas – Auck and Wgtn<br />
regional total, the central city focus contrasting strongly with the very much more<br />
dispersed employment patterns in Auckland. The regional economy is dominated <strong>by</strong><br />
the service sector, accounting for 80% of output, much of which is located in the<br />
Wellington central business district.<br />
Two primary transport corridors provide access to Wellington City, its central business<br />
district, regional airport and port. Both the northern and northeastern corridor (Figure<br />
2) provide highway and rail access. The difficult topography of the region creates<br />
barriers that constrain the locations and capacities of major transport corridors and<br />
limits the ability to expand highway capacity. At peak times, there are numerous<br />
bottlenecks in each corridor.<br />
According to the 1996 Census Journey to Work, almost 30% of commuters used public<br />
transport to access employment in the CBD, whereas for commuting to the central<br />
areas of outlying suburbs the public transport share was less than 10%.<br />
In Wellington the following issues for the transport strategy have been identified<br />
through analysis and stakeholder consultation.<br />
Funding<br />
Funding is constrained. Based on historic expenditure, it is estimated that $900 million<br />
will be available over 20 years to fund capital projects and public transport subsidies.<br />
Yet, there is a list of over $2.0 billion worth of capital projects and public transport<br />
subsidies average $27 million per annum.<br />
Economic Activity and Accessibility<br />
There is great concern about the region’s future economic prospects and the role of<br />
transportation in assisting those prospects <strong>by</strong> providing a competitive advantage.<br />
Particular issues include forestry access, access <strong>by</strong> freight vehicles to the Port of<br />
Wellington, the airport and other regional destinations and access to the major<br />
employment centres.<br />
Road Construction and Traffic Capacity<br />
The region’s difficult topography and generally poor geotechnical conditions makes<br />
major road construction difficult and expensive. The existing state highway corridors<br />
are generally constrained and expansion will have severe impacts on the surrounding<br />
environment.<br />
The Wellington CBD has a limited capacity to provide further car parking. Recent land<br />
developments have reduced parking spaces, a trend which is expected to continue.<br />
Demand for Travel<br />
There is a growing demand for travel in the Wellington-Kapiti corridor but, otherwise,<br />
such traffic growth as there is tends to be confined to off-peak times. The major road<br />
corridors leading into the Wellington CBD experience significant congestion at peak<br />
times and there is evidence that peak periods are lengthening. However, these corridors
<strong>Ashley</strong>, Brennand, Houghton<br />
generally have good public passenger transport alternatives whose peak period<br />
patronage is growing rapidly.<br />
Environmental and Traffic Impacts<br />
There is a high level of awareness about the environmental impacts of transport<br />
systems. Lob<strong>by</strong> groups are actively seeking to minimise the emission of greenhouse<br />
gases. Recent air quality monitoring has confirmed that in specific locations CO<br />
emissions are exceeding or close to international health standards. This is regarded as a<br />
site specific issue.<br />
Local communities have voiced strong objections to further road improvements in some<br />
parts of the region.<br />
Land Use<br />
It is desired that land use planning to be integrated with transport planning to, in the<br />
long term, enhance the efficiency of the strategic transport system.<br />
Safety<br />
There is a general desire to see the improvement of the transport system in safety terms.<br />
The <strong>Transport</strong> <strong>Strategy</strong> Development Process<br />
The process used to develop the transport strategy was the same it both cities. It had<br />
three main features:<br />
<br />
<br />
<br />
establishing the outcomes that are sought for the urban area - typically these are<br />
defined in an overall vision for the area, which is translated into a set of high level<br />
goals and these are in turn specified using a set of more detailed objectives;<br />
establishing technical procedures for evaluating alternative strategies against the<br />
desired outcomes, involving the development of a transport model and the design of<br />
strategy performance indicators;<br />
a workshop-based process for analysing and designing the strategies,<br />
and each of these is described below.<br />
Vision, Goals and Objectives<br />
The overall vision and goals for each city were set <strong>by</strong> officers and politicians in<br />
Auckland and Wellington:<br />
Auckland<br />
Vision: a safe, efficient and environmentally sustainable transport system for<br />
the Auckland Region which meets the community’s accessibility needs at<br />
reasonable cost.
Strat. Trans. Planning in NZ’s Two Major Urban Areas – Auck and Wgtn<br />
Goals: covering land use, accessibility, efficiency, the environment and safety.<br />
Wellington<br />
Vision: a sustainable land transport system that meets the needs of the Regional<br />
Community.<br />
Goals: covering accessibility, safety, economic efficiency, affordability and<br />
sustainability.<br />
Unsurprisingly, given the need for consistency with national policy and strategy, the<br />
vision and goals are similar. The objectives specify each goal in more detail For<br />
example, Auckland’s accessibility objectives relate to each mode of transport<br />
individually; Wellington’s economic efficiency objectives cover costs, benefits, prices,<br />
and synergies between modes of transport and land use.<br />
Supplementing the objectives, specific strategic transport issues were identified. A list<br />
of all known strategic transport (and related) problems was prepared, together with the<br />
potential solutions. Generally, these had been the subject of previous studies, and the<br />
most important have been mentioned earlier in the paper.<br />
Technical Procedures<br />
An appraisal approach is needed which can evaluate alternative strategies against the<br />
defined objectives. Where the objectives are quantifiable, it is likely that a transport<br />
model will be the appropriate source of information. The major concern is that the<br />
transport model should be suitable for the purpose of strategy development, and this<br />
essentially implies that it should be able to address all significant outcomes of the<br />
alternative strategies. In this respect, the most demanding elements are the public<br />
transport and pricing components of strategies.<br />
In Auckland and Wellington, the transportation models used were conventional<br />
strategic four stage aggregate models. They contained trip generation, distribution,<br />
mode split and assignment with broadly 100 zones covering each city region. The<br />
models were able to model peak and interpeak periods separately and encompassed car<br />
driver and passenger, public transport and slow modes. Following formal reviews of<br />
their fitness for the purpose, various improvements were made to the established<br />
models including the incorporation of a car trip retiming module for road pricing<br />
investigations.<br />
Because standard transport model output is inconvenient for strategic analysis, sets of<br />
performance indicators were developed which could be output <strong>by</strong> the models and<br />
which, so far as possible, measured the outcomes pertaining to each objective. Some<br />
examples are given in Figure 3.<br />
Not all objectives are readily quantified and the appraisal approach allowed for<br />
qualitative judgement in respect of some objectives. For example, environmental
<strong>Ashley</strong>, Brennand, Houghton<br />
effects such as noise, visual intrusion and severance were difficult to quantify at a<br />
strategic level.<br />
Figure3: Examples of Performance Indicators<br />
Objectives<br />
Environment<br />
Accessibility<br />
- <strong>by</strong> car<br />
- <strong>by</strong> public transport<br />
- to key industrial<br />
areas/generators<br />
Efficiency<br />
Safety<br />
General Statistics<br />
Indicators<br />
Fuel consumption<br />
Emissions <strong>by</strong> type and location<br />
<strong>Transport</strong> land take<br />
Length of new road<br />
Average car journey speeds <strong>by</strong> location;<br />
relief of key congestion/choke points;<br />
reductions in delays; road network plans<br />
showing road link volume:capacity ratios<br />
Public transport network kms and vehicle<br />
kms<br />
Journey times to ports, airports etc.<br />
Full financial and economic appraisal<br />
Annual number of accidents<br />
Number of trips <strong>by</strong> mode; mode shares<br />
Screenline road traffic and public transport<br />
flows<br />
Average vehicle speed, trip length<br />
Total vehicle kms<br />
Total vehicle journey time<br />
Notes:<br />
Locations would be classified <strong>by</strong> a transport zone aggregation to<br />
well-chosen sectors, and information presented in sector-to-sector<br />
matrix form where appropriate.<br />
Percentage changes from the do minimum or from the current year<br />
are usually also helpful.<br />
The effects of the strategies were evaluated for a future scenario some 20 years ahead<br />
against a Do Minimum context which included committed transport infrastructure and<br />
other projects or policies which were expected to be common to all strategies. Analysis<br />
of this Do Minimum forecast was also useful in the identification of future problems<br />
and issues.<br />
The <strong>Strategy</strong> Development Process<br />
The sequence of activities for developing the strategies in both Auckland and<br />
Wellington is illustrated in Figure 4. It comprises a sequence of three workshop-based<br />
cycles. In each cycle, the transportation model is used to forecast the impacts of a predefined<br />
set of strategies. It was found that some associated optimisation studies on<br />
specific features of the strategies (for example, the optimum scale of project in a<br />
particular corridor, or the best combination of projects along a corridor) were required.<br />
Because of the complexity of strategies which combine a variety of public transport and<br />
road schemes with, perhaps, traffic management and pricing measures, we followed the<br />
now customary approach of commencing with simple, single dimension strategies - a<br />
road strategy, a public transport strategy, a pricing strategy, a management strategy
Strat. Trans. Planning in NZ’s Two Major Urban Areas – Auck and Wgtn<br />
(sometimes termed “cartoon” strategies). These initial strategies were formed from all<br />
the known transport projects and policies established through previous studies.
<strong>Ashley</strong>, Brennand, Houghton<br />
Figure 4: The <strong>Strategy</strong> Development Process<br />
Establish the Do Minimum Scenario<br />
…………………………………………………………………………………………….<br />
1 st Cycle<br />
Define a first set of alternative strategies (eg “cartoons”)<br />
Run model to forecast their impacts; produce performance indicators<br />
Associated optimisation studies<br />
Workshop I:<br />
Analyse performance of strategies and results of associated studies<br />
Design next round of strategies<br />
Run model to estimate impacts of the revised strategies; produce performance<br />
indicators<br />
Associated optimisation studies<br />
…………………………………………………………………………………………….<br />
Repeat Workshop/Model Run Cycle until preferred strategy is identified<br />
…………………………………………………………………………………………….<br />
Prepare draft Regional Land <strong>Transport</strong> <strong>Strategy</strong><br />
Public Consultation<br />
At a workshop of typically six people, the forecasts were analysed in depth to establish<br />
a clear understanding of the performance of the alternative strategies and their<br />
individual components. This sought to identify for an individual strategy: how far it<br />
achieves the objectives; the issues which it solves and those left unresolved; the<br />
effective, ineffective or unacceptable elements of its performance; the additional<br />
projects which might be added and whether projects taken from other strategies might<br />
complement or enhance the strategy and address some of its weaknesses. Figure 5<br />
illustrates how, at the end of a workshop, the consensus view of the overall<br />
performance of each alternative strategy was usually characterised against the major<br />
goals (using a 5 point scale). On the basis of the analysis, a revised set of strategies<br />
which were expected to more closely meet the objectives was designed in the<br />
workshop.
Strat. Trans. Planning in NZ’s Two Major Urban Areas – Auck and Wgtn<br />
Figure 5: Overall strategy assessment against objectives<br />
Goals/Objectives <strong>Strategy</strong> A <strong>Strategy</strong> B <strong>Strategy</strong> C <strong>Strategy</strong> D<br />
Environment<br />
++<br />
-<br />
--<br />
+<br />
Accessibility<br />
· road<br />
· public transport<br />
0<br />
++<br />
+<br />
0<br />
++<br />
-<br />
0<br />
+<br />
Efficiency<br />
0<br />
++<br />
--<br />
0<br />
Safety<br />
0<br />
0<br />
-<br />
0<br />
Financial<br />
+<br />
+<br />
-<br />
+<br />
Note : Strategies are rated on a 5 point scale: (very good) ++, +, 0, -, -- (very poor).<br />
During these in-depth studies, the known list of planned projects was invariably found<br />
to be insufficient to secure the balanced strategy sought within the workshops, and<br />
further studies were commissioned into new project concepts to establish broad<br />
feasibility, costs etc.<br />
The workshops did not include representatives of all the main stakeholding<br />
organisations and therefore wider consultation on the conclusions of each workshop<br />
followed very shortly afterwards. In consequence, some adjustment to the design of the<br />
strategies was usually required. Such consultation not only ensured that wider views<br />
influenced the process but also helped in the development of a stakeholder consensus<br />
as to the most appropriate direction for the strategy to take.<br />
Key Findings<br />
Auckland<br />
As a result of the analysis of a wide range of strategic combinations of transport<br />
improvements, some important conclusions concerning the likely outcomes of each of<br />
the possible dimensions of the strategy were reached:<br />
<br />
road investment would be able to keep accessibility at reasonable levels throughout<br />
the region, but only if a new north-south corridor was assumed; as noted earlier, that<br />
is a very different and hugely controversial proposition, but without a new north-
<strong>Ashley</strong>, Brennand, Houghton<br />
south corridor accessibility declined in the central isthmus;<br />
<br />
<br />
<br />
passenger transport strategies, <strong>by</strong> themselves, generally resulted in low levels of<br />
accessibility, due to the relatively low density and dispersed land use pattern of<br />
Auckland, although passenger transport in exclusive rights of way in congested areas<br />
did make a worthwhile contribution in those locations;<br />
on the environmental indicators the road strategies did not give markedly worse<br />
consequences than more public transport orientated strategies because the emissions<br />
impacts of the higher vehicle km of travel were broadly offset <strong>by</strong> the less congested<br />
conditions;<br />
congestion pricing has marked effects in reducing both congestion and vehicle travel<br />
(and the corresponding environmental effects) but, <strong>by</strong> itself, would imply prices<br />
which would almost certainly be unacceptably high.<br />
The preferred strategy can generally be described as new roads linking the outer sectors<br />
of the region and serving the Port, with major passenger transport investments on the<br />
three main corridors serving the CBD (Figure 6). These would be a busway on the<br />
northern corridor and major upgrading of the western and southern rail corridors,<br />
together with their extension to the CBD. A large number of bus priority schemes are<br />
also proposed, again mainly on the radial routes serving the CBD. The rail investments<br />
in particular are seen as catalysts for the development of higher density mixed use<br />
nodes around key rail stations.<br />
Relative to 1991, the strategy would reduced the expected decline in roads speeds <strong>by</strong><br />
2021 from 14% without the strategy to 6%. The public transport shares to the CBD<br />
would increase from 16% to 21%.<br />
The passenger transport improvements, together with limited road improvements to the<br />
existing Harbour Bridge corridor, will bring modest improvements to north-south<br />
accessibility but are unlikely to resolve the issue in the long term. The preferred<br />
strategy presents a number of alternatives for new north-south routes as a matter for<br />
public debate, but acknowledges that because of their environmental and community<br />
impacts and their costs, they may not ultimately be buildable. These options have<br />
generated lively and heated public debate. The matter is not yet resolved, and may not<br />
be for some time.<br />
The preferred strategy points to the major role that road pricing could play in improving<br />
transport but acknowledges the practical, political and legal difficulties in<br />
implementing road pricing. Further work is proposed on road pricing options designed<br />
to develop an implementable scheme, with a view to introducing road pricing in the<br />
short to medium term. The preferred strategy is not reliant however on road pricing<br />
and is still an appropriate strategy if road pricing does not eventuate.<br />
The costs of implementing the preferred strategy are estimated to be $250 million per
Strat. Trans. Planning in NZ’s Two Major Urban Areas – Auck and Wgtn<br />
year road investment for the first five years, reducing to $150 million per year<br />
thereafter, plus $75 million per year on passenger transport. The level of road<br />
investment is comparable with that of current investment, although that is considerably<br />
higher than historic investment levels. The level of investment in passenger transport is<br />
considerably higher than either current or historic levels.<br />
There has been disappointment from some sectors of the Auckland community at the<br />
treatment of passenger transport in the preferred strategy. There is a feeling that<br />
passenger transport should be developed as “a genuine alternative to car use” and that<br />
the strategy does not go far enough in delivering this, particularly with respect to<br />
developing cross-town passenger transport services. Part of this response has been<br />
because the document is written at a regional strategic level and many of the policies<br />
relating to passenger transport are therefore written in a generalised way. It has been<br />
hard for some members of the public to see in the strategy the improvements to<br />
passenger transport they are looking for. To address this perception, additional work<br />
has now been done on more detailed projects and policies, and particularly on setting<br />
aggressive passenger transport mode share goals on key screenlines. This work will be<br />
published as a companion document to the strategy, and the key projects and policies<br />
incorporated in the final version of the strategy.<br />
The modelling was undertaken with a 2021 land use scenario based on the Growth<br />
<strong>Strategy</strong> referred to earlier. It assumed a degree of development intensification<br />
including nodal intensification, around selected rail stations. The degree of<br />
intensification which is considered realistic in the time frame is not dramatic however.<br />
As a sensitivity test, the preferred transport package was tested against a “trend based”<br />
land use, and produced similar performance indicators to the main land use scenario.<br />
The inference drawn from this was that the modelled time period was too short to allow<br />
regionally significant changes in the land use pattern to develop. We are aware of<br />
similar conclusions being drawn for Bristol (UK) and Melbourne.<br />
Wellington<br />
Some of the general findings of the analysis were as follows:<br />
<br />
<br />
the analysis of the Wellington network showed that performance against the<br />
objectives was not greatly enhanced over the do minimum scenario with modest<br />
road and passenger transport improvements; a high level of performance against<br />
objectives would requires a more radical approach;<br />
road construction was found to be useful in solving specific bottlenecks, but there<br />
was a widespread tendency for bottlenecks to move elsewhere as a result of the<br />
additional traffic attracted to the corridor (usually as a result of rail users transferring<br />
to car, and having a serious impact on rail patronage); a network-wide approach to<br />
road-building would also be too expensive; consequently, a programme of heavy<br />
road investment was rejected;
<strong>Ashley</strong>, Brennand, Houghton<br />
<br />
<br />
public transport investment was not found to be an effective tool for removing<br />
specific road bottlenecks, but it did generate useful time savings to road users<br />
through the accumulation of small reductions in congestion along the corridor;<br />
a regime of modest road pricing was judged to be promising as a means of<br />
increasing the efficiency of operation of the road network and of eliminating<br />
outstanding bottlenecks.<br />
In designing the preferred strategy, one of the key issues was the need to find a<br />
balanced set of road and public transport projects which improved accessibility and<br />
resolved the main transport issues without simply transferring road congestion from one<br />
place to another or significantly undermining rail patronage.<br />
Two alternatives for the preferred strategy for the Wellington Region were identified.<br />
The first was a modest, balanced mix of road and passenger transport improvements<br />
(Figure 7). This strategy has a satisfactory performance in terms of the objectives of<br />
accessibility and economic development safety and sustainability but is not an exciting<br />
prospect. It performs well against the objectives of affordability and economic<br />
efficiency and would attract funding support from the Government. The capital cost is<br />
$160 million over 20 years.<br />
The second alternative is to provide a more ambitious (and expensive) mix of road and<br />
passenger transport projects as shown in Figure 8. This strategy is still in balance.<br />
This strategy has a far more attractive performance against the strategy’s objectives,<br />
particularly accessibility and economic development, but does not perform well against<br />
the affordability and economic efficiency objectives. This strategy has a capital cost of<br />
$640 million over 20 years.<br />
The inclusion of road pricing at a level required to fund the more expensive<br />
infrastructure items in the enhanced strategy would potentially address the affordability<br />
and economic efficiency issues. The level of road pricing required would also not be<br />
prohibitive. For example, a peak period cordon toll of $1.00 around central Wellington<br />
or a petrol tax of $0.20 a litre would be sufficient to fund the enhanced strategy. Such<br />
a proposal is likely to provide overall accessibility benefits that more than compensate<br />
for the additional user costs but, as with most such schemes, many toll-payers would be<br />
incur disbenefits.<br />
The light rail schemes require further analysis. This strategy analysis has illustrated<br />
that a significant investment in passenger transport in the particular corridors identified<br />
is worth considering. The most effective use of that investment may not be light rail<br />
transit but some other technology.<br />
Preliminary stakeholder and commuter feedback on these proposals has been very<br />
supportive. There has also been strong support for the enhanced strategy and for the<br />
use of road pricing to fund the more expensive infrastructure items.
Strat. Trans. Planning in NZ’s Two Major Urban Areas – Auck and Wgtn<br />
Conclusions<br />
The process of transport strategy development described in this paper has been<br />
successful in enabling the identification of preferred strategies for each city which have<br />
met the requirements of major stakeholders. In both cases, the process has worked<br />
effectively and efficiently. That for Auckland has been the subject of public<br />
consultation, with the result that some amendments will be made. At the time of<br />
writing, the draft Wellington strategy is in the public consultation phase.<br />
The development of the transport strategies has enabled differing measures such as<br />
road investment, passenger transport enhancement, traffic management and road<br />
pricing to be integrated in response to the identified broad range of issues. This process<br />
has also explicitly allowed for the interdependency of projects in different parts of the<br />
network and the interaction between road and passenger transport investment. Induced<br />
traffic issues have been addressed.<br />
It cannot be argued that either of these strategies could have been drafted without the<br />
aforementioned analysis. In neither case was the particular balance of the strategy<br />
apparent at the outset and, in both cases, new projects were identified as being needed<br />
in the course of the strategy development process.<br />
Neither can it be argued that the same strategic solution is appropriate to every city.<br />
While clearly there are many common components to a transport strategy, the balance<br />
and level of investment in the preferred strategies for these two cities are markedly<br />
different which, we would argue, reflects the differences in the context (ie population,<br />
geographic structure, economic activity, transport networks and travel patterns).<br />
Having thus argued that the process has achieved a great deal, we must acknowledge<br />
that it remains for the future to demonstrate whether these strategies will turn out to be<br />
as influential as the Land <strong>Transport</strong> Act and regional stakeholders intend.