Exhibitor Prospectus - Society of Petroleum Engineers
Exhibitor Prospectus - Society of Petroleum Engineers
Exhibitor Prospectus - Society of Petroleum Engineers

Create successful ePaper yourself
Turn your PDF publications into a flip-book with our unique Google optimized e-Paper software.
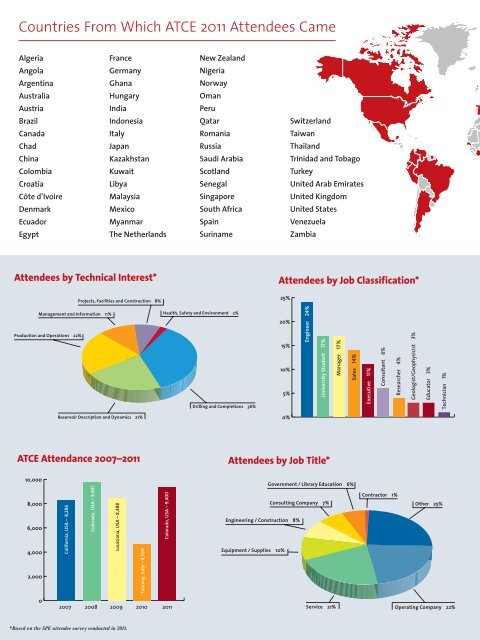
Countries From Which ATCE 2011 Attendees Came<br />
Algeria<br />
France<br />
New Zealand<br />
Angola<br />
Germany<br />
Nigeria<br />
Argentina<br />
Ghana<br />
Norway<br />
Australia<br />
Hungary<br />
Oman<br />
Austria<br />
Brazil<br />
Canada<br />
Chad<br />
China<br />
Colombia<br />
Croatia<br />
Côte d’Ivoire<br />
Denmark<br />
Ecuador<br />
Egypt<br />
India<br />
Indonesia<br />
Italy<br />
Japan<br />
Kazakhstan<br />
Kuwait<br />
Libya<br />
Malaysia<br />
Mexico<br />
Myanmar<br />
The Netherlands<br />
Peru<br />
Qatar<br />
Romania<br />
Russia<br />
Saudi Arabia<br />
Scotland<br />
Senegal<br />
Singapore<br />
South Africa<br />
Spain<br />
Suriname<br />
Switzerland<br />
Taiwan<br />
Thailand<br />
Trinidad and Tobago<br />
Turkey<br />
United Arab Emirates<br />
United Kingdom<br />
United States<br />
Venezuela<br />
Zambia<br />
Attendees by Technical Interest*<br />
Projects, Facilities and Construction 8%<br />
Attendees by Job Classification*<br />
25%<br />
Management and Information 11%<br />
Production and Operations 22%<br />
Health, Safety and Environment 2%<br />
Drilling and Completions 36%<br />
20%<br />
15%<br />
10%<br />
5%<br />
Engineer 24%<br />
University Student 17%<br />
Manager 17%<br />
Sales 14%<br />
Executive 11%<br />
Consultant 6%<br />
Researcher 4%<br />
Geologist/Geophysicist 3%<br />
Educator 3%<br />
Technician 1%<br />
Reservoir Description and Dynamics 21%<br />
0%<br />
ATCE Attendance 2007–2011<br />
Attendees by Job Title*<br />
10,000<br />
8,000<br />
6,000<br />
4,000<br />
2,000<br />
California, USA – 8,286<br />
Colorado, USA – 9,831<br />
Louisiana, USA – 8,488<br />
Tuscany, Italy – 4,700<br />
Colorado, USA – 9,400<br />
Government / Library Education 6%<br />
Consulting Company 7%<br />
Engineering / Construction 8%<br />
Equipment / Supplies 10%<br />
Contractor 1%<br />
Other 25%<br />
0<br />
2007<br />
2008 2009 2010 2011<br />
Service 21%<br />
Operating Company 22%<br />
*Based on the SPE attendee survey conducted in 2011.