Hospitals
Hospitals
Hospitals

You also want an ePaper? Increase the reach of your titles
YUMPU automatically turns print PDFs into web optimized ePapers that Google loves.
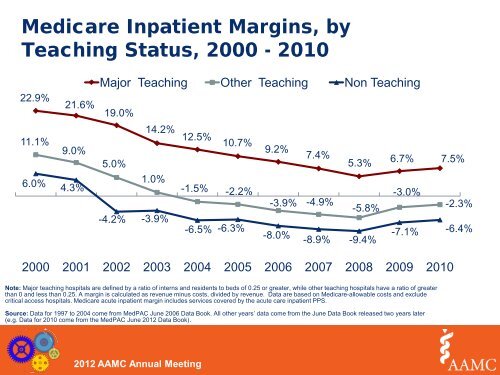
Medicare Inpatient Margins, by<br />
Teaching Status, 2000 - 2010<br />
22.9%<br />
21.6%<br />
Major Teaching Other Teaching Non Teaching<br />
19.0%<br />
11.1%<br />
6.0%<br />
9.0%<br />
4.3%<br />
14.2% 12.5%<br />
10.7%<br />
5.0%<br />
1.0%<br />
-1.5% -2.2%<br />
-4.2% -3.9%<br />
-6.5% -6.3%<br />
9.2%<br />
7.4%<br />
5.3%<br />
-3.9% -4.9%<br />
-5.8%<br />
-8.0%<br />
-8.9% -9.4%<br />
6.7% 7.5%<br />
-3.0%<br />
-2.3%<br />
-7.1% -6.4%<br />
2000 2001 2002 2003 2004 2005 2006 2007 2008 2009 2010<br />
Note: Major teaching hospitals are defined by a ratio of interns and residents to beds of 0.25 or greater, while other teaching hospitals have a ratio of greater<br />
than 0 and less than 0.25. A margin is calculated as revenue minus costs, divided by revenue. Data are based on Medicare-allowable costs and exclude<br />
critical access hospitals. Medicare acute inpatient margin includes services covered by the acute care inpatient PPS.<br />
Source: Data for 1997 to 2004 come from MedPAC June 2006 Data Book. All other years’ data come from the June Data Book released two years later<br />
(e.g. Data for 2010 come from the MedPAC June 2012 Data Book).<br />
2012 AAMC Annual Meeting