ipcc_wg3_ar5_final-draft_postplenary_chapter8
ipcc_wg3_ar5_final-draft_postplenary_chapter8
ipcc_wg3_ar5_final-draft_postplenary_chapter8

Create successful ePaper yourself
Turn your PDF publications into a flip-book with our unique Google optimized e-Paper software.
Final Draft Chapter 8 IPCC WGIII AR5<br />
efficiency of fuel to kinetic energy of around 32%. Note: Width of lines depicts total energy flows. (IEA,<br />
2012d).<br />
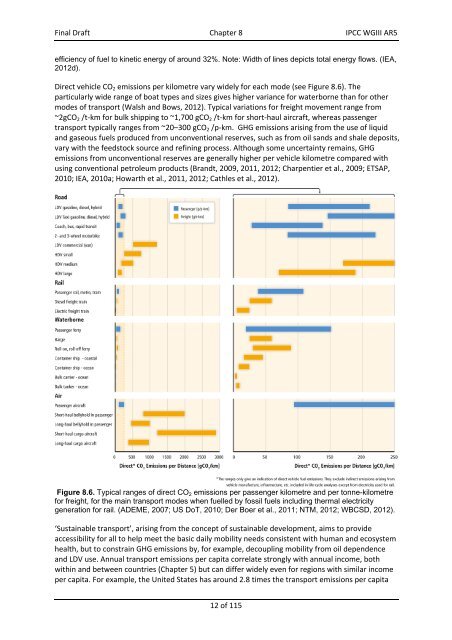
Direct vehicle CO 2 emissions per kilometre vary widely for each mode (see Figure 8.6). The<br />
particularly wide range of boat types and sizes gives higher variance for waterborne than for other<br />
modes of transport (Walsh and Bows, 2012). Typical variations for freight movement range from<br />
~2gCO 2 /t‐km for bulk shipping to ~1,700 gCO 2 /t‐km for short‐haul aircraft, whereas passenger<br />
transport typically ranges from ~20–300 gCO 2 /p‐km. GHG emissions arising from the use of liquid<br />
and gaseous fuels produced from unconventional reserves, such as from oil sands and shale deposits,<br />
vary with the feedstock source and refining process. Although some uncertainty remains, GHG<br />
emissions from unconventional reserves are generally higher per vehicle kilometre compared with<br />
using conventional petroleum products (Brandt, 2009, 2011, 2012; Charpentier et al., 2009; ETSAP,<br />
2010; IEA, 2010a; Howarth et al., 2011, 2012; Cathles et al., 2012).<br />
Figure 8.6. Typical ranges of direct CO 2 emissions per passenger kilometre and per tonne-kilometre<br />
for freight, for the main transport modes when fuelled by fossil fuels including thermal electricity<br />
generation for rail. (ADEME, 2007; US DoT, 2010; Der Boer et al., 2011; NTM, 2012; WBCSD, 2012).<br />
‘Sustainable transport’, arising from the concept of sustainable development, aims to provide<br />
accessibility for all to help meet the basic daily mobility needs consistent with human and ecosystem<br />
health, but to constrain GHG emissions by, for example, decoupling mobility from oil dependence<br />
and LDV use. Annual transport emissions per capita correlate strongly with annual income, both<br />
within and between countries (Chapter 5) but can differ widely even for regions with similar income<br />
per capita. For example, the United States has around 2.8 times the transport emissions per capita<br />
12 of 115