Monthly Statistical Bulletin - EPRA
Monthly Statistical Bulletin - EPRA
Monthly Statistical Bulletin - EPRA

Create successful ePaper yourself
Turn your PDF publications into a flip-book with our unique Google optimized e-Paper software.
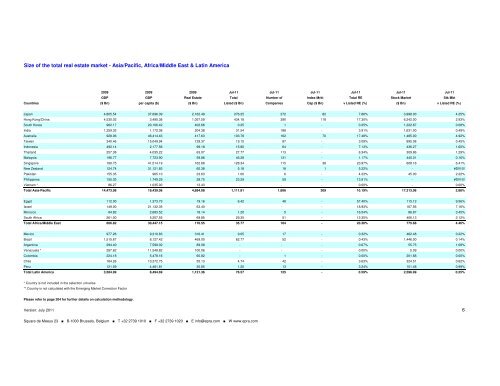
Size of the total real estate market - Asia/Pacific, Africa/Middle East & Latin America<br />
2009 2009 2009 Jul-11 Jul-11 Jul-11 Jul-11 Jul-11 Jul-11<br />
GDP GDP Real Estate Total Number of Index Mrkt Total RE Stock Market Stk Mkt<br />
Countries ($ Bn) per capita ($) ($ Bn) Listed ($ Bn) Companies Cap ($ Bn) v Listed RE (%) ($ Bn) v Listed RE (%)<br />
Japan 4,805.54 37,696.39 2,162.49 276.25 272 82 7.86% 3,998.00 4.25%<br />
Hong Kong/China 4,530.02 3,490.38 1,057.59 434.18 390 118 17.30% 6,242.00 2.93%<br />
South Korea 962.17 20,106.42 402.66 0.25 1 - 0.25% 1,222.67 0.08%<br />
India 1,259.32 1,172.38 204.38 31.54 188 - 3.91% 1,631.00 0.49%<br />
Australia 928.06 46,414.43 417.63 103.78 162 70 17.48% 1,485.00 4.92%<br />
Taiwan 340.46 15,049.94 129.37 19.15 87 - 3.09% 895.08 0.45%<br />
Indonesia 492.14 2,177.56 98.18 15.80 64 - 7.13% 436.27 1.60%<br />
Thailand 257.38 4,035.22 63.07 27.77 113 - 6.34% 309.86 1.29%<br />
Malaysia 196.77 7,723.90 59.86 46.28 131 - 1.17% 440.01 0.16%<br />
Singapore 180.75 41,514.19 162.68 128.34 115 38 23.97% 608.18 6.41%<br />
New Zealand 124.74 31,121.83 60.38 5.18 18 1 5.22% - #DIV/0!<br />
Pakistan 155.35 965.10 23.63 1.00 6 - 4.23% 45.00 2.22%<br />
Philippines 155.03 1,749.29 28.75 23.29 59 - 13.91% - #DIV/0!<br />
Vietnam * 86.27 1,035.00 13.43 - - - 0.00% - 0.00%<br />
Total Asia-Pacific 14,473.98 19,439.06 4,884.08 1,111.81 1,606 309 10.19% 17,313.06 2.88%<br />
Egypt 112.00 1,373.73 19.16 6.42 48 - 57.40% 115.12 9.56%<br />
Israel 149.00 21,132.35 63.40 - - - 18.93% 167.56 7.16%<br />
Morocco 84.82 2,683.52 18.14 1.20 5 - 16.54% 86.87 3.45%<br />
South Africa 261.00 5,257.55 69.85 29.35 51 - 12.35% 406.13 2.12%<br />
Total Africa/Middle East 606.82 30,447.15 170.55 35.77 104 - 20.30% 775.68 4.46%<br />
Mexico 977.26 9,310.83 316.41 9.05 17 - 0.32% 462.48 0.22%<br />
Brazil 1,515.67 8,127.42 469.00 62.77 52 - 0.43% 1,446.00 0.14%<br />
Argentina 294.40 7,599.02 89.08 - - - 0.67% 55.75 1.08%<br />
Venezuela * 287.62 11,548.82 100.06 - - - 0.00% 5.09 0.00%<br />
Colombia 224.18 5,478.16 60.82 - 1 - 0.00% 201.68 0.00%<br />
Chile 164.26 10,372.75 55.13 4.74 42 - 3.63% 324.51 0.62%<br />
Peru 121.59 4,481.81 30.85 1.20 13 - 3.24% 101.48 0.99%<br />
Total Latin America 3,584.99 8,494.69 1,121.36 76.57 125 - 0.59% 2,596.99 0.25%<br />
* Country is not included in the selection universe<br />
** Country is not calculated with the Emerging Market Correction Factor<br />
Please refer to page 204 for further details on calculation methodology.<br />
Version: July 2011<br />
6<br />
Square de Meeus 23 ■ B-1000 Brussels, Belgium ■ T +32 2739 1010 ■ F +32 2739 1020 ■ E info@epra.com ■ W www.epra.com