- Page 1 and 2: July 2011 ` 160
- Page 3 and 4: Contents Page 4 Section 1 - Size of
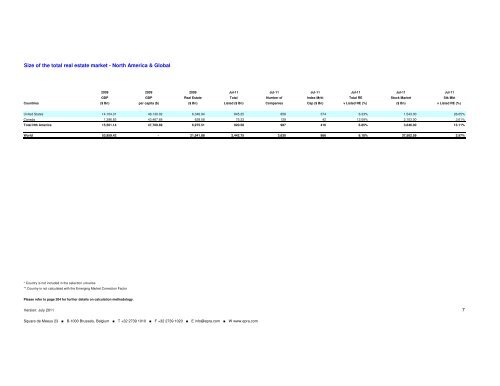
- Page 5: Size of the total real estate marke
- Page 9 and 10: FTSE EPRA/NAREIT Global Developed I
- Page 11 and 12: FTSE EPRA/NAREIT Global Developed I
- Page 13 and 14: FTSE EPRA/NAREIT Global Developed I
- Page 15 and 16: FTSE EPRA/NAREIT Global Developed I
- Page 17 and 18: FTSE EPRA/NAREIT Global Developed I
- Page 19 and 20: FTSE EPRA/NAREIT Global Developed I
- Page 21 and 22: FTSE EPRA/NAREIT Global Developed I
- Page 23 and 24: FTSE EPRA/NAREIT Global Developed I
- Page 25 and 26: Foreign Exchange Performance Foreig
- Page 27 and 28: Section 3 FTSE EPRA/NAREIT Asia Dev
- Page 29 and 30: FTSE EPRA/NAREIT Asia Developed Ind
- Page 31 and 32: FTSE EPRA/NAREIT Asia Developed Ind
- Page 33 and 34: FTSE EPRA/NAREIT Asia Developed Ind
- Page 35 and 36: FTSE EPRA/NAREIT Asia Developed Ind
- Page 37 and 38: FTSE EPRA/NAREIT Asia Developed Ind
- Page 39 and 40: FTSE EPRA/NAREIT Asia Developed Ind
- Page 41 and 42: FTSE EPRA/NAREIT Asia Developed Ind
- Page 43 and 44: FTSE EPRA/NAREIT Asia Developed Ind
- Page 45 and 46: FTSE EPRA/NAREIT Asia Developed Ind
- Page 47 and 48: FTSE EPRA/NAREIT Asia Developed Ind
- Page 49 and 50: FTSE EPRA/NAREIT Asia Developed Ind
- Page 51 and 52: FTSE EPRA/NAREIT Europe Developed I
- Page 53 and 54: FTSE EPRA/NAREIT Europe Developed I
- Page 55 and 56: FTSE EPRA/NAREIT Europe Developed I
- Page 57 and 58:
FTSE EPRA/NAREIT Europe Developed I
- Page 59 and 60:
FTSE EPRA/NAREIT Europe Developed I
- Page 61 and 62:
FTSE EPRA/NAREIT Developed Europe I
- Page 63 and 64:
FTSE EPRA/NAREIT Developed Europe I
- Page 65 and 66:
FTSE EPRA/NAREIT Europe Developed I
- Page 67 and 68:
FTSE EPRA/NAREIT Europe Developed I
- Page 69 and 70:
FTSE EPRA/NAREIT Europe Developed I
- Page 71 and 72:
FTSE EPRA/NAREIT Europe Developed I
- Page 73 and 74:
FTSE EPRA/NAREIT Europe Developed I
- Page 75 and 76:
FTSE EPRA/NAREIT Europe Developed I
- Page 77 and 78:
FTSE EPRA/NAREIT Europe Developed I
- Page 79 and 80:
FTSE EPRA/NAREIT Europe Developed I
- Page 81 and 82:
FTSE EPRA/NAREIT Europe Developed I
- Page 83 and 84:
FTSE EPRA/NAREIT Europe Developed I
- Page 85 and 86:
FTSE EPRA/NAREIT Europe Developed I
- Page 87 and 88:
FTSE EPRA/NAREIT Europe Developed I
- Page 89 and 90:
Section 5 FTSE EPRA/NAREIT North Am
- Page 91 and 92:
FTSE EPRA/NAREIT North America Deve
- Page 93 and 94:
FTSE EPRA/NAREIT North America Deve
- Page 95 and 96:
FTSE EPRA/NAREIT North America Deve
- Page 97 and 98:
FTSE EPRA/NAREIT North America Deve
- Page 99 and 100:
FTSE EPRA/NAREIT North America Deve
- Page 101 and 102:
FTSE EPRA/NAREIT North America Deve
- Page 103 and 104:
FTSE EPRA/NAREIT North America Deve
- Page 105 and 106:
FTSE EPRA/NAREIT North America Deve
- Page 107 and 108:
FTSE EPRA/NAREIT North America Deve
- Page 109 and 110:
Section 6 FTSE EPRA/NAREIT Global D
- Page 111 and 112:
FTSE EPRA/NAREIT Global Developed R
- Page 113 and 114:
FTSE EPRA/NAREIT Global Developed R
- Page 115 and 116:
FTSE EPRA/NAREIT Global Developed R
- Page 117 and 118:
FTSE EPRA/NAREIT Global Developed R
- Page 119 and 120:
FTSE EPRA/NAREIT Global Developed R
- Page 121 and 122:
FTSE EPRA/NAREIT Global Developed R
- Page 123 and 124:
FTSE EPRA/NAREIT Global Developed R
- Page 125 and 126:
FTSE EPRA/NAREIT Global Developed R
- Page 127 and 128:
FTSE EPRA/NAREIT Global Developed R
- Page 129 and 130:
FTSE EPRA/NAREIT Global Developed R
- Page 131 and 132:
Section 7 FTSE EPRA/NAREIT Global D
- Page 133 and 134:
FTSE EPRA/NAREIT Developed Investme
- Page 135 and 136:
FTSE EPRA/NAREIT Developed Investme
- Page 137 and 138:
FTSE EPRA/NAREIT Developed Investme
- Page 139 and 140:
FTSE EPRA/NAREIT Developed Investme
- Page 141 and 142:
FTSE EPRA/NAREIT Developed Investme
- Page 143 and 144:
Section 8 FTSE EPRA/NAREIT Develope
- Page 145 and 146:
FTSE EPRA/NAREIT Developed Sector I
- Page 147 and 148:
FTSE EPRA/NAREIT Developed Sector I
- Page 149 and 150:
FTSE EPRA/NAREIT Developed Sector I
- Page 151 and 152:
FTSE EPRA/NAREIT Developed Sector I
- Page 153 and 154:
FTSE EPRA/NAREIT Developed Sector I
- Page 155 and 156:
FTSE EPRA/NAREIT Developed Sector I
- Page 157 and 158:
FTSE EPRA/NAREIT Developed Sector I
- Page 159 and 160:
FTSE EPRA/NAREIT Developed Sector I
- Page 161 and 162:
FTSE EPRA/NAREIT Developed Sector I
- Page 163 and 164:
FTSE EPRA/NAREIT Developed Sector I
- Page 165 and 166:
FTSE EPRA/NAREIT Developed Sector I
- Page 167 and 168:
FTSE EPRA/NAREIT Developed Sector I
- Page 169 and 170:
FTSE EPRA/NAREIT Developed Sector I
- Page 171 and 172:
FTSE EPRA/NAREIT Developed Sector I
- Page 173 and 174:
FTSE EPRA/NAREIT Developed Sector I
- Page 175 and 176:
FTSE EPRA/NAREIT Developed Sector I
- Page 177 and 178:
FTSE EPRA/NAREIT Custom Liquid Inde
- Page 179 and 180:
FTSE EPRA/NAREIT Custom Liquid Inde
- Page 181 and 182:
FTSE EPRA/NAREIT Custom Liquid Inde
- Page 183 and 184:
FTSE EPRA/NAREIT Custom Liquid Inde
- Page 185 and 186:
FTSE EPRA/NAREIT Custom Liquid Inde
- Page 187 and 188:
FTSE EPRA/NAREIT Custom Liquid Inde
- Page 189 and 190:
FTSE EPRA/NAREIT Custom Liquid Inde
- Page 191 and 192:
Section 10 Risk / Return Profiles a
- Page 193 and 194:
Correlations Graph 36: Top 5 Countr
- Page 195 and 196:
Correlations Graph 38: Global Devel
- Page 197 and 198:
36 Months Correlations (in USD) Glo
- Page 199 and 200:
36 Months Correlations (in Local Cu
- Page 201 and 202:
36 Months Correlations (in Local Cu
- Page 203 and 204:
Section 11 Details on Methodology V
- Page 205 and 206:
Methodology Velocity This liquidity
- Page 207 and 208:
Data Vendor Codes - Indices * Bold
- Page 209 and 210:
Data Vendor Codes - Indices * Bold
- Page 211 and 212:
Data Vendor Codes - Indices * Bold
- Page 213 and 214:
Data Vendor Codes - Indices * Bold
- Page 215 and 216:
Data Vendor Codes - Indices THOMSON
- Page 217 and 218:
Data Vendor Codes - Indices * Bold
- Page 219 and 220:
Data Vendor Codes - Index Constitue
- Page 221 and 222:
Data Vendor Codes - Index Constitue
- Page 223 and 224:
Disclaimer EPRA DISCLAIMER EPRA® d