30 Pressure and Volume Web Ver I - Faculty Webs
30 Pressure and Volume Web Ver I - Faculty Webs
30 Pressure and Volume Web Ver I - Faculty Webs

You also want an ePaper? Increase the reach of your titles
YUMPU automatically turns print PDFs into web optimized ePapers that Google loves.
Gas <strong>Pressure</strong> <strong>and</strong> <strong>Volume</strong><br />
Computer<br />
<strong>30</strong><br />
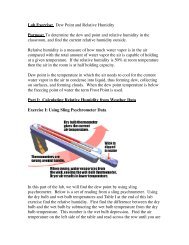
In this simple experiment, you will use a Gas <strong>Pressure</strong> Sensor <strong>and</strong> a gas syringe to study the<br />
relationship between gas pressure <strong>and</strong> volume. Temperature <strong>and</strong> amount of gas will be kept<br />
constant. The results will be expressed in words, in a table, with a graph, <strong>and</strong> with a<br />
mathematical equation. These are four methods commonly used by scientists to communicate<br />
information.<br />
This experiment is similar to one first done by Robert Boyle in 1662—without the use of a<br />
computer, of course. The relationship you will discover is known as Boyle’s law.<br />
OBJECTIVES<br />
In this experiment, you will<br />
• Use a Gas <strong>Pressure</strong> Sensor <strong>and</strong> a gas syringe to measure the pressure of an air sample at<br />
several different volumes.<br />
• Make a table of the results.<br />
• Graph the results.<br />
• Predict the pressure at other volumes.<br />
• Describe the relationship between gas pressure <strong>and</strong> volume with words <strong>and</strong> with a<br />
mathematical equation.<br />
MATERIALS<br />
computer<br />
<strong>Ver</strong>nier computer interface<br />
Logger Pro<br />
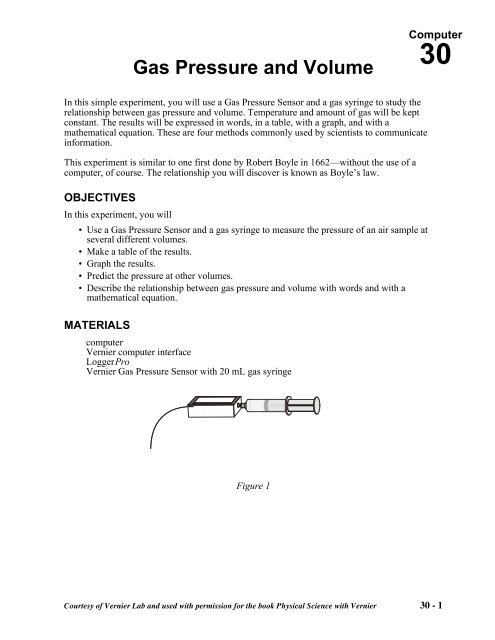
<strong>Ver</strong>nier Gas <strong>Pressure</strong> Sensor with 20 mL gas syringe<br />
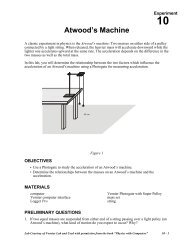
Figure 1<br />
Courtesy of <strong>Ver</strong>nier Lab <strong>and</strong> used with permission for the book Physical Science with <strong>Ver</strong>nier <strong>30</strong> - 1
Computer <strong>30</strong><br />
PROCEDURE<br />
1. Prepare the Gas <strong>Pressure</strong> Sensor <strong>and</strong> an air sample for data collection.<br />
a. Connect the Gas <strong>Pressure</strong> Sensor to the computer interface.<br />
b. With the 20 mL syringe disconnected from the Gas <strong>Pressure</strong> Sensor, move the piston of<br />
the syringe until the front edge of the inside black ring is positioned at the 10.0 mL mark.<br />
c. Attach the 20 mL syringe to the valve of the Gas <strong>Pressure</strong> Sensor.<br />
2. Prepare the computer for data collection by opening the file “<strong>30</strong> <strong>Pressure</strong> <strong>and</strong> <strong>Volume</strong>” from<br />
the Physical Science w <strong>Ver</strong>nier folder.<br />
3. Click to begin data collection.<br />
4. Collect the pressure vs. volume data. It is best for one person to take care of the gas syringe<br />
<strong>and</strong> for another to operate the computer.<br />
a. Move the piston to position the front edge of the inside black ring (see Figure 2) at the<br />
5.0 mL line on the syringe. Hold the piston firmly in this position until the pressure value<br />
stabilizes.<br />
Figure 2<br />
b. When the pressure reading has stabilized, click . Type 5.0 in the edit box. Press the<br />
ENTER key to keep this data pair. Note: You can choose to redo a point by pressing the<br />
ESC key (after clicking , but before entering a value).<br />
c. Continue the procedure for volumes of 7.5, 10.0, 12.5, 15.0, 17.5, <strong>and</strong> 20.0 mL.<br />
d. Click when you have finished collecting data.<br />
5. In your data table, record the pressure <strong>and</strong> volume data pairs displayed in the table (or, if<br />
directed by your instructor, print a copy of the table).<br />
6. Examine the graph of pressure vs. volume. Based on this graph, decide what kind of<br />
mathematical relationship you think exists between these two variables, direct or inverse. To<br />
see if you made the right choice:<br />
a. Click the Curve Fit button, .<br />
b. Choose Variable Power from the list at the lower left. Enter the power in the Power edit<br />
box that represents the relationship shown in the graph (e.g., type 1 if direct, –1 if<br />
inverse). Click .<br />
<strong>30</strong> - 2 Physical Science with <strong>Ver</strong>nier
Gas <strong>Pressure</strong> <strong>and</strong> <strong>Volume</strong><br />
c. A best-fit curve will be displayed on the graph. If you made the correct choice, the curve<br />
should match up well with the points. If the curve does not match up well, try a different<br />
exponent <strong>and</strong> click again. When the curve has a good fit with the data points, then<br />
click .<br />
7. Once you have confirmed that the graph represents either a direct or inverse relationship,<br />
print a copy of the graph, with the graph of pressure vs. volume <strong>and</strong> its best-fit curve<br />
displayed. Enter your name(s) <strong>and</strong> the number of copies you want to print.<br />
DATA<br />
<strong>Volume</strong> 5.0 7.5 10.0 12.5 15.0 17.5 20.0<br />
(mL)<br />
<strong>Pressure</strong> ______ ______ ______ ______ ______ ______ ___ __<br />
(kPa)<br />
PROCESSING THE DATA<br />
1. See the data table <strong>and</strong> note the pressure when the volume is 10.0 mL, <strong>and</strong> when the volume is<br />
5.0 mL. What happened to pressure when the volume was halved?<br />
2. See the data table <strong>and</strong> note the pressure when the volume is 20.0 mL. Compare this pressure<br />
to the pressure when the volume is 10.0 mL. What happened to the pressure when the volume<br />
was doubled?<br />
3. From your graph, what is the pressure when the volume is 16 mL? 8 mL? How do these<br />
values compare?<br />
4. What would the pressure be at 40.0 mL? At 2.5 mL? Explain how you determined these<br />
values.<br />
5. What is the relationship between gas pressure <strong>and</strong> volume (Boyle’s law) in words?<br />
Physical Science with <strong>Ver</strong>nier <strong>30</strong> - 3
Computer <strong>30</strong><br />
6. Do gas pressure <strong>and</strong> volume vary directly or inversely? Explain.<br />
7. Write an equation to express the relationship between gas pressure <strong>and</strong> volume. Use the<br />
symbols P, V, <strong>and</strong> k.<br />
EXTENSIONS<br />
1. To confirm that an inverse relationship exists between pressure <strong>and</strong> volume, a graph of<br />
pressure versus the reciprocal of volume (1/volume or volume -1 ) may also be plotted. To do<br />
this using Logger Pro, it is necessary to create a new column of data, reciprocal of volume,<br />
based on your original volume data.<br />
a. Choose New Calculated Column from the Data menu.<br />
b. Enter “1/<strong>Volume</strong>.” as the Name, “1/V” as the Short Name, <strong>and</strong> “1/mL” as the Unit.<br />
c. Enter the correct formula for the column, (1/volume) into the Equation edit box. Type in 1<br />
<strong>and</strong> /. Then select “<strong>Volume</strong>” from the Variables list. In the Equation edit box, you should<br />
now see displayed: 1/“<strong>Volume</strong>”. Click Done.<br />
d. Click on the horizontal-axis label, select “1/<strong>Volume</strong>” to be displayed, <strong>and</strong> click .<br />
Make a best-fit curve.<br />
e. Click the Curve Fit button, .<br />
f. Choose Variable Power from the list at the lower left. Type 1 in the power edit box. Click<br />
.<br />
g. Click .<br />
If the relationship between P <strong>and</strong> V is an inverse relationship, the plot of P vs. 1/V should be<br />
direct; that is, the curve should be linear <strong>and</strong> pass through (or near) your data points.<br />
Examine your graph to see if this is true for your data.<br />
(Optional) Print the graph of P vs. 1/V.<br />
2. Repeat the experiment using a pure, noncorrosive gas, such as oxygen, butane, or carbon<br />
dioxide. Compare the results with your results for air.<br />
<strong>30</strong> - 4 Physical Science with <strong>Ver</strong>nier