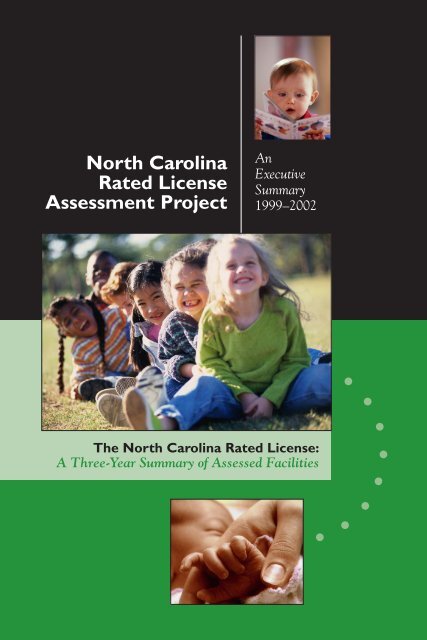
North Carolina Rated License Assessment Project - The University ...
North Carolina Rated License Assessment Project - The University ...
North Carolina Rated License Assessment Project - The University ...

You also want an ePaper? Increase the reach of your titles
YUMPU automatically turns print PDFs into web optimized ePapers that Google loves.
<strong>North</strong> <strong>Carolina</strong><br />
<strong>Rated</strong> <strong>License</strong><br />
<strong>Assessment</strong> <strong>Project</strong><br />
An<br />
Executive<br />
Summary<br />
1999–2002<br />
<strong>The</strong> <strong>North</strong> <strong>Carolina</strong> <strong>Rated</strong> <strong>License</strong>:<br />
A Three-Year Summary of Assessed Facilities
○ ○ ○ ○ ○ ○ ○ ○ ○ ○ ○ ○ ○ ○<br />
○ ○ ○ ○ ○ ○<br />
Introduction 1<br />
<strong>The</strong> <strong>North</strong> <strong>Carolina</strong> Star <strong>Rated</strong> <strong>License</strong> was established in 1999 to better<br />
define the quality of child care in the state and to assist parents in choosing<br />
child care. <strong>The</strong> <strong>North</strong> <strong>Carolina</strong> Division of Child Development awards the<br />
Star <strong>Rated</strong> <strong>License</strong> to child care centers, family child care homes, and schoolage<br />
programs based upon total points earned for program standards, staff<br />
education levels, and compliance history with child care regulations. 2 One<br />
component of the program standards requirements—necessary to score three,<br />
1 Written by Deborah Cassidy, Linda Hestenes, Sharon Mims, and Stephen Hestenes (May<br />
2003). Submit correspondence to: NCRLAP, UNCG, PO Box 26170, Greensboro, NC 27402-<br />
6170, or call 336-256-0100. For more information, please visit our Web site at www.ncrlap.org.<br />
(version 1.0, 4-22-03)<br />
2 Each part of the rated license (program standards, staff education standards, and<br />
compliance history) is worth up to five points. <strong>License</strong>s are awarded based on total points<br />
achieved (One Star = 3–4 points; Two Stars = 5–7 points; Three Stars = 8–10 points; Four<br />
Stars = 11–13 points; Five Stars = 14–15 points).<br />
<strong>North</strong> <strong>Carolina</strong> <strong>Rated</strong> <strong>License</strong> <strong>Assessment</strong> <strong>Project</strong> / Executive Summary 1999–2002 1<br />
1
four, or five points in this area—is an assessment utilizing observational<br />
instruments of global quality (ECERS-R, FDCRS, ITERS, and SACERS). 3 To<br />
receive three points in program standards, a facility must score at least 4.0 on<br />
the appropriate instrument in each<br />
classroom evaluated within a facility;<br />
four points requires an average of at least<br />
4.5 in each classroom, and five points<br />
requires an average of at least 5.0 in each<br />
classroom (all scores are based on a<br />
seven-point scale). <strong>The</strong> <strong>University</strong> of<br />
<strong>North</strong> <strong>Carolina</strong> at Greensboro in<br />
collaboration with other state<br />
institutions of higher education is<br />
responsible for the statewide<br />
implementation of the assessment<br />
process for the Star <strong>Rated</strong> <strong>License</strong>.<br />
This document provides an overview<br />
of assessment scores based on<br />
information collected during the first<br />
three years of the Star <strong>Rated</strong> <strong>License</strong><br />
implementation (September 1, 1999, to<br />
August 31, 2002). It is important to note that these findings primarily apply<br />
to the quality of care in programs applying for three, four, or five points in<br />
program standards. <strong>The</strong>refore, these findings are not based on a representative<br />
sample of programs in <strong>North</strong> <strong>Carolina</strong> partly because the majority of child<br />
care facilities in <strong>North</strong> <strong>Carolina</strong> and nearly all current programs with one,<br />
two, or three stars have not had an assessment using the rating scale.<br />
3 Harms, T., Cryer, D., & Clifford, R. (1990). Infant Toddler Environment Rating Scale. Teachers<br />
College Press: New York.<br />
Harms, T., Clifford, R., & Cryer D. (1998). Early Childhood Environment Rating Scale—Revised.<br />
Teachers College Press: New York.<br />
Harms, T., and Clifford, R. (1989). Family Day Care Rating Scale. Teachers College Press:<br />
New York.<br />
Harms, T., Jacobs, E., and White. D. (1996). School-Age Care Environment Rating Scale.<br />
Teachers College Press: New York.<br />
2 <strong>North</strong> <strong>Carolina</strong> <strong>Rated</strong> <strong>License</strong> <strong>Assessment</strong> <strong>Project</strong> / Executive Summary 1999–2002
Reaching For the<br />
Stars<br />
According to the <strong>North</strong><br />
<strong>Carolina</strong> Division of Child<br />
Development, as of<br />
November, 2002, there were<br />
9,286 Star <strong>Rated</strong> <strong>License</strong>s<br />
issued to centers and homes.<br />
A closer look shows that<br />
approximately 8 percent of<br />
child care centers and 5<br />
percent of family child care<br />
homes have 5-star licenses,<br />
while nearly 19 percent of<br />
centers and 11 percent of<br />
homes have a 4-star rating.<br />
Figures 1 and 2 show that the<br />
largest proportion of centers<br />
have three stars (33 percent)<br />
while the largest proportion<br />
of homes have a 1-star rating<br />
(61 percent).<br />
FIGURE 1<br />
Total Number of Centers by Star Rating, N = 4,121<br />
818<br />
123<br />
1364<br />
796<br />
316<br />
703<br />
Other<br />
FIGURE 2<br />
Total Number of Homes by Star Rating, N = 5,165<br />
3137<br />
81<br />
1048<br />
583<br />
250<br />
Other 66<br />
Global Quality Rating Scale <strong>Assessment</strong>s<br />
During the first three years of the Star <strong>Rated</strong> <strong>License</strong>, 3,388 assessments were<br />
conducted in 2,050 facilities (22 percent of all licensed facilities). A total of<br />
2,582 classrooms and 806 family child care homes participated across all 100<br />
counties in <strong>North</strong> <strong>Carolina</strong>. For participating child care centers, assessments<br />
were completed in approximately one-third of the classrooms (per facility)<br />
with at least one assessment completed in each age group (infants/toddlers;<br />
preschool; school-age). Each participating family child care home received<br />
one assessment. <strong>Assessment</strong>s were completed by assessors with intensive<br />
training and extensive experience with the rating scales. Following the<br />
assessment, facilities received a detailed summary report of the assessment to<br />
assist program staff in improving the quality of services provided for children.<br />
<strong>North</strong> <strong>Carolina</strong> <strong>Rated</strong> <strong>License</strong> <strong>Assessment</strong> <strong>Project</strong> / Executive Summary 1999–2002 3
Partly because the assessment was<br />
voluntary, we believe that the programs<br />
receiving assessments represent the higher<br />
quality child care facilities in <strong>North</strong><br />
<strong>Carolina</strong>. In child care centers, 100<br />
percent of the 5-star programs were<br />
assessed, 81 percent of the 4-star<br />
programs, 13 percent of the 3-star<br />
programs, and 9 percent of the 2-star<br />
programs. No 1-star programs were assessed. In family child care homes, 81<br />
percent of the 5-star homes were assessed, 52 percent of the 4-star homes, 8<br />
percent of the 3-star homes, and 2 percent of the 2-star homes. No 1-star<br />
homes were assessed. <strong>The</strong> average assessment scores achieved in preschool<br />
and school-age classrooms, as well as family child care homes, reflect “good”<br />
quality (see table 1) according to the scales. Although these programs<br />
represent the highest quality of child care available in <strong>North</strong> <strong>Carolina</strong>, the<br />
average score in infant and toddler classrooms was less than “good.” (“Good”<br />
is equivalent to a score of 5 on the seven-point scale.)<br />
TABLE 1<br />
Rating Scale Average Scores<br />
Total <strong>Assessment</strong>s Average Score<br />
ECERS-R 1,312 5.03<br />
ITERS 843 4.69<br />
SACERS 427 5.19<br />
FDCRS 806 5.08<br />
Total 3,388<br />
<strong>The</strong> majority of assessed facilities<br />
across the state (61 percent) received<br />
multiple assessments compared to a<br />
single assessment. Not surprisingly, in<br />
centers where multiple assessments<br />
were completed and an infant/toddler<br />
classroom was included in the<br />
assessment, the ITERS score was the<br />
lowest score approximately 57 percent<br />
of the time.<br />
4 <strong>North</strong> <strong>Carolina</strong> <strong>Rated</strong> <strong>License</strong> <strong>Assessment</strong> <strong>Project</strong> / Executive Summary 1999–2002
Child Care Center Quality<br />
<strong>Assessment</strong> scores provide valuable insight into the areas of achievement and<br />
those areas in need of resources and continuing improvement in child care<br />
centers across the state. <strong>The</strong> following discussion offers an overview of the<br />
average subscale scores for each instrument. To identify specific areas in need,<br />
those subscales with the lowest average score (per instrument) are examined.<br />
Preschool Classrooms: Table 2 provides information regarding the average<br />
subscale scores for the ECERS-R, which was used to assess the quality of<br />
preschool classrooms. <strong>The</strong> average scores for four of six ECERS-R subscales<br />
were consistently higher than “good” (5 on a seven-point scale). Space and<br />
Furnishings nearly achieved a score categorized as “good” (4.95). However,<br />
the Personal Care Routines subscale had an average score of 3.89 (between<br />
minimal [3] and good [5]).<br />
TABLE 2<br />
ECERS-R Subscale Scores<br />
Subscale<br />
Average Score<br />
Space and Furnishings 4.95<br />
Personal Care Routines 3.89<br />
Language-Reasoning 5.42<br />
Activities 5.11<br />
Interaction 5.59<br />
Program Structure 6.03<br />
Table 3 provides a closer examination of the Personal Care Routines<br />
subscale. Only one item (Greeting/departing) received an average score<br />
categorized between “good” and “excellent” (6.65). In contrast, most of the<br />
items in this subscale received average scores categorized between “minimal”<br />
and “good.” Furthermore,<br />
the item that measured<br />
Safety Practices received<br />
the lowest average item<br />
score of 2.50 (categorized<br />
between “inadequate” and<br />
“minimal” on the sevenpoint<br />
scale).<br />
<strong>North</strong> <strong>Carolina</strong> <strong>Rated</strong> <strong>License</strong> <strong>Assessment</strong> <strong>Project</strong> / Executive Summary 1999–2002 5
TABLE 3<br />
ECERS-R Personal Care Routines Subscale<br />
Items<br />
Average Score<br />
9. Greeting/departing 6.65<br />
10. Meals/snacks 3.09<br />
11. Nap/rest 3.86<br />
12. Toileting/diapering 3.02<br />
13. Health practices 4.23<br />
14. Safety practices 2.50<br />
Infant Classrooms: <strong>The</strong> results on the ITERS were quite similar to those of<br />
the ECERS-R, with all subscales scored as “good” or higher with the<br />
exception of Personal Care Routines. It seems quite clear on both the<br />
ECERS-R and the ITERS that the Personal Care Routines subscale was<br />
decidedly lower and weighed heavily on the overall rating scale scores (see<br />
table 4).<br />
TABLE 4<br />
ITERS Subscales Scores<br />
Subscale<br />
Average Score<br />
Furnishing and Display 4.99<br />
Personal Care Routines 3.24<br />
Listening and Talking 5.82<br />
Learning Activities 5.05<br />
Interaction 5.57<br />
Program Structure 5.01<br />
Table 5 provides a closer examination of Personal Care Routines and<br />
shows that six of the seven items scored were quite low. In particular, the item<br />
focusing on Safety Practices (item 13) received the lowest average score for<br />
this subscale and is rated between “inadequate” and “minimal” on the ITERS<br />
scale. Four of the seven items in this subscale received scores that were less<br />
than “minimal” on the seven-point scale, with two other items only slightly<br />
better than “minimal.”<br />
6 <strong>North</strong> <strong>Carolina</strong> <strong>Rated</strong> <strong>License</strong> <strong>Assessment</strong> <strong>Project</strong> / Executive Summary 1999–2002
TABLE 5<br />
ITERS Personal Care Routines Subscale<br />
Items<br />
Average Score<br />
6. Greeting/departing 6.48<br />
7. Meals/snacks 2.53<br />
8. Nap 3.15<br />
9. Diapering/toileting 2.69<br />
10. Personal grooming 3.21<br />
11. Health practices 2.40<br />
13. Safety practices 2.24<br />
School-Age Classrooms:<br />
School-age classrooms also<br />
achieved average marks of<br />
greater than 5 on three of<br />
the five subscales (see table<br />
6). However, once again the<br />
lowest subscale score in<br />
school-age classrooms was<br />
on the Health and Safety<br />
subscale, yet the average<br />
score was noticeably higher<br />
than in the infant/toddler<br />
and preschool classrooms.<br />
Table 7 provides an examination of the Health and Safety subscale and<br />
shows that two items were significantly lower than the other items scored. In<br />
particular, the items focusing on Safety Practices (item 15) and Meals/snacks<br />
(item 18) received the lowest average scores for this subscale which were<br />
categorized between “inadequate” and “minimal” on the SACERS scale.<br />
TABLE 6<br />
SACERS Subscales Scores<br />
Subscale<br />
Average Score<br />
Space and Furnishings 5.38<br />
Health and Safety 4.44<br />
Activities 4.83<br />
Interactions 5.59<br />
Program Structure 5.88<br />
<strong>North</strong> <strong>Carolina</strong> <strong>Rated</strong> <strong>License</strong> <strong>Assessment</strong> <strong>Project</strong> / Executive Summary 1999–2002 7
TABLE 7<br />
SACERS Health and Safety Item Means<br />
Items<br />
Average Score<br />
13. Health practices 5.86<br />
15. Safety practices 2.15<br />
16. Attendance 5.86<br />
17. Departure 5.91<br />
18. Meals/snacks 2.83<br />
19. Personal hygiene 4.07<br />
Family Child Care Homes: Less than 12<br />
percent of child care homes in the state have<br />
been assessed thus far (n = 806 assessments<br />
completed). <strong>The</strong> average score on the FDCRS<br />
was 5.08 or a rating of “good” on the scale.<br />
Indeed, table 8 shows that four of the five<br />
subscale scores received average scores of 5.0 or<br />
higher.<br />
Table 9 shows that, in contrast to the<br />
exceptionally high average score for the Arriving/<br />
leaving item, all of the remaining items in the<br />
Basic Care subscale were categorized as lower<br />
than “good” quality. Specifically, four of the subscale items were categorized<br />
between “minimal” and “good” (items 8, 9, 11, and 12). <strong>The</strong> items focusing<br />
on Diapering/toileting (item 10) and Safety practices (item 13) received the<br />
lowest average scores for this subscale (between “inadequate” and “minimal”<br />
on the FDCRS scale).<br />
TABLE 8<br />
FDCRS Subscales Scores<br />
Subscale<br />
Average Score<br />
Space and Furnishings 5.13<br />
Basic Care 3.96<br />
Language-Reasoning 5.46<br />
Learning Activities 5.54<br />
Social Development 5.50<br />
8 <strong>North</strong> <strong>Carolina</strong> <strong>Rated</strong> <strong>License</strong> <strong>Assessment</strong> <strong>Project</strong> / Executive Summary 1999–2002
TABLE 9<br />
FDCRS Basic Care Item Means<br />
Items<br />
Average Score<br />
7. Arriving/leaving 6.94<br />
8. Meals/snacks 3.01<br />
9. Nap/rest 4.85<br />
10. Diapering/toileting 2.80<br />
11. Personal grooming 3.51<br />
12. Health 4.36<br />
13. Safety 2.22<br />
Teacher Education and Program Quality<br />
In addition to the rating scale data, information about teacher/provider<br />
education was collected to explore the relationship between education of the<br />
teacher/provider and the score received on the rating scale. Our findings<br />
provide compelling evidence of an increase in rating scale scores in child care<br />
centers with increasing levels<br />
of teacher education. As seen<br />
in the tables 10A and 10B,<br />
there was a clear connection<br />
between rating scale scores<br />
and the amount of education<br />
that a teacher had completed.<br />
When all of the center-based<br />
assessments were combined,<br />
we found that two years of<br />
college (and higher) yielded<br />
significantly higher rating<br />
scale scores than high school<br />
and some college. A two-year degree was shown to be necessary for a score of<br />
“good” to be achieved on the rating scales. In family child care homes,<br />
although statistical differences between education groups were not found, our<br />
findings suggest a gradual increase in rating scale scores when home providers<br />
have more education.<br />
<strong>North</strong> <strong>Carolina</strong> <strong>Rated</strong> <strong>License</strong> <strong>Assessment</strong> <strong>Project</strong> / Executive Summary 1999–2002 9
TABLE 10A<br />
Center-Based Care: Rating Scale Average Scores By Education<br />
Education Level Combined Average Scores<br />
High School 4.72<br />
Some College 4.81<br />
2-Year Degree 5.05<br />
4-Year Related Degree 5.18<br />
4-Year Degree in CD/ECE 5.26<br />
Graduate Work 5.27<br />
TABLE 10B<br />
Home-Based Care: Rating Scale Average Scores By Education<br />
Education Level Average Scores<br />
High School 4.87<br />
Some College 5.08<br />
2-Year Degree 5.09<br />
4-Year Related Degree 5.24<br />
4-Year Degree in CD/ECE 5.27<br />
Graduate Work 5.01<br />
10 2 <strong>North</strong> <strong>Carolina</strong> <strong>Rated</strong> <strong>License</strong> <strong>Assessment</strong> <strong>Project</strong> / Executive Summary 1999–2002
Recommendations to Improve<br />
Child Care Quality<br />
<strong>The</strong> <strong>North</strong> <strong>Carolina</strong> <strong>Rated</strong> <strong>License</strong> <strong>Assessment</strong> <strong>Project</strong> recommends the<br />
following to continue the improvement of care and education that<br />
young children receive in our state.<br />
➊ Help providers better understand the connection between their<br />
ability to provide high quality care and the assessment process:<br />
More effort should be given to familiarize providers with the nature<br />
and scope of the<br />
Environment Rating<br />
Scale assessment process.<br />
This knowledge, when<br />
coupled with ongoing<br />
and long-term quality<br />
enhancement efforts, can<br />
enable providers to offer<br />
developmentally<br />
appropriate care and<br />
education programs.<br />
➋ Increase the availability of assessments for providers: <strong>The</strong><br />
opportunity for rating scale assessments should be available to a<br />
greater number of facilities, including all programs attempting three,<br />
four, or five stars on the <strong>North</strong> <strong>Carolina</strong> Star <strong>Rated</strong> <strong>License</strong>.<br />
<strong>Assessment</strong>s provide individualized, objective, and specific feedback<br />
to providers to improve program quality. Increasing availability to a<br />
greater number of facilities will ensure that more children receive<br />
high quality care.<br />
➌ Shorten the period between assessments: When additional<br />
resources are available, rating scale assessments should be conducted<br />
annually. Because programs routinely experience a great deal of<br />
change and all programs in <strong>North</strong> <strong>Carolina</strong> can benefit from the<br />
assessment process, a three-year delay in reassessing facilities may be<br />
excessive.<br />
<strong>North</strong> <strong>Carolina</strong> <strong>Rated</strong> <strong>License</strong> <strong>Assessment</strong> <strong>Project</strong> / Executive Summary 1999–2002 11
➍ Enhance provider’s knowledge of health and safety: Results of<br />
assessments should continue to be used to determine areas that need<br />
to be improved in child care facilities. In particular, current data<br />
indicate that quality improvement efforts should focus on health and<br />
safety practices. <strong>The</strong>se efforts should assist providers in accessing<br />
resources to improve their health and safety practices.<br />
➎ Increase incentives to encourage<br />
providers to achieve higher star ratings:<br />
Tangible incentives for achieving higher<br />
star ratings should be made available to<br />
encourage providers, particularly those in<br />
family child care homes, to apply for and<br />
complete assessments. Initiatives should<br />
be developed, as funds become available,<br />
to increase incentives to have<br />
assessments completed for all providers<br />
in homes and centers.<br />
➏ Reexamine the points-per-category<br />
system to ensure quality: <strong>The</strong> current point system allows for a wide<br />
range of quality even at the five-star level. <strong>The</strong> points-per-category<br />
system should be reviewed to ensure a high standard of quality,<br />
particularly at the four- and five-star levels.<br />
➐ Encourage providers’ educational pursuits: <strong>The</strong> <strong>North</strong> <strong>Carolina</strong><br />
Star <strong>Rated</strong> <strong>License</strong> currently recognizes education as a key<br />
component of classroom quality, and the results presented here<br />
provide additional evidence of the importance of teacher education.<br />
Results indicated that a score of 5, which is recognized as indicative<br />
of developmentally appropriate practice on the rating scales, was<br />
achieved on average at the two-year degree level of education for<br />
classrooms in child care centers. <strong>The</strong>refore, providers should<br />
continue their educational pursuits. <strong>The</strong> state of <strong>North</strong> <strong>Carolina</strong><br />
must continue to fund such initiatives as the T.E.A.C.H. © Early<br />
Childhood <strong>Project</strong> and WAGES.<br />
12 <strong>North</strong> <strong>Carolina</strong> <strong>Rated</strong> <strong>License</strong> <strong>Assessment</strong> <strong>Project</strong> / Executive Summary 1999–2002
<strong>North</strong> <strong>Carolina</strong> <strong>Rated</strong><br />
<strong>License</strong> <strong>Assessment</strong> <strong>Project</strong><br />
NCRLAP Main Office:<br />
<strong>University</strong> of <strong>North</strong> <strong>Carolina</strong> at Greensboro<br />
Department of Human Development and Family Studies<br />
P.O. Box 26170<br />
Greensboro, NC 27402<br />
Phone: 336-256-0100 Fax: 336-256-0102<br />
www.ncrlap.org<br />
Regional Offices:<br />
Appalachian State <strong>University</strong> — 828-262-6929<br />
East <strong>Carolina</strong> <strong>University</strong> — 252-328-1354<br />
<strong>North</strong> <strong>Carolina</strong> Central <strong>University</strong> — 919-530-7142<br />
UNC–Charlotte — 704-687-4544<br />
UNC–Wilmington — 910-962-7605<br />
Western <strong>Carolina</strong> <strong>University</strong> — 828-227-2185<br />
In collaboration with:<br />
UNC–Chapel Hill (FPG) — 919-843-5131<br />
4,000 copies of this booklet was created at a cost of $.65 per copy.<br />
(Version 5/1/03)