Psychology 2020 Introduction to Psychological Methods
Psychology 2020 Introduction to Psychological Methods
Psychology 2020 Introduction to Psychological Methods

You also want an ePaper? Increase the reach of your titles
YUMPU automatically turns print PDFs into web optimized ePapers that Google loves.
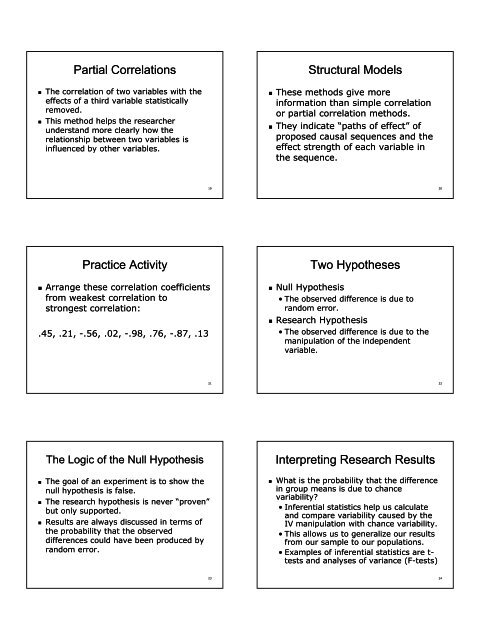
Partial Correlations<br />
• The correlation of two variables with the<br />
effects of a third variable statistically<br />
removed.<br />
• This method helps the researcher<br />
understand more clearly how the<br />
relationship between two variables is<br />
influenced by other variables.<br />
Structural Models<br />
• These methods give more<br />
information than simple correlation<br />
or partial correlation methods.<br />
• They indicate “paths of effect” of<br />
proposed causal sequences and the<br />
effect strength of each variable in<br />
the sequence.<br />
19<br />
20<br />
Practice Activity<br />
• Arrange these correlation coefficients<br />
from weakest correlation <strong>to</strong><br />
strongest correlation:<br />
.45, .21, -.56, .02, -.98, .76, -.87, .13<br />
Two Hypotheses<br />
• Null Hypothesis<br />
• The observed difference is due <strong>to</strong><br />
random error.<br />
• Research Hypothesis<br />
• The observed difference is due <strong>to</strong> the<br />
manipulation of the independent<br />
variable.<br />
21<br />
22<br />
The Logic of the Null Hypothesis<br />
• The goal of an experiment is <strong>to</strong> show the<br />
null hypothesis is false.<br />
• The research hypothesis is never “proven”<br />
but only supported.<br />
• Results are always discussed in terms of<br />
the probability that the observed<br />
differences could have been produced by<br />
random error.<br />
Interpreting Research Results<br />
• What is the probability that the difference<br />
in group means is due <strong>to</strong> chance<br />
variability?<br />
• Inferential statistics help us calculate<br />
and compare variability caused by the<br />
IV manipulation with chance variability.<br />
• This allows us <strong>to</strong> generalize our results<br />
from our sample <strong>to</strong> our populations.<br />
• Examples of inferential statistics are t-<br />
tests and analyses of variance (F-tests)<br />
23<br />
24