Presentation Slides - SATS
Presentation Slides - SATS
Presentation Slides - SATS

You also want an ePaper? Increase the reach of your titles
YUMPU automatically turns print PDFs into web optimized ePapers that Google loves.
4Q and FY12/13 Performance Review<br />
15 May 2013
Forward Looking Statements<br />
This presentation may contain forward-looking statements regarding,<br />
among other things, the Company's outlook, business and strategy which<br />
are current as of the date they are made. These forward-looking<br />
statements are based largely on the current assumptions, expectations<br />
and projections of the directors and management of <strong>SATS</strong> about our<br />
business, and the industry and markets in which we operate. These<br />
statements are not guarantees of <strong>SATS</strong>’ future performance and are<br />
subject to a number of risks and uncertainties, some of which are beyond<br />
the Company's control and are difficult to predict. Future developments<br />
and actual results could differ materially from those expressed in the<br />
forward-looking statements. In light of these risks and uncertainties, there<br />
can be no assurance that the forward-looking information will prove to be<br />
accurate. <strong>SATS</strong> does not undertake to update these forward-looking<br />
statements to reflect events or circumstances which arise after publication.<br />
2
Agenda<br />
• Financial highlights<br />
• Group financial review<br />
• Group business review<br />
• Outlook<br />
3
4Q12/13 Highlights<br />
Revenue • Higher revenue due to steady growth momentum in gateway<br />
(+7.7%) and food (+1.4%) businesses.<br />
$449.0m +3.6%<br />
Operating Profit • Despite a 2.6% increase in operating expenditure, operating profit<br />
rose 12% to $54.1m.<br />
$54.1m +12.0%<br />
Share of results of<br />
Associates/JVs, net of tax<br />
$18.5m +76.2%<br />
• Higher share of results of associates/JVs attributed to higher<br />
profit contributions from associates in all regions.<br />
PATMI • PATMI declined 7.8% to $46.2m due to a $16.8m provision for<br />
$46.2m -7.8%<br />
impairment of Daniels’ deferred consideration.<br />
• Excluding this impairment and gain arising from early retirement<br />
of sale and leaseback arrangement in 4Q12, underlying net profit<br />
grew 32.4% to $63m.<br />
4
FY12/13 Highlights<br />
Revenue • Higher revenue driven by organic growth in gateway (+7.6%) and<br />
food (+8.1%) businesses.<br />
$1,819.0m +7.9%<br />
Operating Profit • Operating profit increased due mainly to better performance of<br />
food business, including TFK.<br />
$192.3m +13.8%<br />
Share of results of<br />
Associates/JVs, net of tax<br />
$52.7m +27.9%<br />
• Higher profit contributions from associates/JVs in North and<br />
Southeast Asia saw higher share of results of associates/JVs.<br />
PATMI • Due to provision for impairment of Daniels’ deferred<br />
$184.8m +8.1%<br />
consideration, PATMI grew at a lower rate of 8.1% to $184.8m.<br />
• Excluding Daniels’ loss in FY11/12 and one-off items, underlying<br />
net profit improved 13.8% to $202m.<br />
Debt-to-equity • Debt-to-equity ratio remained healthy.<br />
• Cash balance was $404.2m as at 31 March 2013.<br />
0.09 times -0.01 ppt • Free cash flow generated during the year was $208.1m.<br />
5
Group Financial Review<br />
6
4Q and FY12/13 Financials<br />
$M 4Q12/13 4Q11/12 % Change FY12/13 FY11/12 % Change<br />
Operating Revenue 449.0 433.3 3.6 1,819.0 1,685.4 7.9<br />
Operating Expenditure (394.9) (385.0) 2.6 (1,626.7) (1,516.4) 7.3<br />
Operating Profit 54.1 48.3 12.0 192.3 169.0 13.8<br />
EBITDA 77.2 73.3 5.3 285.2 264.8 7.7<br />
Share of Results of<br />
Associates/JVs, Net of Tax<br />
Other Non-Operating<br />
Income/Expenses<br />
18.5 10.5 76.2 52.7 41.2 27.9<br />
(17.0) 3.3 n.m. (20.5) 11.6 n.m.<br />
PBT from Continuing Operations 55.6 62.1 (10.5) 224.5 221.8 1.2<br />
Profit from Continuing Operations,<br />
Net of Tax & Non-Controlling<br />
Interests<br />
Loss from Discontinued<br />
Operations, Net of Tax<br />
46.2 50.1 (7.8) 184.8 181.0 2.1<br />
- - - - (10.1) n.m.<br />
PATMI 46.2 50.1 (7.8) 184.8 170.9 8.1<br />
Underlying Net Profit from<br />
Continuing Operations<br />
63.0 47.6 32.4 202.0 177.5 13.8<br />
n.m. – not meaningful<br />
7
Impairment of Daniels’ Deferred Consideration<br />
• Took a $16.8m one-off provision for impairment of Daniels’ deferred<br />
consideration receivable.<br />
• This receivable is contingent on Daniels’ FY12 and FY13 EBITDA exceeding<br />
the agreed annual target of £19.245m.<br />
Recap of Daniels Divestment:<br />
• Aggregate sales consideration comprised of:<br />
- £150m consideration received<br />
- Deferred consideration of up to £13m in the event that Daniels met its EBITDA<br />
target over two-year period<br />
• Sale consideration estimated at £159m after accounting for fair value of<br />
deferred consideration.<br />
• Deferred consideration earn-out formula: 3 x (FY EBITDA - £19.245m).<br />
- No earn-out, no clawback if EBITDA target was not achieved<br />
• Recorded loss on disposal of S$5.5m in 3Q12.<br />
8
Underlying Net Profit from Continuing Ops<br />
$M 4Q12/13 4Q11/12 FY12/13 FY11/12<br />
Profit Attributable to Owners of the Company 46.2 50.1 184.8 170.9<br />
Adjustment for Discontinued Operations<br />
Loss/(Profit) from Daniels - - - 10.1<br />
One-offs:<br />
Write-back of TFK's Retirement Benefit Plan<br />
Obligations - - - (5.5)<br />
Loss/(Gain) on Early Retirement of Sale &<br />
Lease Back Arrangement - (2.5) - 2.0<br />
Loss on Disposal of Country Foods Macau - - 0.4 -<br />
Impairment of Daniels Deferred Consideration 16.8 - 16.8 -<br />
Underlying Net Profit from Continuing<br />
Operations 63.0 47.6 202.0 177.5<br />
9
Q-o-Q Highlights<br />
$M 4Q12/13 3Q12/13 2Q12/13 1Q12/13 4Q11/12<br />
Revenue 449.0 470.6 461.5 437.9 433.3<br />
% Change in Revenue -4.6% 2.0% 5.4% 1.1% -2.0%<br />
Expenditure (394.9) (423.8) (409.4) (398.6) (385.0)<br />
Operating Profit 54.1 46.8 52.1 39.3 48.3<br />
% Change in Operating Profit 15.6% -10.2% 32.6% -18.6% 10.3%<br />
EBITDA 77.2 70.6 75.5 61.9 73.3<br />
Share of Results of Associates/JVs, Net of Tax 18.5 12.1 10.4 11.7 10.5<br />
PBT from Continuing Operations 55.6 57.2 61.0 50.7 62.1<br />
Profit from Continuing Operations, Net of Tax & Non-<br />
Controlling Interests<br />
46.2 47.0 50.3 41.3 50.1<br />
Loss from Discontinued Operations, Net of Tax - - - - -<br />
PATMI 46.2 47.0 50.3 41.3 50.1<br />
% Change in PATMI -1.7% -6.6% 21.8% -17.6% 31.2%<br />
Underlying Net Profit from Continuing<br />
Operations<br />
63.0 47.0 50.7 41.3 47.6<br />
% Change in Underlying Net Profit 34.0% -7.3% 22.8% -13.2% 8.9%<br />
10
Financial Indicators<br />
% 4Q12/13 4Q11/12<br />
Change<br />
(ppt) FY12/13 FY11/12<br />
Change<br />
(ppt)<br />
Operating Margin 12.0 11.1 0.9 10.6 10.0 0.6<br />
EBITDA Margin 17.2 16.9 0.3 15.7 15.7 -<br />
PBT Margin 12.4 14.3 (1.9) 12.3 13.2 (0.9)<br />
PATMI Margin 10.3 11.6 (1.3) 10.2 10.1 0.1<br />
Underlying Net Margin 14.0 11.0 3.0 11.1 10.5 0.6<br />
Cents 4Q12/13 4Q11/12<br />
%<br />
Change FY12/13 FY11/12<br />
%<br />
Change<br />
EPS Based on Net Profit<br />
Attributable to Shareholders<br />
4.2 4.5 (6.7) 16.6 15.4 7.8<br />
EPS Based on Net Profit from<br />
Continuing Operations<br />
Attributable to Shareholders<br />
4.2 4.5 (6.7) 16.6 16.3 1.8<br />
31-Mar-13 31-Mar-12<br />
NAV Per Share ($) 1.26 1.36<br />
Debt Equity Ratio 0.09 0.10<br />
Margins are calculated based on profits from continuing operations.<br />
11
Group Segmental Revenue<br />
$M 4Q12/13 4Q11/12 % Change FY12/13 FY11/12 % Change<br />
By Business:<br />
Gateway Services 165.3 153.5 7.7 648.7 602.7 7.6<br />
Food Solutions 282.3 278.3 1.4 1,164.7 1,077.0 8.1<br />
Corporate 1.4 1.5 (6.7) 5.6 5.7 (1.8)<br />
Total 449.0 433.3 3.6 1,819.0 1,685.4 7.9<br />
By Industry:<br />
Aviation 363.2 351.9 3.2 1,476.1 1,357.6 8.7<br />
Non-Aviation 84.4 79.9 5.6 337.3 322.1 4.7<br />
Corporate 1.4 1.5 (6.7) 5.6 5.7 (1.8)<br />
Total 449.0 433.3 3.6 1,819.0 1,685.4 7.9<br />
By Geographical Location:<br />
Singapore 350.3 326.1 7.4 1,389.9 1,298.5 7.0<br />
Japan 78.1 81.5 (4.2) 334.4 302.6 10.5<br />
Others 20.6 25.7 (19.8) 94.7 84.3 12.3<br />
Total 449.0 433.3 3.6 1,819.0 1,685.4 7.9<br />
12
Group Expenditure – 4Q12/13<br />
Including TFK<br />
Excluding TFK<br />
$M 4Q12/13 4Q11/12 % Change 4Q12/13 4Q11/12 % Change<br />
Staff Costs 179.3 169.1 6.0 144.6 134.3 7.7<br />
Cost of Raw Materials 97.5 96.3 1.2 71.6 70.0 2.3<br />
Licensing Fees 19.2 18.1 6.1 18.7 17.7 5.6<br />
Depreciation & Amortisation 23.5 26.2 (10.3) 20.2 21.7 (6.9)<br />
Company Premise & Utilities 31.3 31.6 (0.9) 25.6 25.4 0.8<br />
Other Costs 44.1 43.7 0.9 38.2 37.8 1.1<br />
Total Expenditure 394.9 385.0 2.6 318.9 306.9 3.9<br />
Revenue 449.0 433.3 3.6 370.9 351.8 5.4<br />
Excluding TFK’s expenses, group expenditure increased 3.9% y-o-y<br />
against revenue growth of 5.4%<br />
13
Group Expenditure – FY12/13<br />
Including TFK<br />
Excluding TFK<br />
$M FY12/13 FY11/12 % Change FY12/13 FY11/12 % Change<br />
Staff Costs 765.5 697.0 9.8 617.3 559.8 10.3<br />
Cost of Raw Materials 393.0 370.7 6.0 284.1 271.7 4.6<br />
Licensing Fees 77.0 70.3 9.5 75.2 68.8 9.3<br />
Depreciation & Amortisation 92.9 97.4 (4.6) 79.3 79.7 (0.5)<br />
Company Premise & Utilities 130.5 123.7 5.5 105.7 99.6 6.1<br />
Other Costs 167.8 157.3 6.7 142.8 134.5 6.2<br />
Total Expenditure 1,626.7 1,516.4 7.3 1,304.4 1,214.1 7.4<br />
Revenue 1,819.0 1,685.4 7.9 1,484.6 1,382.8 7.4<br />
14
Associates/JVs Performance by Business –<br />
Based on <strong>SATS</strong>’ Shareholding*<br />
$M 4Q12/13 4Q11/12 % Change FY12/13 FY11/12 % Change<br />
Turnover 94.6 86.9 8.9 315.8 337.3 (6.4)<br />
Gateway Services 74.7 68.6 8.9 240.6 263.1 (8.6)<br />
Food Solutions 19.9 18.3 8.7 75.2 74.2 1.3<br />
EBITDA 24.1 16.1 49.7 83.6 77.4 8.0<br />
Gateway Services 21.7 14.6 48.6 74.0 71.2 3.9<br />
Food Solutions 2.4 1.5 60.0 9.6 6.2 54.8<br />
EBITDA Margin (%) 25.5 18.5 7.0 ppt 26.5 22.9 3.6 ppt<br />
Gateway Services 29.0 21.3 7.7 ppt 30.8 27.1 3.7 ppt<br />
Food Solutions 12.1 8.2 3.9 ppt 12.8 8.4 4.4 ppt<br />
PAT 18.6 10.5 77.1 52.9 41.7 26.9<br />
Gateway Services 17.1 11.2 52.7 48.8 41.1 18.7<br />
Food Solutions 1.5 (0.7) n.m. 4.1 0.6 n.m.<br />
Dividends Received - - - 24.6 23.2 6.0<br />
* Excludes TFK’s Associates<br />
n.m. – not meaningful<br />
15
Associates/JVs Performance by Region –<br />
Based on <strong>SATS</strong>’ Shareholding*<br />
$M 4Q12/13 4Q11/12 % Change FY12/13 FY11/12 % Change<br />
Turnover 94.6 86.9 8.9 315.8 337.3 (6.4)<br />
West Asia 32.0 26.3 21.7 81.5 103.3 (21.1)<br />
North Asia 45.5 45.1 0.9 170.7 174.3 (2.1)<br />
SEA & Australasia 17.1 15.5 10.3 63.6 59.7 6.5<br />
EBITDA 24.1 16.1 49.7 83.6 77.4 8.0<br />
West Asia 4.5 2.3 95.7 15.4 20.4 (24.5)<br />
North Asia 9.0 9.0 - 40.5 35.8 13.1<br />
SEA & Australasia 10.6 4.8 120.8 27.7 21.2 30.7<br />
EBITDA Margin (%) 25.5 18.5 7.0 ppt 26.5 22.9 3.6 ppt<br />
West Asia 14.1 8.7 5.4 ppt 18.9 19.7 (0.8) ppt<br />
North Asia 19.8 20.0 (0.2) ppt 23.7 20.5 3.2 ppt<br />
SEA & Australasia 62.0 31.0 31.0 ppt 43.6 35.5 8.1 ppt<br />
PAT 18.6 10.5 77.1 52.9 41.7 26.9<br />
West Asia 3.7 1.0 n.m. 9.9 10.7 (7.5)<br />
North Asia 6.5 4.8 35.4 23.5 15.6 50.6<br />
SEA & Australasia 8.4 4.7 78.7 19.5 15.4 26.6<br />
Dividends Received - - - 24.6 23.2 6.0<br />
* Excludes TK’s Associates<br />
n.m. – not meaningful<br />
16
Proforma Segmental Revenue (Include<br />
Proportionate Revenue from Assocs/JVs*)<br />
FY12/13<br />
By Business By Industry By Geography<br />
Food<br />
Solutions<br />
58.1%<br />
Corp<br />
0.2%<br />
Gateway<br />
Services<br />
41.7%<br />
Corp<br />
0.3%<br />
Non-<br />
Aviation<br />
15.8%<br />
Aviation<br />
83.9%<br />
Assoc/JVs<br />
14.8%<br />
Japan<br />
15.7%<br />
Others<br />
4.4%<br />
Singapore<br />
65.1%<br />
FY11/12<br />
Food<br />
Solutions<br />
56.9%<br />
Corp<br />
0.3%<br />
Gateway<br />
Services<br />
42.8%<br />
Non-<br />
Aviation<br />
15.9%<br />
Corp<br />
0.3%<br />
Aviation<br />
83.8%<br />
Assoc/JVs<br />
16.7%<br />
Japan<br />
14.9%<br />
Others<br />
4.2%<br />
Singapore<br />
64.2%<br />
* Excludes TFK’s Associates<br />
17
Group Balance Sheet<br />
$M As at 31 Mar 13 As at 31 Mar 12<br />
Total Equity 1,496.7 1,616.2<br />
Long-term Loans 108.7 131.3<br />
Other Long-Term Liabilities 89.7 102.7<br />
Current Liabilities 310.1 272.3<br />
Total Equity & Liabilities 2,005.2 2,122.5<br />
Fixed Assets & Investment Property 603.5 667.4<br />
Associated Companies & JVs 390.2 368.3<br />
Intangible Assets 192.9 213.0<br />
Other Non-Current Assets & Long-Term Investment 38.3 42.6<br />
Current Assets<br />
Cash & Short-Term Deposits 405.5 471.6<br />
Debtors & Other Current Assets 374.8 359.6<br />
Total Assets 2,005.2 2,122.5<br />
Decline in equity and cash & short-term deposits mainly attributed to<br />
dividend payments of $288.6m<br />
18
Group Cash Flow Statement<br />
$M FY12/13 FY11/12 Difference<br />
Net Cash from Operating Activities 245.9 168.0 77.9<br />
Net Cash generated from/(used in) Investing Activities (16.6) 224.5 (241.1)<br />
Net Cash used in Financing Activities (286.4) (215.9) (70.5)<br />
Net (decrease)/increase in Cash & Cash Equivalents (57.1) 176.6 (233.7)<br />
Cash & Cash Equivalents at the end of the period 404.2 470.1 (65.9)<br />
Free Cash Flow* 208.1 103.7 104.4<br />
Higher free cash flow attributed to higher cash flow from operating activities<br />
and lower capex incurred<br />
* Free Cash Flow refers to net cash from operating activities less cash purchases of capital expenditure.<br />
19
Operating Statistics for Singapore Aviation Business<br />
4Q12/13 4Q11/12 % Change FY12/13 FY11/12 % Change<br />
Passengers Handled ('M) 10.51 9.67 8.7 41.23 37.92 8.7<br />
Flights Handled ('000) 31.42 29.26 7.4 123.01 115.19 6.8<br />
Unit Services ('000) 26.67 24.31 9.7 103.80 95.88 8.3<br />
Cargo ('000 tonnes) 357.80 351.43 1.8 1,463.09 1,504.64 (2.8)<br />
Gross Meals Produced ('M) 6.94 6.70 3.6 28.26 26.50 6.6<br />
Unit Meals Produced ('M) 5.37 5.26 2.1 21.85 20.72 5.5<br />
All operating metrics grew y-o-y in 4Q FY12/13<br />
• The above aviation operating data cover Singapore operations only.<br />
• With the exception of unit and gross meals produced, all data include LCC operations.<br />
• Unit services in 9M11/12 has been restated due to the change in the weightage factor for certain aircraft<br />
type. As a result, the restated figure is higher than what was previously announced for 9M11/12.<br />
20
Dividends<br />
Cents FY12/13 FY11/12<br />
Interim Dividend 5.0 5.0<br />
Proposed Final Dividend* 6.0 6.0<br />
Total - Ordinary Dividends 11.0 11.0<br />
Proposed Special Dividend* 4.0 15.0<br />
Proposed Total Dividends 15.0 26.0<br />
Payout Ratio (%) - Ordinary Dividends 66.2% 71.4%<br />
Payout Ratio (%) - Total Dividends 90.3% 168.8%<br />
Book closure date is 7 August 2013 and payment is on 16 August 2013<br />
* Subject to shareholder’s approval at AGM to be held on 26 July 2013<br />
21
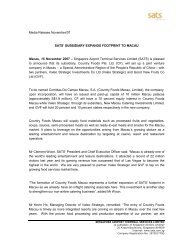
Dividend Payout Ratio<br />
180<br />
160<br />
168.8<br />
140<br />
%<br />
120<br />
100<br />
80<br />
98.4<br />
34.7<br />
97.4<br />
90.3<br />
24.1<br />
60<br />
40<br />
20<br />
73.5 78.6<br />
63.7<br />
71.4 66.2<br />
0<br />
FY08/09 FY09/10 FY10/11 FY11/12 FY12/13<br />
Ordinary dividend<br />
Special dividend<br />
22
Group Business Review<br />
23
Recent Contracts<br />
Singapore – Gateway Services<br />
• Ground handling for Saudi Arabian Airlines and Turkish Airlines.<br />
• Ground and cargo handling for Air India, Air India Express,<br />
Jet Airways, Lufthansa Cargo/AeroLogic, Sichuan Airlines,<br />
Swiss International Air Lines, United Airways and Xiamen Airlines.<br />
24
Recent Contracts<br />
Singapore – Food Solutions<br />
• Inflight catering services for All Nippon Airways.<br />
• Catering and F&B services for Singapore Sports Hub.<br />
Overseas<br />
• TFK: inflight catering services for Air France.<br />
• <strong>SATS</strong> HK: ground handling services for Air Seychelles.<br />
25
Business and Corporate Updates<br />
Key Management Appointments<br />
• Appointed Mr Alexander Charles Hungate as Executive Director<br />
effective 16 July 2013 and subsequently as President & CEO effective<br />
1 January 2014.<br />
• Appointed Mr Cho Wee Peng as CFO effective 1 July 2013.<br />
Accolades<br />
• <strong>SATS</strong> won a distinction award at the inaugural Human Capital<br />
Breakthrough Award for being one of Singapore’s boldest and most<br />
innovative companies in the field of people management.<br />
• AI<strong>SATS</strong> Bangalore Cargo won the “Air Cargo Terminal Operator of the<br />
Year in India” for second consecutive year at the Indian Supply Chain<br />
and Logistics Summit and Excellence Awards 2013.<br />
26
Business and Corporate Updates<br />
Accolades (continued)<br />
• AI<strong>SATS</strong> Bangalore Ground Handling clinched Dragonair’s networkwide<br />
awards including “Best Station for On-Time Performance”,<br />
“Best Station Self Service Kiosk Check-In” and “Best Ground<br />
Handling Agent for Ramp Services”.<br />
• Asia Pacific Star received a Special Commendation Award from<br />
Tiger Airways for migration of operations from Budget Terminal to<br />
Terminal 2.<br />
• MacroAsia Catering Services received the “2012 Silver Award for<br />
Catering” from Dragonair for outstanding and reliable catering<br />
services.<br />
• Asiana Airlines presented its Singapore station, which is supported<br />
by <strong>SATS</strong> Catering, with the “Best Improvement of 2012 Award”.<br />
27
Outlook<br />
28
Outlook<br />
The continued growth of passenger traffic at Singapore Changi Airport<br />
and the robust intra-Asia traffic will provide opportunities for the<br />
Group’s gateway and food businesses. Air freight demand, however, is<br />
anticipated to remain weak.<br />
The continuing manpower policies in Singapore and their impact on<br />
operating costs remain major challenges for <strong>SATS</strong>.<br />
The Group continues to seek new growth areas by expanding its<br />
offerings and regional footprint.<br />
29
END<br />
30