NYS Invitational Science Olympiad April 2005 7
NYS Invitational Science Olympiad April 2005 7
NYS Invitational Science Olympiad April 2005 7

Create successful ePaper yourself
Turn your PDF publications into a flip-book with our unique Google optimized e-Paper software.
<strong>NYS</strong> <strong>Invitational</strong> <strong>Science</strong> <strong>Olympiad</strong> <strong>April</strong> <strong>2005</strong><br />
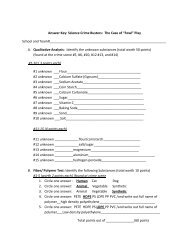
Figure 15:<br />
Topographic Map of<br />
Mt Jackson, Colorado.<br />
Contour Interval = 40 ft<br />
Horizontal Scale:<br />
1 inch = 2000 ft<br />
1: 24, 000<br />
Glacial features<br />
identified by letters A, B,<br />
C, and D.<br />
38. The arrow labeled with the Letter "A" is pointing toward Avalanche Peak. This is an example of<br />
what type of landform?<br />
39. a. The letter "B" is on a landform that extends from This is an example of what type of<br />
landform type of landform is this an example of?<br />
b. How did the shape and spacing of the contour lines help you determine the type of<br />
landform?<br />
40. a. What is the name for the landform to the south, south-southeast and south-southwest<br />
of the letter "C" shown with brown contour lines?<br />
b. What is the name of the type of lake at C?<br />
41. The letter "D" is in a valley. Draw a sketch showing a profile across the valley.<br />
7
<strong>NYS</strong> <strong>Invitational</strong> <strong>Science</strong> <strong>Olympiad</strong> <strong>April</strong> <strong>2005</strong><br />
The Table below provides information on the size (area in km2) of the Sperry Glacier from<br />
1901- 1979 (Carrara & McGimsey, 1988).<br />
Year Area (km 2 )<br />
1901 3.71<br />
1913 3.41<br />
1927 1.99<br />
1938 1.71<br />
1946 1.50<br />
1950 1.29<br />
1960 1.24<br />
1966 1.12<br />
1979 1.06<br />
42. What has happened to the area of the Sperry Glacier from 1901 – 1979?<br />
43. What is the relationship between ablation and accumulation for the Sperry Glacier?<br />
44. What does this indicate about climatic conditions during this period?<br />
45. Although the data indicate glacial retreat throughout the 20 th century, rocks have been<br />
observed moving forward on the glacier. Explain how rocks can be moving forward while the<br />
glacier is shrinking?<br />
46. The causes of the Ice Ages are still debated by scientists. Identify two theories glaciologists<br />
believe to be responsible for the Ice Ages.<br />
8
<strong>NYS</strong> <strong>Invitational</strong> <strong>Science</strong> <strong>Olympiad</strong> <strong>April</strong> <strong>2005</strong><br />
Wisconsinin<br />
Ice Age<br />
Age<br />
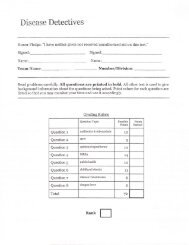
Figure 16: Temperature and carbon dioxide (C0 2 ) data were obtained from the Vostok Ice Core<br />
drilled in Antarctica. These graphs illustrate how temperatures and concentration of CO 2 fluctuated<br />
over the past 400,000 years. C0 2 concentration is measured in parts per million by volume (pomp)<br />
and temperature change is measured in degrees Celsius ( o C).<br />
(http://www.sierraclub.ca/national/programs/atmosphere-energy/climate-change/vostok-ice-core.jpg)<br />
47. Explain how scientists can determine the amounts of CO 2 in the atmosphere during the past<br />
400,000 years?<br />
48. What is the name of the geologic epoch that encompasses much of the past 400,000 years?<br />
49. Describe the relationship between carbon dioxide (CO 2 ) concentration and temperature trends<br />
during the past 400,000 years?<br />
9
<strong>NYS</strong> <strong>Invitational</strong> <strong>Science</strong> <strong>Olympiad</strong> <strong>April</strong> <strong>2005</strong><br />
50. Ice ages are identified by their cooler temperatures.<br />
a) When, according to the temperature graph, did the last ice age (Wisconsinin) end?<br />
b) What was the temperature difference in Antarctica at that time with respect to that of<br />
current temperatures?<br />
c) According to the data, approximately how long did the Wisconsinin Ice Age last?<br />
51. According to the data, how many Ice Ages have there been in the past 400,000 years?<br />
52. a. CO2 concentration in 2002 was 370 ppmv. If current trends continue, what will be the<br />
effect on the world’s glaciers?<br />
b. Describe the effect this trend might have upon the coastal areas of the world?<br />
Credit. This exam was created by and submitted for publication on The Wright<br />
Center website by Gary Vorwald, New York State <strong>Science</strong> <strong>Olympiad</strong> Dynamic Planet<br />
Event Supervisor.<br />
10