Analysis of Wind Power Ancillary Services Characteristics ... - NREL
Analysis of Wind Power Ancillary Services Characteristics ... - NREL
Analysis of Wind Power Ancillary Services Characteristics ... - NREL

Create successful ePaper yourself
Turn your PDF publications into a flip-book with our unique Google optimized e-Paper software.
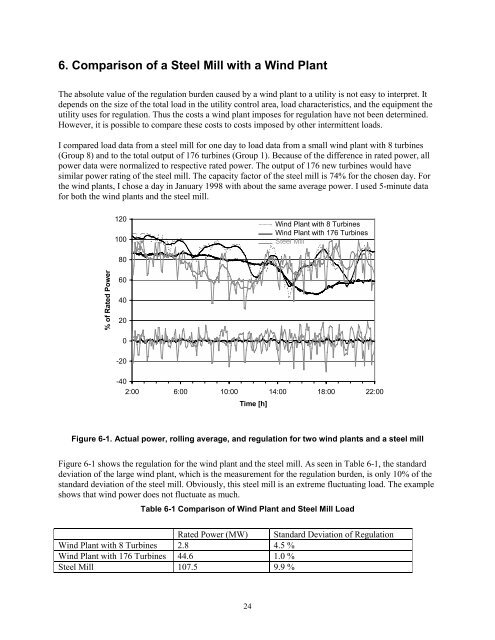
6. Comparison <strong>of</strong> a Steel Mill with a <strong>Wind</strong> Plant<br />
The absolute value <strong>of</strong> the regulation burden caused by a wind plant to a utility is not easy to interpret. It<br />
depends on the size <strong>of</strong> the total load in the utility control area, load characteristics, and the equipment the<br />
utility uses for regulation. Thus the costs a wind plant imposes for regulation have not been determined.<br />
However, it is possible to compare these costs to costs imposed by other intermittent loads.<br />
I compared load data from a steel mill for one day to load data from a small wind plant with 8 turbines<br />
(Group 8) and to the total output <strong>of</strong> 176 turbines (Group 1). Because <strong>of</strong> the difference in rated power, all<br />
power data were normalized to respective rated power. The output <strong>of</strong> 176 new turbines would have<br />
similar power rating <strong>of</strong> the steel mill. The capacity factor <strong>of</strong> the steel mill is 74% for the chosen day. For<br />
the wind plants, I chose a day in January 1998 with about the same average power. I used 5-minute data<br />
for both the wind plants and the steel mill.<br />
120<br />
100<br />
<strong>Wind</strong> Plant with 8 Turbines<br />
<strong>Wind</strong> Plant with 176 Turbines<br />
Steel Mill<br />
80<br />
% <strong>of</strong> Rated <strong>Power</strong><br />
60<br />
40<br />
20<br />
0<br />
-20<br />
-40<br />
2:00 6:00 10:00 14:00 18:00 22:00<br />
Time [h]<br />
Figure 6-1. Actual power, rolling average, and regulation for two wind plants and a steel mill<br />
Figure 6-1 shows the regulation for the wind plant and the steel mill. As seen in Table 6-1, the standard<br />
deviation <strong>of</strong> the large wind plant, which is the measurement for the regulation burden, is only 10% <strong>of</strong> the<br />
standard deviation <strong>of</strong> the steel mill. Obviously, this steel mill is an extreme fluctuating load. The example<br />
shows that wind power does not fluctuate as much.<br />
Table 6-1 Comparison <strong>of</strong> <strong>Wind</strong> Plant and Steel Mill Load<br />
Rated <strong>Power</strong> (MW) Standard Deviation <strong>of</strong> Regulation<br />
<strong>Wind</strong> Plant with 8 Turbines 2.8 4.5 %<br />
<strong>Wind</strong> Plant with 176 Turbines 44.6 1.0 %<br />
Steel Mill 107.5 9.9 %<br />
24