Blenheim-Gilboa Pumped Storage Power Project Operations
Blenheim-Gilboa Pumped Storage Power Project Operations
Blenheim-Gilboa Pumped Storage Power Project Operations

You also want an ePaper? Increase the reach of your titles
YUMPU automatically turns print PDFs into web optimized ePapers that Google loves.
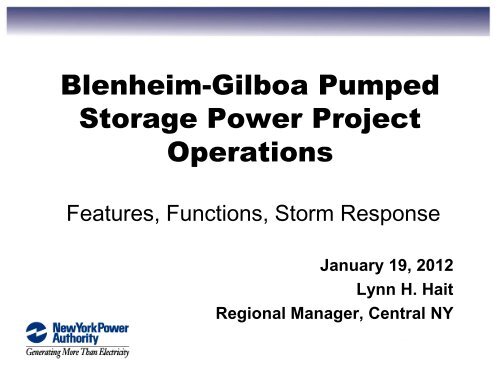
<strong>Blenheim</strong>-<strong>Gilboa</strong> <strong>Pumped</strong><br />
<strong>Storage</strong> <strong>Power</strong> <strong>Project</strong><br />
<strong>Operations</strong><br />
Features, Functions, Storm Response<br />
January 19, 2012<br />
Lynn H. Hait<br />
Regional Manager, Central NY
Overview<br />
• Welcome<br />
• Presentation Purpose<br />
• <strong>Blenheim</strong>-<strong>Gilboa</strong> <strong>Power</strong> <strong>Project</strong> Description<br />
• Water Flows and Flood Forecasting<br />
• Tropical Storm Irene Timeline & NYPA response<br />
• Questions from the Audience<br />
2
Presentation Purpose<br />
• Explain normal and emergency operations<br />
of this NYPA power plant<br />
• Clarify misinformation:<br />
– NYPA was not generating power during the storm<br />
– Plant not designed for flood mitigation<br />
• Review timeline of Tropical Storm Irene<br />
with NYPA actions and outcomes<br />
3
<strong>Blenheim</strong>-<strong>Gilboa</strong><br />
<strong>Pumped</strong> <strong>Storage</strong> <strong>Power</strong> <strong>Project</strong><br />
4
Schoharie Reservoir &<br />
<strong>Gilboa</strong> Dam<br />
Upper Reservoir<br />
<strong>Power</strong> Station<br />
Earthen Dam<br />
Spillway &Taintor Gates<br />
Lower Reservoir<br />
5
Upper Reservoir<br />
Generate<br />
<strong>Power</strong><br />
Pump<br />
(<strong>Storage</strong>)<br />
<strong>Power</strong> Station<br />
Lower Reservoir
Closed System: 40 ft. Operating Range<br />
Lower Reservoir<br />
At high level (pool)<br />
Lower Reservoir<br />
At low level (pool)<br />
7
Earthen Dam Design<br />
<strong>Blenheim</strong>-<strong>Gilboa</strong> <strong>Project</strong><br />
• Designed to hold back water with full lower<br />
reservoir, elevation of 900 ft.<br />
• Not designed for water to overtop dam. Dam’s<br />
nominal elevation was 910 ft.<br />
• Maximum outflow design for spillway was<br />
165,000 cubic feet per second (cfs) at 908.5 ft.<br />
• Taintor Gates used to regulate outflows following<br />
design of project<br />
8
<strong>Blenheim</strong>-<strong>Gilboa</strong> <strong>Project</strong> Spillway<br />
910 ft.<br />
over top<br />
Lower Reservoir<br />
Earthen Dam<br />
Valve<br />
Taintor<br />
Gates<br />
9
Spillway Operation<br />
• Orifice Flow – gates submerged<br />
– Normal mode of operation<br />
– Allows generation operation while controlling flow<br />
– Slightly lower flows than free discharge<br />
• Free discharge – gates out of water (“natural” operation)<br />
– Allows max discharge at a given reservoir elevation<br />
– Generation must be curtailed<br />
– Assures that when the reservoir elevation is constant or rising<br />
that discharge will be slightly lower than inflows<br />
10
Taintor Gate <strong>Operations</strong><br />
11
Taintor Gate <strong>Operations</strong><br />
• Gates open at 1 ft per minute<br />
– Requires 42 minutes to fully open, each gate<br />
• Redundant gate motor operators and gearboxes<br />
• Redundant power supplies to operate gates<br />
12
Water Flow and Flood Forecasting<br />
• Measured in cubic feet per second (cfs)<br />
• National Weather Service is the lead<br />
• Models are river-specific using:<br />
– Precipitation forecast<br />
– Actual precipitation amounts from radar, observers, collection<br />
equipment, and others<br />
– Actual flows from United States Geological Survey (USGS) stations and<br />
gages<br />
• All data is used to come up with an estimated flow in the creek,<br />
many variables can make actual flows deviate<br />
13
Real-Time Flood Forecasting<br />
During Tropical Storm Irene<br />
• Contact with National Weather Service and<br />
others<br />
• <strong>Project</strong>ed flows changed from 11,000 cfs to<br />
78,000 cfs in a few hours.<br />
• Flash flooding apparent on local roads, culverts<br />
and ditches<br />
• Heavy rains continue<br />
• Accuracy and condition of gages<br />
14
Hurricane / Tropical Storm Irene<br />
<strong>Project</strong>ion as of August 24, 2011<br />
15
<strong>Blenheim</strong> <strong>Gilboa</strong> Drainage Basin<br />
North<br />
<strong>Gilboa</strong> Dam<br />
(NYC DEP)<br />
<strong>Blenheim</strong>-<strong>Gilboa</strong><br />
<strong>Pumped</strong> <strong>Storage</strong><br />
<strong>Project</strong> (NYPA)<br />
Prattsville<br />
Hunter<br />
Basin area: 356 sq. miles<br />
16
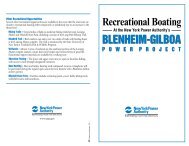
Rainfall Totals: August 27-30, 2011<br />
<strong>Blenheim</strong> <strong>Gilboa</strong><br />
Pump <strong>Storage</strong><br />
<strong>Project</strong> (NYPA)<br />
10.3<br />
12.2<br />
17
<strong>Operations</strong> During the Storm<br />
• Follow Emergency Action Plan (EAP) per training and<br />
procedures<br />
• Tropical Storm Irene = 500 year flood event<br />
• Manage record water inflows:<br />
– Focus on preventing over top of the earthen dam<br />
– Reduce outflow as much as possible within operating limits<br />
• Manage operational challenges, requiring redundant<br />
power supply for gate operation<br />
• Concern for employee, family and community safety<br />
18
Emergency Action Plan (EAP)<br />
• Annual and periodic training and drills conducted<br />
• Required, approved and monitored by Federal<br />
Energy Regulatory Commission<br />
– FERC attends drills<br />
• Type A: Failure is imminent or has occurred<br />
• Type B: A potentially hazardous situation is<br />
developing<br />
19
Flow Rate – Cubic Feet per Second (cfs)<br />
Tropical Storm Irene Response<br />
Sunday, 11:00 a.m.<br />
140,000<br />
120,000<br />
100,000<br />
NYPA Lower<br />
Reservoir<br />
910 ft. overtop<br />
80,000<br />
900 ft. full<br />
60,000<br />
40,000<br />
20,000<br />
865 ft.<br />
0<br />
Outflows<br />
Inflows<br />
11:00 11:20 11:40 12:00 12:20 12:40 1:00 1:20 1:40 2:00 2:20 2:40 3:00 3:20<br />
Sunday, August 28, 2011<br />
20
Flow Rate – Cubic Feet per Second (cfs)<br />
Tropical Storm Irene Response<br />
Sunday, 11:20 a.m.<br />
140,000<br />
120,000<br />
100,000<br />
NYPA Lower<br />
Reservoir<br />
910 ft. overtop<br />
80,000<br />
60,000<br />
40,000<br />
20,000<br />
0<br />
Outflows<br />
Inflows<br />
Opening<br />
Taintor<br />
Gates<br />
11:00 11:20 11:40 12:00 12:20 12:40 1:00 1:20 1:40 2:00 2:20 2:40 3:00 3:20<br />
Sunday, August 28, 2011<br />
900 ft. full<br />
876 ft.<br />
21
Flow Rate – Cubic Feet per Second (cfs)<br />
Tropical Storm Irene Response<br />
Sunday, 12:00 p.m.<br />
140,000<br />
120,000<br />
100,000<br />
<strong>Gilboa</strong> Dam<br />
EAP Type B<br />
Schoharie Cty<br />
sirens<br />
NYPA Lower<br />
Reservoir<br />
910 ft. overtop<br />
80,000<br />
900 ft. full<br />
60,000<br />
40,000<br />
20,000<br />
879 ft.<br />
0<br />
Outflows<br />
Inflows<br />
11:00 11:20 11:40 12:00 12:20 12:40 1:00 1:20 1:40 2:00 2:20 2:40 3:00 3:20<br />
Sunday, August 28, 2011<br />
22
Flow Rate – Cubic Feet per Second (cfs)<br />
Tropical Storm Irene Response<br />
Sunday, 12:20 p.m.<br />
140,000<br />
120,000<br />
100,000<br />
12:30<br />
Pumps<br />
start<br />
NYPA Lower<br />
Reservoir<br />
910 ft. overtop<br />
80,000<br />
900 ft. full<br />
60,000<br />
40,000<br />
879 ft.<br />
20,000<br />
0<br />
Outflows<br />
Inflows<br />
11:00 11:20 11:40 12:00 12:20 12:40 1:00 1:20 1:40 2:00 2:20 2:40 3:00 3:20<br />
Sunday, August 28, 2011<br />
23
Flow Rate – Cubic Feet per Second (cfs)<br />
Tropical Storm Irene Response<br />
Sunday, 12:40 p.m.<br />
140,000<br />
120,000<br />
100,000<br />
2 pumps<br />
online<br />
NYPA Lower<br />
Reservoir<br />
910 ft. overtop<br />
80,000<br />
60,000<br />
900 ft. full<br />
890 ft.<br />
40,000<br />
20,000<br />
0<br />
Outflows<br />
Inflows<br />
11:00 11:20 11:40 12:00 12:20 12:40 1:00 1:20 1:40 2:00 2:20 2:40 3:00 3:20<br />
Sunday, August 28, 2011<br />
24
Flow Rate – Cubic Feet per Second (cfs)<br />
Tropical Storm Irene Response<br />
Sunday, 1:00 p.m.<br />
140,000<br />
120,000<br />
100,000<br />
2 pumps online,<br />
2 gates open<br />
NYPA Lower<br />
Reservoir<br />
910 ft. overtop<br />
80,000<br />
60,000<br />
900 ft. full<br />
893 ft.<br />
40,000<br />
20,000<br />
0<br />
Outflows<br />
Inflows<br />
11:00 11:20 11:40 12:00 12:20 12:40 1:00 1:20 1:40 2:00 2:20 2:40 3:00 3:20<br />
Sunday, August 28, 2011<br />
25
Flow Rate – Cubic Feet per Second (cfs)<br />
Tropical Storm Irene Response<br />
Sunday, 1:20 p.m. – Peak Inflow<br />
140,000<br />
120,000<br />
100,000<br />
4 pumps online,<br />
all 3 gates open<br />
BG EAP<br />
Type B<br />
NYPA Lower<br />
Reservoir<br />
910 ft. overtop<br />
80,000<br />
60,000<br />
900 ft. full<br />
895 ft.<br />
40,000<br />
20,000<br />
0<br />
Outflows<br />
Inflows<br />
11:00 11:20 11:40 12:00 12:20 12:40 1:00 1:20 1:40 2:00 2:20 2:40 3:00 3:20<br />
Sunday, August 28, 2011<br />
26
Flow Rate – Cubic Feet per Second (cfs)<br />
Tropical Storm Irene Response<br />
Sunday, 1:40 p.m.<br />
140,000<br />
120,000<br />
100,000<br />
Peak Inflow drops<br />
Lower Res continues<br />
to fill<br />
NYPA Lower<br />
Reservoir<br />
910 ft. overtop<br />
80,000<br />
60,000<br />
900 ft. full<br />
895.4 ft.<br />
40,000<br />
20,000<br />
0<br />
Outflows<br />
Inflows<br />
11:00 11:20 11:40 12:00 12:20 12:40 1:00 1:20 1:40 2:00 2:20 2:40 3:00 3:20<br />
Sunday, August 28, 2011<br />
27
Flow Rate – Cubic Feet per Second (cfs)<br />
Tropical Storm Irene Response<br />
Sunday, 2:00 p.m.<br />
140,000<br />
120,000<br />
100,000<br />
NYPA Lower<br />
Reservoir<br />
910 ft. overtop<br />
80,000<br />
60,000<br />
900 ft. full<br />
896.2 ft.<br />
40,000<br />
20,000<br />
0<br />
Outflows<br />
Inflows<br />
11:00 11:20 11:40 12:00 12:20 12:40 1:00 1:20 1:40 2:00 2:20 2:40 3:00 3:20<br />
Sunday, August 28, 2011<br />
28
Flow Rate – Cubic Feet per Second (cfs)<br />
Tropical Storm Irene Response<br />
Sunday, 2:20 p.m.<br />
140,000<br />
120,000<br />
100,000<br />
NYPA Lower<br />
Reservoir<br />
910 ft. overtop<br />
80,000<br />
60,000<br />
900 ft. full<br />
896.8 ft.<br />
40,000<br />
20,000<br />
0<br />
Outflows<br />
Inflows<br />
11:00 11:20 11:40 12:00 12:20 12:40 1:00 1:20 1:40 2:00 2:20 2:40 3:00 3:20<br />
Sunday, August 28, 2011<br />
29
Flow Rate – Cubic Feet per Second (cfs)<br />
Tropical Storm Irene Response<br />
Sunday, 2:40 p.m.<br />
140,000<br />
120,000<br />
100,000<br />
NYPA Lower<br />
Reservoir<br />
910 ft. overtop<br />
80,000<br />
60,000<br />
900 ft. full<br />
897.5 ft.<br />
40,000<br />
20,000<br />
0<br />
Outflows<br />
Inflows<br />
11:00 11:20 11:40 12:00 12:20 12:40 1:00 1:20 1:40 2:00 2:20 2:40 3:00 3:20<br />
Sunday, August 28, 2011<br />
30
Flow Rate – Cubic Feet per Second (cfs)<br />
Tropical Storm Irene Response<br />
Sunday, 3:00 p.m.<br />
140,000<br />
120,000<br />
100,000<br />
NYPA Lower<br />
Reservoir<br />
910 ft. overtop<br />
80,000<br />
60,000<br />
900 ft. full<br />
898.3 ft.<br />
40,000<br />
20,000<br />
0<br />
Outflows<br />
Inflows<br />
11:00 11:20 11:40 12:00 12:20 12:40 1:00 1:20 1:40 2:00 2:20 2:40 3:00 3:20<br />
Sunday, August 28, 2011<br />
31
Flow Rate – Cubic Feet per Second (cfs)<br />
Tropical Storm Irene Response<br />
Sunday, 3:20 p.m.<br />
140,000<br />
120,000<br />
100,000<br />
1:20 pm Peak inflow: 129,135 cfs<br />
Peak outflow: 118,614 cfs 3:20 pm<br />
NYPA Lower<br />
Reservoir<br />
910 ft. overtop<br />
80,000<br />
60,000<br />
900 ft. full<br />
898.25 ft.<br />
40,000<br />
20,000<br />
0<br />
Outflows<br />
Inflows<br />
11:00 11:20 11:40 12:00 12:20 12:40 1:00 1:20 1:40 2:00 2:20 2:40 3:00 3:20<br />
Sunday, August 28, 2011<br />
32
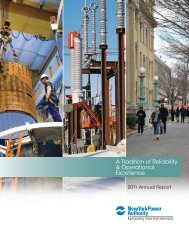
Flow Rate – Cubic Feet per Second (cfs)<br />
Water Flow Peak Shaved<br />
August 28, 2011<br />
Water inflow to NYPA project<br />
Water outflow from NYPA project<br />
Outflows<br />
Inflows<br />
11:20 am 1:20 pm 3:20 pm 5:20 pm 7:20 pm<br />
Sunday, August 28, 2011<br />
Monday, August 29, 2011<br />
33
Storm Comparisons<br />
Previous<br />
Flood of Record<br />
(1996)<br />
• Heavy rain at 60°F, melted<br />
over 4 ft. snow pack<br />
• January 1996<br />
• Peak inflow: 82,899 cfs<br />
• Peak outflow: 74,677 cfs<br />
Tropical Storm Irene<br />
New Flood of Record<br />
(2011)<br />
• Heavy rain at 1-inch per hr for 12<br />
hours. 16-18-inches localized<br />
• August 2011<br />
• Peak inflow: 129,135 cfs<br />
• Peak outflow: 118,614 cfs<br />
34
After the Storm<br />
• Gomez & Sullivan inspection<br />
• Army Corp of Engineers inspection<br />
• Bathymetric survey in December 2011<br />
– Conducted within normal operating parameter<br />
• Provided community assistance<br />
– Assistance to NYS DOT Route 30 Bridge repair<br />
– Assistance to neighboring communities<br />
• Evaluating communications infrastructure<br />
35
QUESTIONS?<br />
36