Annual Report Annual Report - NZX
Annual Report Annual Report - NZX
Annual Report Annual Report - NZX

Create successful ePaper yourself
Turn your PDF publications into a flip-book with our unique Google optimized e-Paper software.
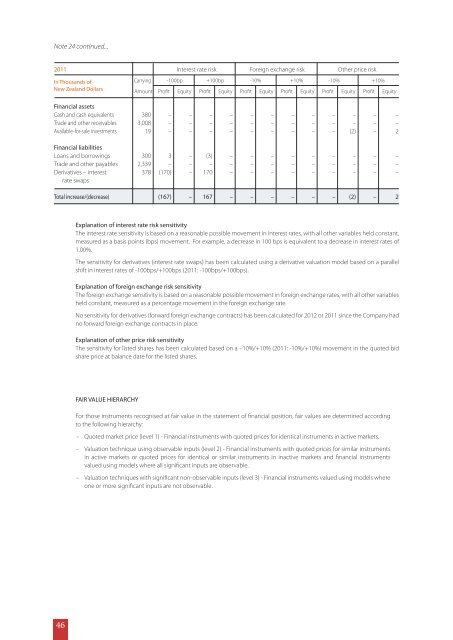
Note 24 continued...<br />
2011 Interest rate risk Foreign exchange risk Other price risk<br />
In Thousands of Carrying -100bp +100bp -10% +10% -10% +10%<br />
New Zealand Dollars Amount Profit Equity Profit Equity Profit Equity Profit Equity Profit Equity Profit Equity<br />
Financial assets<br />
Cash and cash equivalents 380 – – – – – – – – – – – –<br />
Trade and other receivables 3,008 – – – – – – – – – – – –<br />
Available-for-sale investments 19 – – – – – – – – – (2) – 2<br />
Financial liabilities<br />
Loans and borrowings 300 3 – (3) – – – – – – – – –<br />
Trade and other payables 2,339 – – – – – – – – – – – –<br />
Derivatives – interest 378 (170) – 170 – – – – – – – – –<br />
rate swaps<br />
Total increase/(decrease) (167) – 167 – – – – – – (2) – 2<br />
Explanation of interest rate risk sensitivity<br />
The interest rate sensitivity is based on a reasonable possible movement in interest rates, with all other variables held constant,<br />
measured as a basis points (bps) movement. For example, a decrease in 100 bps is equivalent to a decrease in interest rates of<br />
1.00%.<br />
The sensitivity for derivatives (interest rate swaps) has been calculated using a derivative valuation model based on a parallel<br />
shift in interest rates of -100bps/+100bps (2011: -100bps/+100bps).<br />
Explanation of foreign exchange risk sensitivity<br />
The foreign exchange sensitivity is based on a reasonable possible movement in foreign exchange rates, with all other variables<br />
held constant, measured as a percentage movement in the foreign exchange rate.<br />
No sensitivity for derivatives (forward foreign exchange contracts) has been calculated for 2012 or 2011 since the Company had<br />
no forward foreign exchange contracts in place.<br />
Explanation of other price risk sensitivity<br />
The sensitivity for listed shares has been calculated based on a –10%/+10% (2011: -10%/+10%) movement in the quoted bid<br />
share price at balance date for the listed shares.<br />
FAIR VALUE HIERARCHY<br />
For those instruments recognised at fair value in the statement of financial position, fair values are determined according<br />
to the following hierarchy:<br />
– Quoted market price (level 1) - Financial instruments with quoted prices for identical instruments in active markets.<br />
– Valuation technique using observable inputs (level 2) - Financial instruments with quoted prices for similar instruments<br />
in active markets or quoted prices for identical or similar instruments in inactive markets and financial instruments<br />
valued using models where all significant inputs are observable.<br />
– Valuation techniques with significant non-observable inputs (level 3) - Financial instruments valued using models where<br />
one or more significant inputs are not observable.<br />
46