15399_India Insight_Big Pie Bigger Bite.qxd - OC&C Strategy ...
15399_India Insight_Big Pie Bigger Bite.qxd - OC&C Strategy ...
15399_India Insight_Big Pie Bigger Bite.qxd - OC&C Strategy ...

You also want an ePaper? Increase the reach of your titles
YUMPU automatically turns print PDFs into web optimized ePapers that Google loves.
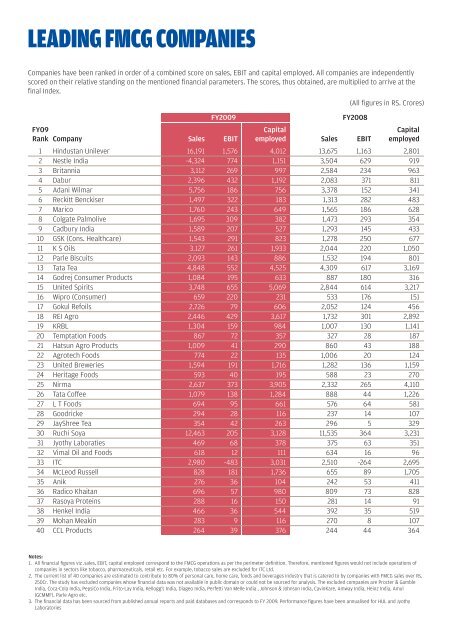
LEADING FMCG COMPANIES<br />
Companies have been ranked in order of a combined score on sales, EBIT and capital employed. All companies are independently<br />
scored on their relative standing on the mentioned financial parameters. The scores, thus obtained, are multiplied to arrive at the<br />
final Index.<br />
(All figures in RS. Crores)<br />
FY2009<br />
FY09<br />
Rank Company Sales EBIT<br />
FY2008<br />
Capital<br />
employed Sales EBIT<br />
Capital<br />
employed<br />
1 Hindustan Unilever 16,191 1,576 4,012 13,675 1,163 2,801<br />
2 Nestle <strong>India</strong> -4,324 774 1,151 3,504 629 919<br />
3 Britannia 3,112 269 997 2,584 234 963<br />
4 Dabur 2,396 432 1,192 2,083 371 811<br />
5 Adani Wilmar 5,756 186 756 3,378 152 341<br />
6 Reckitt Benckiser 1,497 322 183 1,313 282 483<br />
7 Marico 1,760 243 649 1,565 186 628<br />
8 Colgate Palmolive 1,695 309 382 1,473 293 354<br />
9 Cadbury <strong>India</strong> 1,589 207 527 1,293 145 433<br />
10 GSK (Cons. Healthcare) 1,543 291 823 1,278 250 677<br />
11 K S Oils 3.127 261 1,933 2,044 220 1,050<br />
12 Parle Biscuits 2,093 143 886 1,532 194 801<br />
13 Tata Tea 4,848 552 4,525 4,309 617 3,169<br />
14 Godrej Consumer Products 1,084 195 633 887 180 316<br />
15 United Spirits 3,748 655 5,069 2,844 614 3,217<br />
16 Wipro (Consumer) 659 220 231 533 176 151<br />
17 Gokul Refoils 2,726 79 606 2,052 124 456<br />
18 REI Agro 2,446 429 3,617 1,732 301 2,892<br />
19 KRBL 1,304 159 984 1,007 130 1,141<br />
20 Temptation Foods 867 72 357 327 28 187<br />
21 Hatsun Agro Products 1,009 41 290 860 43 188<br />
22 Agrotech Foods 774 22 135 1,006 20 124<br />
23 United Breweries 1,594 191 1,716 1,282 136 1,159<br />
24 Heritage Foods 593 40 195 588 23 270<br />
25 Nirma 2,637 373 3,905 2,332 265 4,110<br />
26 Tata Coffee 1,079 138 1,284 888 44 1,226<br />
27 L T Foods 694 95 661 576 64 581<br />
28 Goodricke 294 28 116 237 14 107<br />
29 JayShree Tea 354 42 263 296 5 329<br />
30 Ruchi Soya 12,463 205 3,128 11,535 364 3,231<br />
31 Jyothy Laboraties 469 68 378 375 63 351<br />
32 Vimal Oil and Foods 618 12 111 634 16 96<br />
33 ITC 2,980 -483 3,031 2,510 -264 2,695<br />
34 McLeod Russell 828 181 1,736 655 89 1,705<br />
35 Anik 276 36 104 242 53 411<br />
36 Radico Khaitan 696 57 980 809 73 828<br />
37 Rasoya Proteins 288 16 150 281 14 91<br />
38 Henkel <strong>India</strong> 466 36 544 392 35 519<br />
39 Mohan Meakin 283 9 116 270 8 107<br />
40 CCL Products 264 39 376 244 44 364<br />
Notes:<br />
1. All financial figures viz .sales, EBIT, capital employed correspond to the FMCG operations as per the perimeter definition. Therefore, mentioned figures would not include operations of<br />
companies in sectors like tobacco, pharmaceuticals, retail etc. For example, tobacco sales are excluded for ITC Ltd.<br />
2. The current list of 40 companies are estimated to contribute to 80% of personal care, home care, foods and beverages industry that is catered to by companies with FMCG sales over Rs.<br />
250Cr. The study has excluded companies whose financial data was not available in public domain or could not be sourced for analysis. The excluded companies are Procter & Gamble<br />
<strong>India</strong>, Coca-Cola <strong>India</strong>, PepsiCo <strong>India</strong>, Frito-Lay <strong>India</strong>, Kellogg’s <strong>India</strong>, Diageo <strong>India</strong>, Perfetti Van Melle <strong>India</strong> , Johnson & Johnson <strong>India</strong>, CavinKare, Amway <strong>India</strong>, Heinz <strong>India</strong>, Amul<br />
(GCMMF), Parle Agro etc.<br />
3. The financial data has been sourced from published annual reports and paid databases and corresponds to FY 2009. Performance figures have been annualised for HUL and Jyothy<br />
Laboratories