15399_India Insight_Big Pie Bigger Bite.qxd - OC&C Strategy ...
15399_India Insight_Big Pie Bigger Bite.qxd - OC&C Strategy ...
15399_India Insight_Big Pie Bigger Bite.qxd - OC&C Strategy ...

Create successful ePaper yourself
Turn your PDF publications into a flip-book with our unique Google optimized e-Paper software.
OC&C FMCG<br />
INDIA INDEX FY 09<br />
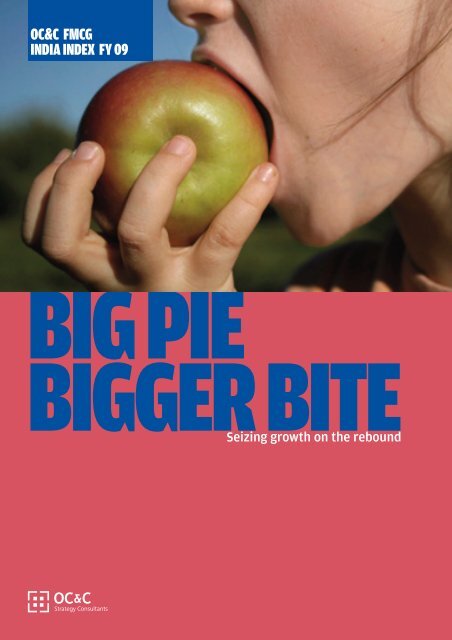
BIG PIE<br />
BIGGER BITE<br />
Seizing growth on the rebound
ABOUT OC&C<br />
OC&C <strong>Strategy</strong> Consultants is a global<br />
consulting firm with extensive expertise in<br />
the FMCG business especially in the personal<br />
care and foods and beverages sectors.<br />
Clients include leading manufacturers,<br />
primary producers, retailers and investment<br />
institutions. The firm advises on group-level<br />
and business unit strategy, profit<br />
improvement and mergers and acquisitions<br />
How the OC&C FMCG Index is compiled<br />
OC&C <strong>India</strong> continuously tracks top FMCG<br />
companies in <strong>India</strong> using data compiled<br />
from the company annual reports and<br />
other paid databases. The FMCG Index is a<br />
reflection of the company’s performance,<br />
tracked through sales, profits and capital<br />
employed.<br />
The Index strictly corresponds to the<br />
FMCG operations of the company in<br />
personal care, home care, foods and<br />
beverages. The subsidiaries and export<br />
income from FMCG operations in these<br />
sectors have been included in the study.<br />
Adjustments have been made to the<br />
company financial data to reflect income<br />
and expenses from the FMCG business<br />
only. Therefore, there might be<br />
differences in the company reported<br />
financial data and the figures reported in<br />
the Index. As per the perimeter definition,<br />
the study excludes income from any other<br />
engagements in retail, pharmaceutical,<br />
tobacco etc. The data is compiled from<br />
published sources and OC&C does not<br />
certify the accuracy of information.
BIG PIE<br />
BIGGER BITE<br />
A bigger bite is what every FMCG<br />
company should attempt to get of<br />
the growing pie of demand this year.<br />
But not all firms will achieve that.<br />
Only those which managed to ride<br />
out the stormy FY09 met the slow<br />
down with the right responses, and<br />
have a consistent game plan going<br />
ahead will take advantage of the<br />
expected surge in demand.<br />
To decide the way ahead, it is<br />
necessary to learn from the last<br />
year, examine strategies of the<br />
winners, tactical responses to the<br />
slowdown and enumerate steps<br />
necessary to succeed. Lets start<br />
with a quick look in the rear view<br />
mirror.<br />
FY 09: A YEAR OF UPS AND DOWNS<br />
FY09 saw a great start with the industry demonstrating dramatic growth in H1, only<br />
for the charge to be halted by the forces of the slowdown towards the latter half of<br />
the year.<br />
Premiumisation and Innovation initiatives which targeted niches created through<br />
micro segmentation during H1 were replaced with judicious combination of pricing,<br />
cost reduction and efficiency enhancement measures in H2.<br />
<strong>Strategy</strong> themes for FY 09<br />
The initiatives bear testimony to the high growth trajectory witnessed in the<br />
beginning of FY09.<br />
Focus on Health and Naturals<br />
Optimising the supply chain using IT<br />
Performance of Index 40 Companies<br />
FMCG Sales & EBIT (Rs. Crores)<br />
Sales<br />
EBIT<br />
8,502<br />
7,399<br />
15%<br />
75,428<br />
91,423<br />
Y-o-Y<br />
Growth<br />
21%<br />
2009<br />
2008<br />
Companies latched on to the growing<br />
popularity of the ‘Health and Naturals’<br />
platform. The year witnessed a myriad<br />
of new launches such as Amul’s Slim &<br />
Trim milk & curd, and Nestle’s diet Kit-<br />
Kat Lite targeted at the weight<br />
conscious, a protein health drink N’rich<br />
by Ruchi Soya, Nesvita Pro Heart by<br />
Nestle, Sundrop Zero-Cholesterol<br />
Peanut Butter by Agrotech Foods and<br />
Dabur’s Natural Odomos with skin<br />
friendly ingredients.<br />
Mass Premiumisation<br />
To serve the discerning <strong>India</strong>n<br />
customer, a flurry of activity was seen<br />
in the premium segment across<br />
product categories. Prominent new<br />
launches included Pond’s Age Miracle<br />
and Axe Special Edition in Personal<br />
Care, Wheel Gold in Fabric Care,<br />
Tropicana 100% by Pepsico, TiON and<br />
Qua by Tata Tea, Saint Juices by Parle<br />
Agro in beverages, Kingfisher Blue by<br />
UB and Jura Island Single Malt in<br />
alcohol and Gelato in ice creams .<br />
Having identified supply chain<br />
excellence as a key competitive<br />
advantage, and having ramped up<br />
technology in the inbound supply<br />
chain, larger FMCG companies are<br />
focusing on doing so in their outward<br />
supply chain. Mid sized and smaller<br />
companies are presently focusing on<br />
Wave 1 – getting the inbound supply<br />
chain in order.<br />
Acquisitions<br />
Armed with an acquisition war chest,<br />
<strong>India</strong>n FMCG companies went global,<br />
scouting for value buys. M&A activities<br />
were driven towards portfolio<br />
enhancement (Dabur – Fem), acquiring<br />
complementary brands (Emami –<br />
Zandu), accessing newer markets<br />
(Marico acquiring brands in South<br />
Africa and Egypt), backward (KS Oils<br />
acquired plantations in Malaysia) and<br />
forward integration (LT Foods acquired<br />
a distribution company in USA).<br />
FMCG Sales Growth of Index 40 Companies:<br />
FY09 vs FY08<br />
Giant<br />
Large<br />
Mid Sized<br />
Giant<br />
Large<br />
Mid Sized<br />
12%<br />
12%<br />
15%<br />
22%<br />
22%<br />
FMCG EBIT Growth of Index 40 Companies:<br />
FY09 vs FY08<br />
32%<br />
Size clusters: Giants with FMCG sales > Rs. 3000 Cr., Large<br />
between Rs. 1000-3000 Cr., Midsized between Rs. 250-1000 Cr.
LEADING FMCG COMPANIES<br />
Companies have been ranked in order of a combined score on sales, EBIT and capital employed. All companies are independently<br />
scored on their relative standing on the mentioned financial parameters. The scores, thus obtained, are multiplied to arrive at the<br />
final Index.<br />
(All figures in RS. Crores)<br />
FY2009<br />
FY09<br />
Rank Company Sales EBIT<br />
FY2008<br />
Capital<br />
employed Sales EBIT<br />
Capital<br />
employed<br />
1 Hindustan Unilever 16,191 1,576 4,012 13,675 1,163 2,801<br />
2 Nestle <strong>India</strong> -4,324 774 1,151 3,504 629 919<br />
3 Britannia 3,112 269 997 2,584 234 963<br />
4 Dabur 2,396 432 1,192 2,083 371 811<br />
5 Adani Wilmar 5,756 186 756 3,378 152 341<br />
6 Reckitt Benckiser 1,497 322 183 1,313 282 483<br />
7 Marico 1,760 243 649 1,565 186 628<br />
8 Colgate Palmolive 1,695 309 382 1,473 293 354<br />
9 Cadbury <strong>India</strong> 1,589 207 527 1,293 145 433<br />
10 GSK (Cons. Healthcare) 1,543 291 823 1,278 250 677<br />
11 K S Oils 3.127 261 1,933 2,044 220 1,050<br />
12 Parle Biscuits 2,093 143 886 1,532 194 801<br />
13 Tata Tea 4,848 552 4,525 4,309 617 3,169<br />
14 Godrej Consumer Products 1,084 195 633 887 180 316<br />
15 United Spirits 3,748 655 5,069 2,844 614 3,217<br />
16 Wipro (Consumer) 659 220 231 533 176 151<br />
17 Gokul Refoils 2,726 79 606 2,052 124 456<br />
18 REI Agro 2,446 429 3,617 1,732 301 2,892<br />
19 KRBL 1,304 159 984 1,007 130 1,141<br />
20 Temptation Foods 867 72 357 327 28 187<br />
21 Hatsun Agro Products 1,009 41 290 860 43 188<br />
22 Agrotech Foods 774 22 135 1,006 20 124<br />
23 United Breweries 1,594 191 1,716 1,282 136 1,159<br />
24 Heritage Foods 593 40 195 588 23 270<br />
25 Nirma 2,637 373 3,905 2,332 265 4,110<br />
26 Tata Coffee 1,079 138 1,284 888 44 1,226<br />
27 L T Foods 694 95 661 576 64 581<br />
28 Goodricke 294 28 116 237 14 107<br />
29 JayShree Tea 354 42 263 296 5 329<br />
30 Ruchi Soya 12,463 205 3,128 11,535 364 3,231<br />
31 Jyothy Laboraties 469 68 378 375 63 351<br />
32 Vimal Oil and Foods 618 12 111 634 16 96<br />
33 ITC 2,980 -483 3,031 2,510 -264 2,695<br />
34 McLeod Russell 828 181 1,736 655 89 1,705<br />
35 Anik 276 36 104 242 53 411<br />
36 Radico Khaitan 696 57 980 809 73 828<br />
37 Rasoya Proteins 288 16 150 281 14 91<br />
38 Henkel <strong>India</strong> 466 36 544 392 35 519<br />
39 Mohan Meakin 283 9 116 270 8 107<br />
40 CCL Products 264 39 376 244 44 364<br />
Notes:<br />
1. All financial figures viz .sales, EBIT, capital employed correspond to the FMCG operations as per the perimeter definition. Therefore, mentioned figures would not include operations of<br />
companies in sectors like tobacco, pharmaceuticals, retail etc. For example, tobacco sales are excluded for ITC Ltd.<br />
2. The current list of 40 companies are estimated to contribute to 80% of personal care, home care, foods and beverages industry that is catered to by companies with FMCG sales over Rs.<br />
250Cr. The study has excluded companies whose financial data was not available in public domain or could not be sourced for analysis. The excluded companies are Procter & Gamble<br />
<strong>India</strong>, Coca-Cola <strong>India</strong>, PepsiCo <strong>India</strong>, Frito-Lay <strong>India</strong>, Kellogg’s <strong>India</strong>, Diageo <strong>India</strong>, Perfetti Van Melle <strong>India</strong> , Johnson & Johnson <strong>India</strong>, CavinKare, Amway <strong>India</strong>, Heinz <strong>India</strong>, Amul<br />
(GCMMF), Parle Agro etc.<br />
3. The financial data has been sourced from published annual reports and paid databases and corresponds to FY 2009. Performance figures have been annualised for HUL and Jyothy<br />
Laboratories
RESPONSE TO THE<br />
SLOWDOWN<br />
With falling demand & rising input prices in H2 of FY09,<br />
companies organised their efforts towards sustenance of<br />
demand and margins.<br />
Driving Affordability: To prevent downtrading, companies<br />
introduced lower price points, lower priced SKU’s and smaller packs<br />
(P&G, Henkel, Amul).<br />
The Importance of ‘Bharat’: Buoyed by four years of steady<br />
rainfall, rural demand remained strong and outgrew growth in<br />
urban demand. Rural focus manifested in the form of new product<br />
launches (Raag by Adani Wilmar), beefing up rural distribution<br />
through innovative methods (use of the postal dept. by Emami,<br />
usage of super distributors by Marico), designing rural specific<br />
promotional campaigns (Lifebuoy’s Swasthya Chetna) and media<br />
mix (GCPL).<br />
Trimming Operational Costs: Overheads built on assumptions of<br />
high growth were the first to face the axe followed by<br />
rationalisation of distribution channel, consolidation of sales force,<br />
and outsourcing of non core activities, accompanied with<br />
improvements in sourcing.<br />
Efforts to Sustain Demand and Margins¹<br />
Cash<br />
% of Sales<br />
Debtor Turnover<br />
# of Days<br />
Inventory Turnover<br />
# of Days²<br />
Marketing Spend<br />
% of Sales<br />
Overall<br />
5.5%<br />
8.4%<br />
26<br />
25<br />
48<br />
7.6%<br />
52 6.7%<br />
Giant<br />
6.6%<br />
3.6%<br />
20<br />
20<br />
49<br />
55<br />
6.7%<br />
5.8%<br />
2009<br />
Large<br />
9.4%<br />
6.9%<br />
27<br />
29<br />
39<br />
40<br />
10.5%<br />
9.5%<br />
2008<br />
Mid Sized<br />
9.0%<br />
15.3%<br />
47<br />
60<br />
62<br />
60<br />
4.2%<br />
3.8%<br />
Cash is King - Companies<br />
followed a cautious<br />
approach holding on<br />
to cash<br />
The Mid-sized companies<br />
felt the heat, having to<br />
offer additional credit to<br />
push sales<br />
Tightening of the belt<br />
through better inventory<br />
management<br />
Rise in marketing spend<br />
across categories<br />
indicative of the thrust on<br />
demand generation<br />
1. The above analysis is for 37 companies<br />
2. REI Agro and KRBL Limited, both large rice trading companies have been excluded from the Inventory Turnover Analysis on account of the high inventory held by them. Including these<br />
two companies skews the average Inventory Days of ‘Large’ to 87 and 86 days and ‘Overall’ to 61 and 64 days respectively in 2009 and 2008 respectively
WHAT NEXT?<br />
The economy has responded very well to the stimulus package and<br />
restored consumer confidence. In the first two quarters of FY10,<br />
the <strong>India</strong>n FMCG industry has grown by c.15% . This growth has<br />
been largely volume led, with lower price points being exploited<br />
heavily. Rural demand continued to be strong, with volume growth<br />
of c.20% compared to a 6-7% growth in the Metros. The impact of<br />
poor monsoons on rural consumption will be muted primarily on<br />
account of friendly government policies<br />
Most companies have managed healthy margins with the ‘Large’<br />
faring better than the ‘Giants’. However rise in prices of key inputs<br />
such as sugar, milk etc. and raised ad spends are likely to result in<br />
margin pressures. Crude prices are back to $ 80+ per barrel<br />
leading to inflationary pressures as well.<br />
The slowdown last year forced companies to trim excess flab and<br />
get into the best shape possible. Being at their fittest, now is the<br />
perfect time for companies to step on the gas and zoom ahead.<br />
Companies should now set ambitious and long term goals, setting<br />
the stage for an endgame play!<br />
Prepare to Win, Think Endgame!<br />
Companies need to think Endgame and not incremental planning… a giant leap versus<br />
baby steps!<br />
HOW? : Imagine the future and work back from there!<br />
WHY? : Endgame delivers superior financial results as well as coveted goals<br />
WHAT? :<br />
Endgame ‘is NOT’: 10 to 15% Better<br />
Endgame ‘IS’: Typical endgame goals -<br />
Increase your market share at least 10 percentage points<br />
Achieve a Relative Market Share - RMS¹ of 2<br />
Grow at twice the rate of the competitors<br />
Recover all share loss of the last 4 years<br />
1. Your size relative to the market leader or, if you are the leader, the next largest company
TAKE THE FIRST STEP<br />
TOWARDS YOUR<br />
ENDGAME...<br />
Widen Reach<br />
Strengthen<br />
traditional trade<br />
to offer a better<br />
consumer<br />
experience – enjoy<br />
increased reach,<br />
bargaining power<br />
and stability<br />
Improve Realisation<br />
Decommoditise!!<br />
4<br />
Grab Market Share<br />
Move from volume-led to value-led<br />
growth<br />
Seize the opportunity to take market<br />
share (specifically Relative Market Share)<br />
through innovative offerings backed by a<br />
solid marketing budget<br />
3<br />
Outsource<br />
De-resource the<br />
business –<br />
evaluate<br />
outsourcing<br />
non-core<br />
functions to<br />
reduce<br />
overheads and<br />
improve<br />
efficiency<br />
1<br />
2
Offices<br />
Abu Dhabi<br />
T +971 2631 6111<br />
Boston<br />
T +1 617 896 9900<br />
Dubai<br />
T +971 4368 1725<br />
Düsseldorf<br />
T +49 211 86 07 0<br />
Hamburg<br />
T +49 40 40 17 56 0<br />
Hong Kong<br />
T +853 2201 170<br />
London<br />
T +44 20 7010 8000<br />
Mumbai<br />
T +91 22 6619 1166<br />
New Delhi<br />
T +91 11 4051 6666<br />
New York<br />
T +1 212 803 7280<br />
Paris<br />
T +33 1 58 56 18 00<br />
Rotterdam<br />
T +31 10 217 5555<br />
Shanghai<br />
T +86 21 6115 0310<br />
www.occstrategy.com<br />
For further information please contact<br />
naimish.dave@occstrategy.in<br />
© OC&C <strong>Strategy</strong> Consultants 2010.<br />
Trademarks and logos are registered trademarks<br />
of OC&C <strong>Strategy</strong> Consultants and its licensors.