Honeycomb Pattern Formation by Laser-Beam Filamentation in Atomic
Honeycomb Pattern Formation by Laser-Beam Filamentation in Atomic
Honeycomb Pattern Formation by Laser-Beam Filamentation in Atomic

Create successful ePaper yourself
Turn your PDF publications into a flip-book with our unique Google optimized e-Paper software.
VOLUME 88, NUMBER 11 PHYSICAL REVIEW LETTERS 18MARCH 2002<br />
due to reflections from the cell w<strong>in</strong>dows, and we verified<br />
that the patterns did not vary with the <strong>in</strong>cidence angle.<br />
Moreover, most previously reported patterns exhibit<strong>in</strong>g a<br />
hexagonal tile structure occurred at the exit face of the<br />
nonl<strong>in</strong>ear medium [12], whereas the honeycomb pattern<br />
reported here occurs <strong>in</strong> the far zone of the transmitted field<br />
[13]. We note that Vaupel et al. [14] observed patterns <strong>in</strong><br />
the far zone of the field generated <strong>by</strong> an optical parametric<br />
oscillator (that is, <strong>in</strong> the presence of feedback), and that<br />
several researchers [15] observed spatial <strong>in</strong>stabilities of a<br />
s<strong>in</strong>gle laser beam pass<strong>in</strong>g through an atomic vapor but did<br />
not report observation of hexagon formation <strong>in</strong> the far field.<br />
In summary, we are unaware of previous observations of<br />
honeycomb (hexagonal) pattern formation <strong>in</strong> the far field<br />
from a s<strong>in</strong>gle beam pass<strong>in</strong>g through an atomic medium<br />
without feedback.<br />
In addition to the honeycomb pattern illustrated <strong>in</strong><br />
Fig. 1(b), we have observed a wide variety of other<br />
patterns <strong>in</strong> our experiment. Some of these patterns are<br />
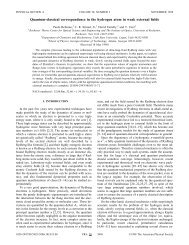
shown <strong>in</strong> Fig. 2. Figure 2(a) shows how the near-field<br />
and k-space patterns evolve as the <strong>in</strong>cident laser power is<br />
<strong>in</strong>creased at a fixed number density of 3 3 10 12 cm 23 ,<br />
a blue detun<strong>in</strong>g of 2 GHz, and an <strong>in</strong>put Gaussian-beam<br />
spot size of 2w 0 180 mm. The beam exit<strong>in</strong>g the cell is<br />
unstructured at low powers, shr<strong>in</strong>ks <strong>in</strong> size as the power is<br />
<strong>in</strong>creased, and at an <strong>in</strong>put power of approximately 80 mW<br />
beg<strong>in</strong>s to form three dist<strong>in</strong>ct spots, lead<strong>in</strong>g to hexagonal<br />
cells <strong>in</strong> the far field. As the power is <strong>in</strong>creased further,<br />
the near-field spots move farther apart, and thus the size<br />
of the cells of the honeycomb pattern decreases. Above<br />
approximately 150 mW, the beam conta<strong>in</strong>s enough power<br />
to generate additional filaments, lead<strong>in</strong>g to a far-field<br />
at cell exit<br />
0.05 W<br />
0.07 W<br />
0.10 W<br />
0.16 W<br />
<strong>in</strong> far field<br />
at cell exit <strong>in</strong> far field at cell exit <strong>in</strong> far field<br />
9.4 GHz<br />
6.0 GHz<br />
3.4 GHz<br />
2.2 GHz<br />
(a) 0.20 W<br />
(b) 1.4 GHz (c)<br />
6.0 GHz<br />
4.3 GHz<br />
3.7 GHz<br />
2.8 GHz<br />
2.4 GHz<br />
FIG. 2 (color). Near- and far-field <strong>in</strong>tensity distributions of the<br />
light leav<strong>in</strong>g the sodium cell as functions of (a) laser power<br />
and (b),(c) laser frequency. (a) N 3 3 10 12 cm 23 , D2p <br />
2 GHz. (b) N 3 3 10 12 cm 23 , P 0.11 W. (c) N 8 3<br />
10 12 cm 23 , P 0.05 W. In all cases the <strong>in</strong>put beam diameter<br />
was 2w 0.18 mm and the propagation length was 7 cm.<br />
distribution that is highly structured but conta<strong>in</strong>s no<br />
apparent regular order. At our highest accessible <strong>in</strong>put<br />
power of 400 mW, as many as eleven near-field spots were<br />
observed. Figure 2(b) shows how the pattern evolves as<br />
we change the laser frequency at a fixed <strong>in</strong>cident power of<br />
100 mW, aga<strong>in</strong> for a number density of 3 3 10 12 cm 23<br />
and an <strong>in</strong>put spot size of 180 mm. We see that the<br />
beam exit<strong>in</strong>g the cell reta<strong>in</strong>s its near-Gaussian transverse<br />
structure when the laser frequency is far from resonance,<br />
and that the beam first develops a small “hot” center as<br />
resonance is approached. With decreas<strong>in</strong>g detun<strong>in</strong>g (and<br />
hence <strong>in</strong>creas<strong>in</strong>g nonl<strong>in</strong>earity), the beam develops r<strong>in</strong>gs<br />
<strong>in</strong> both the near and far fields and eventually breaks up<br />
<strong>in</strong>to a pattern with threefold symmetry. Figure 2(c) shows<br />
the laser-frequency dependence of the pattern formation<br />
under slightly different conditions, with a number density<br />
of 8 3 10 12 cm 23 and a power of 47 mW. In this case<br />
the beam preferentially develops a two-lobed rather than<br />
a three-lobed structure, with correspond<strong>in</strong>g stripes <strong>in</strong><br />
the far field. The results shown <strong>in</strong> Fig. 2 <strong>in</strong>dicate that<br />
honeycomb pattern formation occurs only under fairly<br />
restricted experimental conditions. We speculate that it<br />
is for this reason that this effect has not previously been<br />
reported <strong>in</strong> the literature.<br />
The patterns we have observed, and <strong>in</strong> particular those<br />
shown <strong>in</strong> Fig. 1(b), are remarkably stable and show no<br />
variation <strong>in</strong> structure over time scales of tens of m<strong>in</strong>utes.<br />
This observation suggests that these patterns may constitute<br />
“quantum images” (that is, field distributions conta<strong>in</strong><strong>in</strong>g<br />
strong spatial quantum correlations) as described <strong>by</strong><br />
Lugiato and coworkers [4]. In fact, theoretical arguments<br />
[16] show that strong quantum correlations are expected<br />
to be produced <strong>by</strong> those <strong>in</strong>teractions that lead to patterns<br />
with hexagonal symmetry. We have studied further the<br />
stability of these patterns <strong>by</strong> exam<strong>in</strong><strong>in</strong>g the coherence<br />
properties of the transmitted light field. Figure 3 shows an<br />
<strong>in</strong>terferogram of the near-field light distribution, superimposed<br />
with a contour map of the near-field <strong>in</strong>tensity distribution,<br />
taken under conditions similar to those of Fig. 1(b).<br />
This pattern was formed <strong>by</strong> <strong>in</strong>terfer<strong>in</strong>g the field leav<strong>in</strong>g the<br />
cell with a (nearly planar) reference wave front <strong>in</strong>cl<strong>in</strong>ed at<br />
a slight angle to produce (slightly curved) tilt fr<strong>in</strong>ges. The<br />
brightest portions of the <strong>in</strong>terferogram were allowed to<br />
saturate the CCD camera so that we could follow the<br />
fr<strong>in</strong>ges far <strong>in</strong>to the w<strong>in</strong>gs of the light distribution associated<br />
with each filament. The existence of stationary, highcontrast<br />
fr<strong>in</strong>ges <strong>in</strong>dicates that the transmitted light is<br />
predom<strong>in</strong>antly at the same frequency as the <strong>in</strong>put light. In<br />
addition, the even spac<strong>in</strong>g of the fr<strong>in</strong>ges <strong>in</strong>dicates that the<br />
transmitted light field has an essentially uniform phase<br />
across its entire transverse profile. Normally one would<br />
expect the phase of a light field transmitted through a<br />
strongly nonl<strong>in</strong>ear medium to be highly nonuniform as<br />
a consequence of transverse <strong>in</strong>tensity variations. The<br />
uniformity of the phase <strong>in</strong> the present case is rem<strong>in</strong>iscent<br />
of similar behavior that occurs <strong>in</strong> the formation<br />
of optical solitons, although we stress that we have no<br />
113901-2 113901-2
![Phase retrieval algorithms: a personal tour [Invited] - The Institute of ...](https://img.yumpu.com/25023725/1/190x249/phase-retrieval-algorithms-a-personal-tour-invited-the-institute-of-.jpg?quality=85)