Honeycomb Pattern Formation by Laser-Beam Filamentation in Atomic
Honeycomb Pattern Formation by Laser-Beam Filamentation in Atomic
Honeycomb Pattern Formation by Laser-Beam Filamentation in Atomic

Create successful ePaper yourself
Turn your PDF publications into a flip-book with our unique Google optimized e-Paper software.
VOLUME 88, NUMBER 11 PHYSICAL REVIEW LETTERS 18MARCH 2002<br />
<strong>Honeycomb</strong> <strong>Pattern</strong> <strong>Formation</strong> <strong>by</strong> <strong>Laser</strong>-<strong>Beam</strong> <strong>Filamentation</strong> <strong>in</strong> <strong>Atomic</strong> Sodium Vapor<br />
Ryan S. Benn<strong>in</strong>k, V<strong>in</strong>cent Wong, Alberto M. Mar<strong>in</strong>o, David L. Aronste<strong>in</strong>, Robert W. Boyd,<br />
C. R. Stroud, Jr., and Svetlana Lukishova<br />
The Institute of Optics, University of Rochester, Rochester, New York 14627<br />
Daniel J. Gauthier<br />
Department of Physics, Duke University, Durham, North Carol<strong>in</strong>a 27708<br />
(Received 26 July 2001; revised manuscript received 16 November 2001; published 27 February 2002)<br />
We have observed transverse pattern formation lead<strong>in</strong>g to highly regular structures <strong>in</strong> both the near<br />
and far fields when a near-resonant laser beam propagates without feedback through an atomic sodium<br />
vapor. One example is a regular far-field honeycomb pattern, which results from the transformation of<br />
the laser beam with<strong>in</strong> the vapor <strong>in</strong>to a stable three-lobed structure with a uniform phase distribution and<br />
highly correlated power fluctuations. The predictions of a theoretical model of the filamentation process<br />
are <strong>in</strong> good agreement with these observations.<br />
DOI: 10.1103/PhysRevLett.88.113901<br />
In this Letter we describe our observation of a strik<strong>in</strong>g<br />
form of optical pattern formation <strong>in</strong> which a s<strong>in</strong>gle laser<br />
beam breaks up <strong>in</strong>to a stable, regularly structured beam<br />
<strong>in</strong> pass<strong>in</strong>g without feedback through a sodium vapor cell.<br />
<strong>Pattern</strong> formation [1] <strong>in</strong> optical systems [2] is an area of<br />
widespread <strong>in</strong>terest, both from the conceptual po<strong>in</strong>t of view<br />
of understand<strong>in</strong>g how regular patterns can emerge from<br />
uniform or randomly structured <strong>in</strong>put fields and from the<br />
practical po<strong>in</strong>t of view of utiliz<strong>in</strong>g such patterns <strong>in</strong> image<br />
formation and manipulation. Applications <strong>in</strong>clude the use<br />
of imag<strong>in</strong>g techniques that exploit the quantum nature of<br />
the light field to <strong>in</strong>crease the sensitivity or resolution of<br />
optical systems [3,4], the construction of optical neural<br />
networks and associative memories [5], and the use of<br />
fractal and wavelet algorithms for image compression [6].<br />
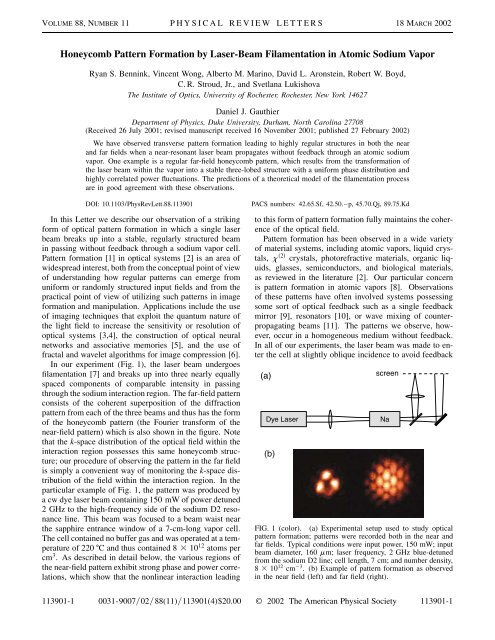
In our experiment (Fig. 1), the laser beam undergoes<br />
filamentation [7] and breaks up <strong>in</strong>to three nearly equally<br />
spaced components of comparable <strong>in</strong>tensity <strong>in</strong> pass<strong>in</strong>g<br />
through the sodium <strong>in</strong>teraction region. The far-field pattern<br />
consists of the coherent superposition of the diffraction<br />
pattern from each of the three beams and thus has the form<br />
of the honeycomb pattern (the Fourier transform of the<br />
near-field pattern) which is also shown <strong>in</strong> the figure. Note<br />
that the k-space distribution of the optical field with<strong>in</strong> the<br />
<strong>in</strong>teraction region possesses this same honeycomb structure;<br />
our procedure of observ<strong>in</strong>g the pattern <strong>in</strong> the far field<br />
is simply a convenient way of monitor<strong>in</strong>g the k-space distribution<br />
of the field with<strong>in</strong> the <strong>in</strong>teraction region. In the<br />
particular example of Fig. 1, the pattern was produced <strong>by</strong><br />
a cw dye laser beam conta<strong>in</strong><strong>in</strong>g 150 mW of power detuned<br />
2 GHz to the high-frequency side of the sodium D2 resonance<br />
l<strong>in</strong>e. This beam was focused to a beam waist near<br />
the sapphire entrance w<strong>in</strong>dow of a 7-cm-long vapor cell.<br />
The cell conta<strong>in</strong>ed no buffer gas and was operated at a temperature<br />
of 220 ± C and thus conta<strong>in</strong>ed 8 3 10 12 atoms per<br />
cm 3 . As described <strong>in</strong> detail below, the various regions of<br />
the near-field pattern exhibit strong phase and power correlations,<br />
which show that the nonl<strong>in</strong>ear <strong>in</strong>teraction lead<strong>in</strong>g<br />
PACS numbers: 42.65.Sf, 42.50.–p, 45.70.Qj, 89.75.Kd<br />
to this form of pattern formation fully ma<strong>in</strong>ta<strong>in</strong>s the coherence<br />
of the optical field.<br />
<strong>Pattern</strong> formation has been observed <strong>in</strong> a wide variety<br />
of material systems, <strong>in</strong>clud<strong>in</strong>g atomic vapors, liquid crystals,<br />
x 2 crystals, photorefractive materials, organic liquids,<br />
glasses, semiconductors, and biological materials,<br />
as reviewed <strong>in</strong> the literature [2]. Our particular concern<br />
is pattern formation <strong>in</strong> atomic vapors [8]. Observations<br />
of these patterns have often <strong>in</strong>volved systems possess<strong>in</strong>g<br />
some sort of optical feedback such as a s<strong>in</strong>gle feedback<br />
mirror [9], resonators [10], or wave mix<strong>in</strong>g of counterpropagat<strong>in</strong>g<br />
beams [11]. The patterns we observe, however,<br />
occur <strong>in</strong> a homogeneous medium without feedback.<br />
In all of our experiments, the laser beam was made to enter<br />
the cell at slightly oblique <strong>in</strong>cidence to avoid feedback<br />
(a)<br />
Dye <strong>Laser</strong><br />
(b)<br />
screen<br />
FIG. 1 (color). (a) Experimental setup used to study optical<br />
pattern formation; patterns were recorded both <strong>in</strong> the near and<br />
far fields. Typical conditions were <strong>in</strong>put power, 150 mW; <strong>in</strong>put<br />
beam diameter, 160 mm; laser frequency, 2 GHz blue-detuned<br />
from the sodium D2 l<strong>in</strong>e; cell length, 7 cm; and number density,<br />
8 3 10 12 cm 23 . (b) Example of pattern formation as observed<br />
<strong>in</strong> the near field (left) and far field (right).<br />
Na<br />
113901-1 0031-90070288(11)113901(4)$20.00 © 2002 The American Physical Society 113901-1
VOLUME 88, NUMBER 11 PHYSICAL REVIEW LETTERS 18MARCH 2002<br />
due to reflections from the cell w<strong>in</strong>dows, and we verified<br />
that the patterns did not vary with the <strong>in</strong>cidence angle.<br />
Moreover, most previously reported patterns exhibit<strong>in</strong>g a<br />
hexagonal tile structure occurred at the exit face of the<br />
nonl<strong>in</strong>ear medium [12], whereas the honeycomb pattern<br />
reported here occurs <strong>in</strong> the far zone of the transmitted field<br />
[13]. We note that Vaupel et al. [14] observed patterns <strong>in</strong><br />
the far zone of the field generated <strong>by</strong> an optical parametric<br />
oscillator (that is, <strong>in</strong> the presence of feedback), and that<br />
several researchers [15] observed spatial <strong>in</strong>stabilities of a<br />
s<strong>in</strong>gle laser beam pass<strong>in</strong>g through an atomic vapor but did<br />
not report observation of hexagon formation <strong>in</strong> the far field.<br />
In summary, we are unaware of previous observations of<br />
honeycomb (hexagonal) pattern formation <strong>in</strong> the far field<br />
from a s<strong>in</strong>gle beam pass<strong>in</strong>g through an atomic medium<br />
without feedback.<br />
In addition to the honeycomb pattern illustrated <strong>in</strong><br />
Fig. 1(b), we have observed a wide variety of other<br />
patterns <strong>in</strong> our experiment. Some of these patterns are<br />
shown <strong>in</strong> Fig. 2. Figure 2(a) shows how the near-field<br />
and k-space patterns evolve as the <strong>in</strong>cident laser power is<br />
<strong>in</strong>creased at a fixed number density of 3 3 10 12 cm 23 ,<br />
a blue detun<strong>in</strong>g of 2 GHz, and an <strong>in</strong>put Gaussian-beam<br />
spot size of 2w 0 180 mm. The beam exit<strong>in</strong>g the cell is<br />
unstructured at low powers, shr<strong>in</strong>ks <strong>in</strong> size as the power is<br />
<strong>in</strong>creased, and at an <strong>in</strong>put power of approximately 80 mW<br />
beg<strong>in</strong>s to form three dist<strong>in</strong>ct spots, lead<strong>in</strong>g to hexagonal<br />
cells <strong>in</strong> the far field. As the power is <strong>in</strong>creased further,<br />
the near-field spots move farther apart, and thus the size<br />
of the cells of the honeycomb pattern decreases. Above<br />
approximately 150 mW, the beam conta<strong>in</strong>s enough power<br />
to generate additional filaments, lead<strong>in</strong>g to a far-field<br />
at cell exit<br />
0.05 W<br />
0.07 W<br />
0.10 W<br />
0.16 W<br />
<strong>in</strong> far field<br />
at cell exit <strong>in</strong> far field at cell exit <strong>in</strong> far field<br />
9.4 GHz<br />
6.0 GHz<br />
3.4 GHz<br />
2.2 GHz<br />
(a) 0.20 W<br />
(b) 1.4 GHz (c)<br />
6.0 GHz<br />
4.3 GHz<br />
3.7 GHz<br />
2.8 GHz<br />
2.4 GHz<br />
FIG. 2 (color). Near- and far-field <strong>in</strong>tensity distributions of the<br />
light leav<strong>in</strong>g the sodium cell as functions of (a) laser power<br />
and (b),(c) laser frequency. (a) N 3 3 10 12 cm 23 , D2p <br />
2 GHz. (b) N 3 3 10 12 cm 23 , P 0.11 W. (c) N 8 3<br />
10 12 cm 23 , P 0.05 W. In all cases the <strong>in</strong>put beam diameter<br />
was 2w 0.18 mm and the propagation length was 7 cm.<br />
distribution that is highly structured but conta<strong>in</strong>s no<br />
apparent regular order. At our highest accessible <strong>in</strong>put<br />
power of 400 mW, as many as eleven near-field spots were<br />
observed. Figure 2(b) shows how the pattern evolves as<br />
we change the laser frequency at a fixed <strong>in</strong>cident power of<br />
100 mW, aga<strong>in</strong> for a number density of 3 3 10 12 cm 23<br />
and an <strong>in</strong>put spot size of 180 mm. We see that the<br />
beam exit<strong>in</strong>g the cell reta<strong>in</strong>s its near-Gaussian transverse<br />
structure when the laser frequency is far from resonance,<br />
and that the beam first develops a small “hot” center as<br />
resonance is approached. With decreas<strong>in</strong>g detun<strong>in</strong>g (and<br />
hence <strong>in</strong>creas<strong>in</strong>g nonl<strong>in</strong>earity), the beam develops r<strong>in</strong>gs<br />
<strong>in</strong> both the near and far fields and eventually breaks up<br />
<strong>in</strong>to a pattern with threefold symmetry. Figure 2(c) shows<br />
the laser-frequency dependence of the pattern formation<br />
under slightly different conditions, with a number density<br />
of 8 3 10 12 cm 23 and a power of 47 mW. In this case<br />
the beam preferentially develops a two-lobed rather than<br />
a three-lobed structure, with correspond<strong>in</strong>g stripes <strong>in</strong><br />
the far field. The results shown <strong>in</strong> Fig. 2 <strong>in</strong>dicate that<br />
honeycomb pattern formation occurs only under fairly<br />
restricted experimental conditions. We speculate that it<br />
is for this reason that this effect has not previously been<br />
reported <strong>in</strong> the literature.<br />
The patterns we have observed, and <strong>in</strong> particular those<br />
shown <strong>in</strong> Fig. 1(b), are remarkably stable and show no<br />
variation <strong>in</strong> structure over time scales of tens of m<strong>in</strong>utes.<br />
This observation suggests that these patterns may constitute<br />
“quantum images” (that is, field distributions conta<strong>in</strong><strong>in</strong>g<br />
strong spatial quantum correlations) as described <strong>by</strong><br />
Lugiato and coworkers [4]. In fact, theoretical arguments<br />
[16] show that strong quantum correlations are expected<br />
to be produced <strong>by</strong> those <strong>in</strong>teractions that lead to patterns<br />
with hexagonal symmetry. We have studied further the<br />
stability of these patterns <strong>by</strong> exam<strong>in</strong><strong>in</strong>g the coherence<br />
properties of the transmitted light field. Figure 3 shows an<br />
<strong>in</strong>terferogram of the near-field light distribution, superimposed<br />
with a contour map of the near-field <strong>in</strong>tensity distribution,<br />
taken under conditions similar to those of Fig. 1(b).<br />
This pattern was formed <strong>by</strong> <strong>in</strong>terfer<strong>in</strong>g the field leav<strong>in</strong>g the<br />
cell with a (nearly planar) reference wave front <strong>in</strong>cl<strong>in</strong>ed at<br />
a slight angle to produce (slightly curved) tilt fr<strong>in</strong>ges. The<br />
brightest portions of the <strong>in</strong>terferogram were allowed to<br />
saturate the CCD camera so that we could follow the<br />
fr<strong>in</strong>ges far <strong>in</strong>to the w<strong>in</strong>gs of the light distribution associated<br />
with each filament. The existence of stationary, highcontrast<br />
fr<strong>in</strong>ges <strong>in</strong>dicates that the transmitted light is<br />
predom<strong>in</strong>antly at the same frequency as the <strong>in</strong>put light. In<br />
addition, the even spac<strong>in</strong>g of the fr<strong>in</strong>ges <strong>in</strong>dicates that the<br />
transmitted light field has an essentially uniform phase<br />
across its entire transverse profile. Normally one would<br />
expect the phase of a light field transmitted through a<br />
strongly nonl<strong>in</strong>ear medium to be highly nonuniform as<br />
a consequence of transverse <strong>in</strong>tensity variations. The<br />
uniformity of the phase <strong>in</strong> the present case is rem<strong>in</strong>iscent<br />
of similar behavior that occurs <strong>in</strong> the formation<br />
of optical solitons, although we stress that we have no<br />
113901-2 113901-2
VOLUME 88, NUMBER 11 PHYSICAL REVIEW LETTERS 18MARCH 2002<br />
FIG. 3. Interferogram of the near-field light distribution for a<br />
case <strong>in</strong> which three filaments are formed, superimposed with a<br />
contour map of the filament <strong>in</strong>tensity. Note that the light leav<strong>in</strong>g<br />
the <strong>in</strong>teraction region has a nearly uniform phase distribution.<br />
direct evidence that soliton formation is occurr<strong>in</strong>g <strong>in</strong> our<br />
experiment.<br />
We have also found that the light leav<strong>in</strong>g the sodium <strong>in</strong>teraction<br />
region possesses strong spatial correlations. In<br />
perform<strong>in</strong>g this measurement we adjusted the <strong>in</strong>put conditions<br />
[see Fig. 2(c)] so that <strong>in</strong> the near field the output<br />
consists of two spots carry<strong>in</strong>g nearly equal power. We f<strong>in</strong>d<br />
that the noise <strong>in</strong> the difference of the two output <strong>in</strong>tensities<br />
is smaller than the noise <strong>in</strong> the sum of the two output<br />
<strong>in</strong>tensities, show<strong>in</strong>g that the two components of the output<br />
are correlated <strong>in</strong> their fluctuations. Efforts to lower the<br />
noise floor of our detection apparatus and test the degree<br />
of correlation at the level of the standard quantum limit are<br />
<strong>in</strong> progress.<br />
Our experimental observations are <strong>in</strong> good agreement<br />
with the predictions of standard models of nonl<strong>in</strong>ear optical<br />
self-action effects. A key parameter that determ<strong>in</strong>es<br />
the properties of self-action effects is the critical power<br />
for self-focus<strong>in</strong>g, which is given <strong>by</strong> P cr l 2 8n 2 , where<br />
n 2 is the coefficient of the <strong>in</strong>tensity dependent refractive<br />
<strong>in</strong>dex. It is well known that self-focus<strong>in</strong>g can occur<br />
only if the laser power exceeds P cr , and that (to first<br />
approximation) the process of filamentation leads to the<br />
creation of multiple components, each conta<strong>in</strong><strong>in</strong>g power<br />
P cr . Under our typical experimental conditions of a number<br />
density of N 8 3 10 12 and a detun<strong>in</strong>g of D2p <br />
2 GHz, the optical constants of sodium vapor have the values<br />
[17] x 1 1.6 3 10 25 esu, x 3 2.5 3 10 26 esu,<br />
n 2 9 3 10 28 cm 2 W 21 , and I sat 1.6 kW cm 22 . The<br />
critical power under these conditions is thus given <strong>by</strong><br />
P cr 5.0 mW, <strong>in</strong> good qualitative agreement with the<br />
measured power of 2.0 mW of each spot <strong>in</strong> Fig. 3. The<br />
<strong>in</strong>tensity of the light with<strong>in</strong> each spot <strong>in</strong> Fig. 3 (of diameter<br />
30 mm at the exit w<strong>in</strong>dow) is 0.7 kW cm 22 . This value<br />
is less than but of the order of the calculated value of the<br />
saturation <strong>in</strong>tensity quoted above and supports the view<br />
that <strong>in</strong>cipient saturation of the nonl<strong>in</strong>ear optical response<br />
has limited the further collapse of the optical filaments under<br />
our exerimental conditions.<br />
To establish more explicitly the orig<strong>in</strong> of pattern formation<br />
<strong>in</strong> our experiment, we have performed numerical model<strong>in</strong>g<br />
of pattern formation <strong>in</strong> the propagation of a laser field<br />
through a saturable [18] nonl<strong>in</strong>ear optical medium. We beg<strong>in</strong><br />
with the scalar wave equation <strong>in</strong> the form<br />
µ<br />
2ik ≠ ≠z 1=2 T<br />
∂E 24pk 2 x 1<br />
1 1 jEE sat j 2 E , (1)<br />
where E Ex, y, z is the electric field envelope function<br />
and E sat is the saturation field amplitude. We solve this<br />
equation numerically on a 96 3 96 transverse grid under<br />
conditions similar to those of our experiment. The <strong>in</strong>put<br />
field was seeded with 3%, spatially d-correlated amplitude<br />
noise. A typical outcome of the calculation is shown <strong>in</strong><br />
Fig. 4. The beam <strong>in</strong>itially undergoes strong self-focus<strong>in</strong>g,<br />
followed <strong>by</strong> oscillations and the development of r<strong>in</strong>gs. After<br />
eject<strong>in</strong>g some filaments that disperse <strong>in</strong> the transverse<br />
dimensions, the beam breaks up <strong>in</strong>to three peaks that ma<strong>in</strong>ta<strong>in</strong><br />
their size and shape as they slowly drift apart. This<br />
behavior is similar to that described earlier <strong>by</strong> Firth and<br />
Skryab<strong>in</strong> [19]. We f<strong>in</strong>d that different realizations of the <strong>in</strong>put<br />
noise lead to filaments with vary<strong>in</strong>g sizes and relative<br />
positions, but that the f<strong>in</strong>al number of filaments is nearly<br />
always 3 for the specified <strong>in</strong>put conditions. Furthermore,<br />
it is found that this three-way filamentation occurs only<br />
for <strong>in</strong>put Gaussian beams whose radius and peak <strong>in</strong>tensity<br />
are nearly equal to those given above. For slightly weaker<br />
<strong>in</strong>put beams we f<strong>in</strong>d that the filamentation process favors<br />
the development of two spots, whereas for stronger <strong>in</strong>put<br />
FIG. 4. Numerical calculation of the propagation of a near-<br />
Gaussian laser beam through a medium with a saturable nonl<strong>in</strong>ear<br />
response. The beam is seen to break up <strong>in</strong>to three filaments,<br />
<strong>in</strong> agreement with the experimental observations presented <strong>in</strong><br />
Fig. 1. The <strong>in</strong>put conditions are those of the experiment, namely<br />
the peak <strong>in</strong>put <strong>in</strong>tensity is 4 times the saturation <strong>in</strong>tensity and<br />
the beam diameter is 0.13 mm.<br />
113901-3 113901-3
VOLUME 88, NUMBER 11 PHYSICAL REVIEW LETTERS 18MARCH 2002<br />
beams more than three spots are created. In perform<strong>in</strong>g the<br />
calculation shown <strong>in</strong> Fig. 4, we took the <strong>in</strong>put beam to have<br />
a peak <strong>in</strong>tensity of 4 times the saturation <strong>in</strong>tensity and took<br />
the <strong>in</strong>put (Gaussian) beam diameter to be 130 mm, where<br />
the measured value is 180 mm. This agreement is quite<br />
reasonable <strong>in</strong> light of the fact that our theoretical model<br />
does not treat the multilevel structure of the sodium atom.<br />
In summary, we have observed a dramatic example of<br />
optical pattern formation <strong>in</strong> which a s<strong>in</strong>gle laser beam<br />
propagat<strong>in</strong>g through atomic sodium vapor without feedback<br />
develops a stable, regular transverse structure. In<br />
particular, a three-filament near-field pattern lead<strong>in</strong>g to a<br />
honeycomb far-field pattern occurs at <strong>in</strong>tensities near the<br />
saturation <strong>in</strong>tensity and at powers larger than (but of the<br />
order of magnitude of) the critical power for self-focus<strong>in</strong>g.<br />
The three-filament pattern has a uniform phase profile and<br />
strongly correlated power fluctuations, which suggest that<br />
it is perhaps a quantum image. These observations are also<br />
<strong>in</strong> good agreement with numerical simulations of filamentation<br />
<strong>in</strong> a two-level medium.<br />
This work was supported <strong>by</strong> ONR Grant<br />
No. N00014-99-1-0539. D. J. G. gratefully acknowledges<br />
the support of NSF Grant No. PHY-9876988. The<br />
authors gratefully acknowledge fruitful discussions on<br />
the contents of this paper with W. J. Firth, H. M. Gibbs,<br />
G. Khitrova, F. A. Narducci, K. J. Parker, and A. M.<br />
Tekalp.<br />
[1] M. Cross and P. Hohenberg, Rev. Mod. Phys. 65, 851<br />
(1993).<br />
[2] See, for <strong>in</strong>stance, the special issues of J. Opt. Soc. Am. B<br />
[7, Nos. 6 and 7 (1990)] deal<strong>in</strong>g with transverse effects <strong>in</strong><br />
nonl<strong>in</strong>ear optical systems and, especially, the overview article<br />
<strong>by</strong> N. B. Abraham and W. J. Firth, J. Opt. Soc. Am. B<br />
7, 951 (1990). See also Self-Organization <strong>in</strong> Optical Systems<br />
and Applications <strong>in</strong> Information Technology, edited<br />
<strong>by</strong> M. A. Vorontsov and W. B. Miller (Spr<strong>in</strong>ger, Berl<strong>in</strong>,<br />
1995).<br />
[3] V. L. Koval’chuk et al., Sov. J. Quantum Electron. 7, 495<br />
(1977); L. A. Lugiato et al., Philos. Trans. R. Soc. London<br />
A 354, 767 (1996); S. K. Choi, M. Vasilyev, and P. Kumar,<br />
Phys. Rev. Lett. 83, 1938 (1999); M. I. Kolobov and<br />
C. Fabre, Phys. Rev. Lett. 85, 3789 (2000); A. N. Boto<br />
et al., Phys. Rev. Lett. 85, 2733 (2000); G. S. Agarwal<br />
et al., Phys. Rev. Lett. 86, 1389 (2001).<br />
[4] A. Gatti and L. Lugiato, Phys. Rev. A 52, 1675 (1995);<br />
I. Marzoli, A. Gatti, and L. A. Lugiato, Phys. Rev. Lett.<br />
78, 2092 (1997).<br />
[5] J. J. Hopfield, Proc. Natl. Acad. Sci. U.S.A. 79, 2554<br />
(1982); J. H. Hong and D. Psaltis, <strong>in</strong> Contemporary Nonl<strong>in</strong>ear<br />
Optics, edited <strong>by</strong> G. P. Agrawal and R. W. Boyd (Academic<br />
Press, San Diego, 1992).<br />
[6] M. F. Barnsley, Fractals Everywhere (Academic Press,<br />
Boston, 1988); M. Vetterli and J. Kovacevic, Wavelets and<br />
Subband Cod<strong>in</strong>g (Prentice Hall, Englewood Cliffs, NJ,<br />
1995).<br />
[7] Throughout this Letter we use the term filamentation to<br />
mean simply the breakup of a laser beam <strong>in</strong>to multiple<br />
transverse components <strong>by</strong> means of nonl<strong>in</strong>ear optical<br />
self-action effects. This is the sense used recently, for <strong>in</strong>stance,<br />
<strong>by</strong> S. Tzortzakis et al., Phys. Rev. Lett. 86, 5470<br />
(2001). It should be noted that some workers use the word<br />
filamentation <strong>in</strong> a different, more restricted sense to mean<br />
the breakup of a beam <strong>in</strong>to one or more components which<br />
subsequently propagate stably through the material system<br />
as spatial solitons.<br />
[8] J. E. Bjorkholm and A. Ashk<strong>in</strong>, Phys. Rev. Lett. 32, 129<br />
(1974); D. J. Harter, P. Narum, M. G. Raymer, and R. W.<br />
Boyd, Phys. Rev. Lett. 46, 1192 (1981); D. J. Gauthier,<br />
M. S. Malcuit, A. L. Gaeta, and R. W. Boyd, Phys. Rev.<br />
Lett. 64, 1721 (1990); J. Pender and L. Hessel<strong>in</strong>k, J. Opt.<br />
Soc. Am. B 7, 1361 (1990); M. Kauranen et al., Opt. Lett.<br />
16, 943 (1991); A. Petrossian et al., Europhys. Lett. 18,<br />
689 (1992); B. Rhricht, T. Ackerman, and W. Lange, Appl.<br />
Phys. B 72, 21 (2001).<br />
[9] G. Grynberg, A. Maître, and A. Petrossian, Phys. Rev. Lett.<br />
72, 2379 (1994); G. D’Alessandro and W. J. Firth, Phys.<br />
Rev. Lett. 66, 2597 (1991); B. Schapers et al., Phys. Rev.<br />
Lett. 85, 748 (2000).<br />
[10] K. Staliunas and V. J. Sánchez-Morcillo, Opt. Commun.<br />
177, 389 (2000).<br />
[11] D. J. Gauthier et al., Phys. Rev. Lett. 61, 1827 (1988);<br />
G. Grynberg et al., Opt. Commun. 67, 363 (1988);<br />
M. Le Berre et al., Phys. Rev. A 43, 6345 (1991); A. L.<br />
Gaeta et al., J. Opt. Soc. Am. B 6, 1709 (1989).<br />
[12] F. Papoff et al., Phys. Rev. A 48, 634 (1993); R. MacDonald<br />
and H. Danilewski, Mol. Cryst. Liq. Cryst. 251, 145<br />
(1994); R. Herrero et al., Phys. Rev. Lett. 82, 4627 (1999).<br />
[13] Far-field hexagonal pattern formation was observed previously<br />
<strong>in</strong> photorefractive crystals, where the nature of<br />
the nonl<strong>in</strong>ear coupl<strong>in</strong>g is quite different from that of our<br />
experiment. See, for <strong>in</strong>stance, P. M. Lushnikov and A. V.<br />
Mamaev, Opt. Lett. 24, 1511 (1999); A. V. Mamaev and<br />
M. Saffman, Opt. Lett. 22, 283 (1997); S. G. Odulov,<br />
M. Yu. Goulkov, and O. A. Sh<strong>in</strong>karenko, Phys. Rev. Lett.<br />
83, 3637 (1999).<br />
[14] M. Vaupel, A. Maître, and C. Fabre, Phys. Rev. Lett. 83,<br />
5278 (1999).<br />
[15] D. Grischkowsky, Phys. Rev. Lett. 24, 866 (1970); J. W.<br />
Grantham, H. M. Gibbs, G. Khitrova, J. F. Valley, and Xu<br />
Jiaj<strong>in</strong>, Phys. Rev. Lett. 66, 1422 (1991); B. D. Paul, M. L.<br />
Dowell, A. Gallagher, and J. Cooper, Phys. Rev. A 59,<br />
4784 (1999).<br />
[16] G. Grynberg and L. A. Lugiato, Opt. Commun. 101, 69<br />
(1993); A. Gatti and S. Manc<strong>in</strong>i, Phys. Rev. A 65, 013816<br />
(2002).<br />
[17] R. W. Boyd, Nonl<strong>in</strong>ear Optics (Academic Press, Boston,<br />
1992). See, for <strong>in</strong>stance the numerical example presented<br />
at the end of Section 5.3.<br />
[18] J. M. Soto-Crespo, E. M. Wright, and N. N. Akhmediev,<br />
Phys. Rev. A 45, 3168 (1992).<br />
[19] W. J. Firth and D. V. Skryab<strong>in</strong>, Phys. Rev. Lett. 79, 2450<br />
(1997).<br />
113901-4 113901-4
![Phase retrieval algorithms: a personal tour [Invited] - The Institute of ...](https://img.yumpu.com/25023725/1/190x249/phase-retrieval-algorithms-a-personal-tour-invited-the-institute-of-.jpg?quality=85)