COMMENT ON ESTIMATION OF GREENFIELD RUNOFF RATES ...
COMMENT ON ESTIMATION OF GREENFIELD RUNOFF RATES ...
COMMENT ON ESTIMATION OF GREENFIELD RUNOFF RATES ...

You also want an ePaper? Increase the reach of your titles
YUMPU automatically turns print PDFs into web optimized ePapers that Google loves.
National Hydrology Seminar 2003<br />
Tony Cawley<br />
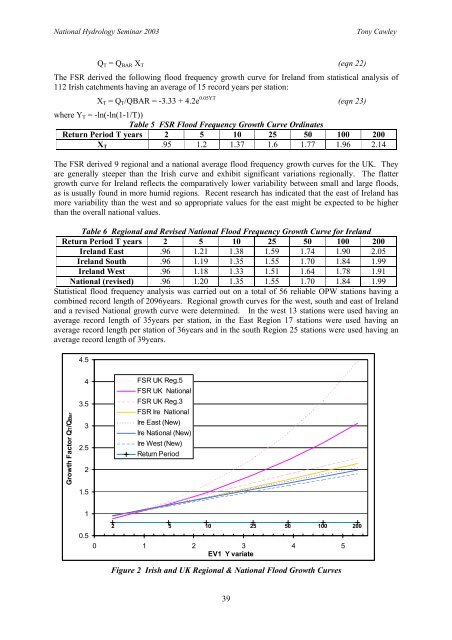
Q T = Q BAR X T (eqn 22)<br />
The FSR derived the following flood frequency growth curve for Ireland from statistical analysis of<br />
112 Irish catchments having an average of 15 record years per station:<br />
X T = Q T /QBAR = -3.33 + 4.2e 0.05YT (eqn 23)<br />
where Y T = -ln(-ln(1-1/T))<br />
Table 5 FSR Flood Frequency Growth Curve Ordinates<br />
Return Period T years 2 5 10 25 50 100 200<br />
X T .95 1.2 1.37 1.6 1.77 1.96 2.14<br />
The FSR derived 9 regional and a national average flood frequency growth curves for the UK. They<br />
are generally steeper than the Irish curve and exhibit significant variations regionally. The flatter<br />
growth curve for Ireland reflects the comparatively lower variability between small and large floods,<br />
as is usually found in more humid regions. Recent research has indicated that the east of Ireland has<br />
more variability than the west and so appropriate values for the east might be expected to be higher<br />
than the overall national values.<br />
Table 6 Regional and Revised National Flood Frequency Growth Curve for Ireland<br />
Return Period T years 2 5 10 25 50 100 200<br />
Ireland East .96 1.21 1.38 1.59 1.74 1.90 2.05<br />
Ireland South .96 1.19 1.35 1.55 1.70 1.84 1.99<br />
Ireland West .96 1.18 1.33 1.51 1.64 1.78 1.91<br />
National (revised) .96 1.20 1.35 1.55 1.70 1.84 1.99<br />
Statistical flood frequency analysis was carried out on a total of 56 reliable OPW stations having a<br />
combined record length of 2096years. Regional growth curves for the west, south and east of Ireland<br />
and a revised National growth curve were determined. In the west 13 stations were used having an<br />
average record length of 35years per station, in the East Region 17 stations were used having an<br />
average record length per station of 36years and in the south Region 25 stations were used having an<br />
average record length of 39years.<br />
4.5<br />
Growth Factor QT/QBar<br />
4<br />
3.5<br />
3<br />
2.5<br />
2<br />
1.5<br />
FSR UK Reg.5<br />
FSR UK National<br />
FSR UK Reg.3<br />
FSR Ire National<br />
Ire East (New)<br />
Ire National (New)<br />
Ire West (New)<br />
Return Period<br />
1<br />
0.5<br />
2<br />
5 10<br />
25 50<br />
100 200<br />
0 1 2 3 4 5<br />
EV1 Y variate<br />
Figure 2 Irish and UK Regional & National Flood Growth Curves<br />
39