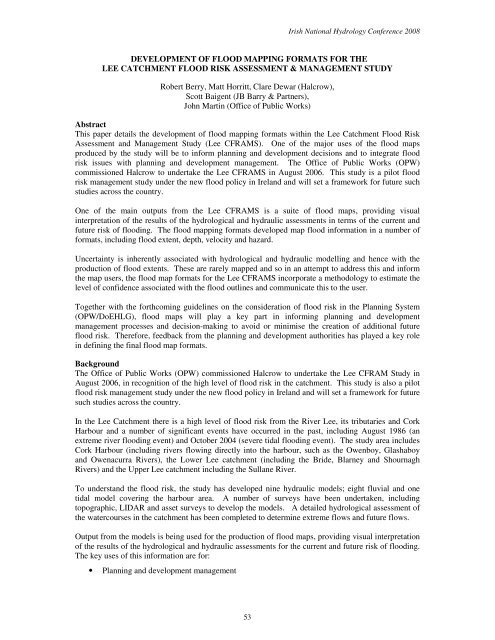
DEVELOPMENT OF FLOOD MAPPING FORMATS FOR THE LEE ...
DEVELOPMENT OF FLOOD MAPPING FORMATS FOR THE LEE ...
DEVELOPMENT OF FLOOD MAPPING FORMATS FOR THE LEE ...

Create successful ePaper yourself
Turn your PDF publications into a flip-book with our unique Google optimized e-Paper software.
Irish National Hydrology Conference 2008<br />
<strong>DEVELOPMENT</strong> <strong>OF</strong> <strong>FLOOD</strong> <strong>MAPPING</strong> <strong><strong>FOR</strong>MATS</strong> <strong>FOR</strong> <strong>THE</strong><br />
<strong>LEE</strong> CATCHMENT <strong>FLOOD</strong> RISK ASSESSMENT & MANAGEMENT STUDY<br />
Robert Berry, Matt Horritt, Clare Dewar (Halcrow),<br />
Scott Baigent (JB Barry & Partners),<br />
John Martin (Office of Public Works)<br />
Abstract<br />
This paper details the development of flood mapping formats within the Lee Catchment Flood Risk<br />
Assessment and Management Study (Lee CFRAMS). One of the major uses of the flood maps<br />
produced by the study will be to inform planning and development decisions and to integrate flood<br />
risk issues with planning and development management. The Office of Public Works (OPW)<br />
commissioned Halcrow to undertake the Lee CFRAMS in August 2006. This study is a pilot flood<br />
risk management study under the new flood policy in Ireland and will set a framework for future such<br />
studies across the country.<br />
One of the main outputs from the Lee CFRAMS is a suite of flood maps, providing visual<br />
interpretation of the results of the hydrological and hydraulic assessments in terms of the current and<br />
future risk of flooding. The flood mapping formats developed map flood information in a number of<br />
formats, including flood extent, depth, velocity and hazard.<br />
Uncertainty is inherently associated with hydrological and hydraulic modelling and hence with the<br />
production of flood extents. These are rarely mapped and so in an attempt to address this and inform<br />
the map users, the flood map formats for the Lee CFRAMS incorporate a methodology to estimate the<br />
level of confidence associated with the flood outlines and communicate this to the user.<br />
Together with the forthcoming guidelines on the consideration of flood risk in the Planning System<br />
(OPW/DoEHLG), flood maps will play a key part in informing planning and development<br />
management processes and decision-making to avoid or minimise the creation of additional future<br />
flood risk. Therefore, feedback from the planning and development authorities has played a key role<br />
in defining the final flood map formats.<br />
Background<br />
The Office of Public Works (OPW) commissioned Halcrow to undertake the Lee CFRAM Study in<br />
August 2006, in recognition of the high level of flood risk in the catchment. This study is also a pilot<br />
flood risk management study under the new flood policy in Ireland and will set a framework for future<br />
such studies across the country.<br />
In the Lee Catchment there is a high level of flood risk from the River Lee, its tributaries and Cork<br />
Harbour and a number of significant events have occurred in the past, including August 1986 (an<br />
extreme river flooding event) and October 2004 (severe tidal flooding event). The study area includes<br />
Cork Harbour (including rivers flowing directly into the harbour, such as the Owenboy, Glashaboy<br />
and Owenacurra Rivers), the Lower Lee catchment (including the Bride, Blarney and Shournagh<br />
Rivers) and the Upper Lee catchment including the Sullane River.<br />
To understand the flood risk, the study has developed nine hydraulic models; eight fluvial and one<br />
tidal model covering the harbour area. A number of surveys have been undertaken, including<br />
topographic, LIDAR and asset surveys to develop the models. A detailed hydrological assessment of<br />
the watercourses in the catchment has been completed to determine extreme flows and future flows.<br />
Output from the models is being used for the production of flood maps, providing visual interpretation<br />
of the results of the hydrological and hydraulic assessments for the current and future risk of flooding.<br />
The key uses of this information are for:<br />
• Planning and development management<br />
53
Irish National Hydrology Conference 2008<br />
• Flood risk management planning and design<br />
• Public awareness and preparedness<br />
• Emergency response planning<br />
Each of these uses requires different levels of information and the flood mapping formats take this into<br />
account. The formats developed map flood information in a number of ways, including flood extent,<br />
depth, velocity and hazard.<br />
Summary of hydrological assessment<br />
The hydrological analysis undertaken in Lee CFRAMS was centred on applying long term flow<br />
records to flood estimates for gauged and ungauged subcatchments. A broad overview of the<br />
hydrology methodology is provided below:<br />
Maximise record accuracy<br />
A hydraulic model based review of rating curves was undertaken for 11 of the gauges used in the<br />
analysis to improve high flow accuracy.<br />
Index Flood Estimation (Q med )<br />
Based on UK Flood Estimation Handbook 1 (FEH) recommendations, the median annual maximum<br />
flood (Q med ) was adopted as the index flood over the traditional Flood Studies Report 2 (FSR) mean<br />
annual maximum flood (Q bar ).<br />
Gauged catchment Q med values were derived<br />
directly for the statistical records. Gauged<br />
Q med values were then inferred to ungauged<br />
catchments using the FEH Donor Catchment<br />
approach, thereby providing either a direct<br />
or indirect correlation of all flood estimates<br />
to actual flood records. This approach is<br />
based on deriving scaling SPR and T p<br />
parameters at gauged catchments, and<br />
applying the scaling parameters to ungauged<br />
catchments.<br />
Pooled Growth Curves<br />
Using the L-Moments distribution fitting<br />
techniques presented in FEH and Hosking et<br />
Growth factor (Q/Qmed)<br />
al 1997 3 , it was found that the study gauged records more closely followed the GEV as opposed to GL<br />
distributions. Based on the length of record, a return period of approximately 1 in 50 years was<br />
supported by the statistical record. By averaging study L-Moment ratios, the derived pooled growth<br />
curve closely matched the FSR Ireland growth curve for return periods less than the 1 in 50 year.<br />
Based on this correlation at mid range return periods, the FSR Ireland growth curve was used for<br />
return periods greater 1 in 50 years (Figure 1).<br />
Design Flood Estimates<br />
Design flood estimates for return periods between 1 in 2 year and 1 in 1000 year events were derived<br />
for a range of durations using the FSR Unit Hydrograph techniques, applying the derived calling<br />
parameters and study growth curve.<br />
4.00<br />
3.50<br />
3.00<br />
2.50<br />
2.00<br />
1.50<br />
1.00<br />
0.50<br />
Return Period (yr)<br />
2 5 10 20 50 100 200 1000<br />
0.00<br />
0 1 2 3 4 5 6 7<br />
Gumbel Reduced Variate<br />
Pooled Growth Curve Pooled 95%ile FSR Growth Curve<br />
Figure 1: Pooled Growth Curve versus FSR Ireland<br />
Growth Curve<br />
1 Centre of Ecology and Hydrology. Flood Estimation Handbook Vol 1-5, 1999<br />
2 NERC (National Environment Research Council). Flood Studies Report. 1975<br />
3 Hosking, J. R. M. Wallis, J.R. Regional Frequency Analysis. An Approach Based on L-Moments. 1997<br />
54
Irish National Hydrology Conference 2008<br />
Future Flood Estimates<br />
There are a number of drivers that will influence future flood risk in the Lee catchment and the<br />
estimates of these drivers vary. In the study we have looked at two scenarios, the ‘Mid Range Future<br />
Scenario’ (MRFS) which considers the more likely estimates of changes to the drivers by 2100. To<br />
allow for future adaptability of flood defence measures, a ‘High End Future Scenario’ (HEFS) has also<br />
been derived, representing extreme changes in the respective drivers by 2100.<br />
Figure 2: Catchments/model areas for the Lee CFRAM Study<br />
Summary of hydraulic modelling<br />
Hydraulic modelling for the Lee CFRAMS has been completed. The nine models and the main urban<br />
areas in each model are shown in Table 1.<br />
Model<br />
Urban Area<br />
1 - River Owenboy Carrigaline; Ballinhassig; Ballygarvan<br />
2 - Carrigtohill Carrigtohill<br />
3 - River Owennacurra Midleton<br />
4 - River Glashaboy Sallybrook-Glanmire; Cork City<br />
5 - Sullane / Upper Lee Macroom; Inse Geimhleach; Béal Átha an Ghaorthaidh<br />
Baile Bhuirne; Baile Mhic Íre<br />
6 - Tramore and Douglas River Cork City; Douglas<br />
7 - River Bride Cork City<br />
8 - Lower Lee Ballincollig; Blarney; Tower; Crookstown; Cork City<br />
9 - Cork Harbour Crosshaven; Whitegate; Cobh; Monkstown<br />
Table 1: Hydraulic models and main urban areas<br />
The Lee CFRAM Study has modelled 250km of rivers with 86km of river located within the urban<br />
areas (UA) and 164km of rivers within the rural areas (RA). In the urban areas the level of complexity<br />
in the model is much higher, with closer cross sections and greater detail in out-of-bank flow routes.<br />
Five of the models in Table 1 are ISIS 1d hydrodynamic models, three models are ISIS 1d2d linked<br />
hydrodynamic models and the harbour area is a DIVAST 2d hydrodynamic model. They have been<br />
built using topographic, asset and LiDAR surveys commissioned for the study. We have carried out<br />
calibration of five models and they have represented the actual events well.<br />
55
Irish National Hydrology Conference 2008<br />
Development of flood map formats<br />
Flood maps are one of the main outputs of the hydrologic and hydraulic assessments and are the<br />
medium by which model results are communicated. Results are being communicated differently<br />
depending on the end users role. Each user needs to understand and interpret the maps, therefore the<br />
method of communication needs to be consistent, clear and provide the information that they require<br />
to an appropriate level of detail. The following end user roles / requirements have been highlighted as<br />
part of the project:<br />
• Planning and development management<br />
• Flood risk management planning and design<br />
• Public awareness and preparedness<br />
• Emergency response planning<br />
The best method of transferring the information to the user has been discussed at a number of project<br />
meetings. End users have also been consulted to gauge their views on the proposed formats. At each<br />
stage of the process the available options have been narrowed down and finally formalised.<br />
Flood map types<br />
The Lee CFRAMS has created a range of map output types from the hydrologic and hydraulic modelling<br />
process. From the models we have created:<br />
• Flood extents – extent of flooding for a given Annual Exceedence Probability (AEP)<br />
• Flood depth grids – depth of water for a given flood<br />
• Flood velocity grids – velocity of water for a given flood<br />
• Flood hazard maps – flood hazard which shows the risk to people, based on Defra’s Flood<br />
Risk to People Phase 2 4 methodology<br />
These outputs are required to meet the needs of the end users and they will be in different formats,<br />
either hardcopy or electronically through OPWs flood mapping website 5 . Table 2 shows, the types of<br />
output required and the method of communication to each end user.<br />
Type<br />
End User Hardcopy Web<br />
Planning and development<br />
management<br />
Flood risk management<br />
planning and design<br />
Public awareness and<br />
preparedness<br />
Emergency response<br />
planning<br />
Flood<br />
extents<br />
Flood<br />
depth<br />
̌ ̌ ̌ ̌<br />
Output<br />
Flood<br />
velocity<br />
Flood<br />
hazard<br />
̌ ̌ ̌ ̌ ̌ ̌<br />
̌<br />
̌<br />
̌ ̌ ̌ ̌<br />
Table 2: Type of flood map produced for each end user<br />
Mapping produced<br />
The mapping produced as part of the Lee CFRAMS is comprehensive. Table 3 shows the deliverables<br />
as part of the study for each type of map for the current and future scenario.<br />
4 R&D Technical Report FD2321 –Risks to People – Phase 2, Defra, 2006<br />
5 www.floodmaps.ie<br />
56
Irish National Hydrology Conference 2008<br />
Requirement Current MRFS<br />
Hardcopy<br />
Flood Extent and Node Points 10, 1, 0.1% AEPs 10, 1, 0.1% AEPs<br />
Flood Depth 10, 1, 0.1% AEPs Not required<br />
Flood Velocity 10, 1, 0.1% AEPs Not required<br />
Flood Hazard 10, 1, 0.1% AEPs Not required<br />
Web<br />
Flood Extent and Node Points All 6 All<br />
Flood Depth All Not required<br />
Flood Velocity All Not required<br />
Flood Hazard All Not required<br />
Table 3: Flood mapping deliverables<br />
The format of the hardcopy fluvial flood extent map is shown in Figure 3 for the Owenacurra River.<br />
The key features of the flood mapping format adopted for the flood extents are:<br />
• Maps at 1:5k scale for urban areas and at 1:25k and with background mapping at 1:50k for<br />
rural areas with the mapping in greyscale.<br />
• Fluvial flood events are shown for 10, 1 and 0.1% AEPs, coloured using a transparent fill<br />
from dark blue to light blue. Points along the river centreline with a table on the map showing<br />
the flow for the 1% AEP and water level at each point and for each AEP shown for the<br />
existing situations.<br />
• Tidal flood events are shown for 10, 0.5 and 0.1% AEPs, coloured using a transparent fill<br />
from dark green to light green. Points along the edge of the flood extent at key locations, with<br />
a table on the map showing the water level at each point and for each AEP shown for the<br />
existing situations.<br />
• Fluvial and tidal maps are shown separately so that it is possible to see the source of flood<br />
risk.<br />
• Areas benefiting from defences are shown by a grey hatched area.<br />
• Uncertainty is shown by a changing flood extent outline: solid – high confidence; dashed –<br />
moderate confidence; dotted – low confidence. Outlines are blue, except for the 1% AEP<br />
which is in red to make it more visible.<br />
6 Where ‘All’ is stated in the table this means outputs for the 50, 20, 10, 4, 2, 1, 0.2, 0.1% AEPs<br />
57
Irish National Hydrology Conference 2008<br />
Hardcopy flood extent format<br />
Figure 3: Fluvial flooding on the Owenacurra River<br />
Figure 4 shows an example flood depth map. The format for the depth and velocity maps is similar to<br />
the flood extent map, with regard to the type of mapping and the scale of the mapping used. Both the<br />
depth and velocity maps are represented in six classifications, the depth map as a blue to purple<br />
‘colour ramp’ and the velocity maps as a yellow to purple ‘colour ramp’. These maps contain no<br />
tables of water levels or flows.<br />
Determining velocity from 1d models<br />
Trying to determine velocities in the floodplain from a 1d model is not straightforward. We have<br />
developed an approximate method for establishing the velocity and hence hazard maps from the 1d<br />
models by using the Manning’s equation.<br />
1 A<br />
V =<br />
n P<br />
2 / 3<br />
1/ 2<br />
S<br />
2 / 3 o<br />
[1]<br />
From the 1d models we can produce accurate depth grids. Using these we can assume that the area<br />
(A) is calculated as the grid cell size multiplied by the flood depth and the wetted perimeter (P). The<br />
slope component (S) was calculated in GIS from the DEM and approximated to a 50m cell resolution.<br />
58
Irish National Hydrology Conference 2008<br />
Flood depth and velocity mapping<br />
Figure 4: Flood depth map of the Owenacurra River<br />
Flood hazard maps<br />
Flood hazard maps show the risk which may be experienced by people at a particular AEP. This is<br />
calculated as a function of the depth and velocity of flood waters. The Lee CFRAMS is using the<br />
methodology and concepts shown in the Defra / EA guidance Flood Risks to People Phase 2 7 to<br />
calculate flood hazard.<br />
Flood hazard map formats are similar to the flood depth maps. The maps use graduated colours<br />
ranging from light yellow to red in four bands. These bands are described as:<br />
• Caution<br />
• Moderately dangerous for some people<br />
• Significant danger for most people<br />
• Extreme danger for all<br />
Flood hazard maps are of particular importance to OPW and emergency services in Ireland for<br />
response planning, as they can show where people will be safe in a given flood.<br />
Web / digital format<br />
All of the mapping for the Lee CFRAMS will be available on the internet through OPWs flood<br />
mapping website. This is currently being specified but it is envisaged that there will be several of<br />
levels of access provided, for flood risk management professionals and public users.<br />
Through a secure login, professionals will be able to access all of the outputs of the Lee CFRAMS and<br />
other future CFRAM studies. It is envisaged that they will be able to access the fluvial and tidal flood<br />
events for the full range of modelling outputs (50, 20, 10, 4, 2, 1, 0.2, 0.1% AEPs) for the current and<br />
7 R&D Technical Report FD2321 – Risks to People – Phase 2, Defra, 2006<br />
59
Irish National Hydrology Conference 2008<br />
future flood risk scenarios. The visual display of the maps, including the provision of node points and<br />
uncertainty lines will be similar to the hardcopy maps. Users will be able to select specific events by<br />
turning on/off layers and also being able to choose their zoom level.<br />
Public users will have a cut down version of the above system. It is envisaged that they will be able to<br />
view fluvial and tidal flood events for the 10, 1 and 0.1% AEPs and have a limited zoom which<br />
prevents them from focussing too closely on specific areas.<br />
Communication of uncertainty<br />
A rapid method for estimating and showing the uncertainty on the flood maps was developed and<br />
tested as part of the Lee CFRAM Study. The aim was to develop a method of estimating uncertainty<br />
that could be applied quickly and with a minimum of extra model simulations. The method uses 3<br />
steps to estimate and communicate the uncertainty in the flood maps to the user:<br />
1. The uncertainty in water levels for each return period is estimated, using a simple scoring<br />
method. Scores derived from Table 4 are combined with peak flow to give an estimate of<br />
uncertainty in the predicted water levels:<br />
S<br />
Q<br />
= SHydrolog<br />
y<br />
+ SComplexity<br />
[2]<br />
200<br />
Total<br />
+<br />
∆<br />
84−50%<br />
Total<br />
−<br />
h = 0.088S<br />
0.010<br />
[3]<br />
2. This is then transformed into a measure that represents how the uncertainty in water level will<br />
effect the location of the flood outline. This depends on the sensitivity of flood outline<br />
location to changes in water level, which can be determined from the difference in flood<br />
outlines produced by different magnitude floods (e.g. the 1% and 0.1% AEP flood events).<br />
Figure 5 illustrates this, and results in an expression for the horizontal uncertainty in shoreline<br />
location:<br />
∆x<br />
Uncertainty<br />
∆x<br />
=<br />
1000−100<br />
∆h<br />
∆h<br />
1000−100<br />
Uncertainty<br />
3. This gives a horizontal uncertainty for each point on the flood outline, which is then<br />
communicated to the user by using different linestyles, thicknesses or colours. The uncertainty<br />
is generally thresholded into 3 classes (low, medium, high) to allow it to be displayed clearly.<br />
In the Lee CFRAMS, uncertainties were classified as < 20m (low), 20-40m (medium) and ><br />
40m (high), and displayed as solid, dashed and dotted lines respectively.<br />
Index Flood Method<br />
Catchment Descriptors (Flood Studies Report) 4<br />
Catchment Descriptors (Flood Estimation Handbook) 8 3<br />
Short Record ≤ 10 years 2<br />
Long Record > 10 years 1<br />
1Not used for Irish catchments<br />
Model Complexity<br />
Complex - reservoir units, many inflows, and/or many branches 2<br />
Medium - some inflows, branches and structures 1<br />
Simple - few inflows, branches and structures 0<br />
Score<br />
Table 4: Scores used to determine uncertainty in water levels from hydrological method and<br />
complexity of the reach<br />
[4]<br />
8 Not used for Irish Catchments<br />
60
Irish National Hydrology Conference 2008<br />
This simple method was derived by applying more complex uncertainty estimation methods (Monte<br />
Carlo analysis and sensitivity analysis) to twelve test reaches of rivers in Ireland and the UK. The<br />
scoring method was then calibrated (i.e. the coefficients in equation 1 determined) using the results<br />
from these test reaches. Examples of the uncertainty on the Owenacurra River are shown in Figure 6.<br />
Figure 5: Shoreline uncertainty derived from 100 year and 1000 year flood outlines.<br />
Figure 6: Uncertainty lines on the flood extents for the Owenacurra River<br />
Role in planning and development<br />
In September of this year, the Department of Environment, Heritage and Local Government, jointly<br />
with the OPW, published Consultation Draft Guidelines for Local Authorities entitled “The Planning<br />
System and Flood Risk Management” 9 . These Guidelines aim to assist in the delivery of sustainable<br />
development through the integration of flood risk management into the planning process, and offer<br />
advice to planning authorities, council members and those promoting development, on the assessment<br />
and management of flood risk and its consideration in preparing Development Plans. Through the<br />
implementation of these Guidelines, flood maps, such as those developed on the Lee CFRAM Study,<br />
will play a key part in informing planning and development management processes and decisionmaking<br />
to avoid or minimise the creation of additional future flood risk.<br />
Chapter 2 of the Guidelines define flood-zones (geographical areas within which the likelihood of<br />
flooding is in a particular range) as a key tool in flood risk management within the planning process.<br />
The flood extents mapped in the Lee CFRAMS, as described in this paper, feed directly into the<br />
identification of the flood-zones defined in the Guidelines, and hence the flood mapping outputs from<br />
the Lee CFRAMS seamlessly facilitate the application of the recommended approaches set out within<br />
the Guidelines.<br />
9 Adamson, M., Cussen, N., Cooper J., Norton C., Brook D., 2008: The Planning System and Flood Risk<br />
Management – Draft Planning Guidelines for Ireland, National Hydrology Seminar, 2008.<br />
61
Irish National Hydrology Conference 2008<br />
One key planning principle of the Guidelines is the application of a precautionary approach, where<br />
necessary, to reflect the uncertainties in flooding datasets and flood risk assessment techniques. By<br />
explicitly representing the understood uncertainty of the flood extent outlines, whether this be high,<br />
medium or low, planners and decision-makers are provided with a clear indication of when the<br />
precautionary approach is appropriate or, indeed, necessary.<br />
In exceptional circumstances, for various reasons and subject to the Justification Test set out in the<br />
Guidelines, future development of areas at a high or moderate probability of flooding must be<br />
considered. In such areas, new development should be planned, designed and constructed in such a<br />
manner as to reduce and manage the flood risk in the most sustainable and practical way. In doing so,<br />
it is vital to understand not only the extent of flood risk, but also the nature of the hazard. This<br />
includes information relating to the flood depths and velocities across a range of flood probabilities.<br />
Provision of detailed flood depth and velocity mapping is invaluable in informing this design process,<br />
not only in relation to the effective management of flood risk (through measures such as appropriate<br />
location of vulnerable building-uses, and the application of flood resilience measures), but also in the<br />
development of flood emergency response planning.<br />
All aspects of the flood mapping formats produced on the Lee CFRAM Study, from the extent maps<br />
and uncertainty line-types, through to the depth and velocity hazard maps, directly facilitate the<br />
application of the recommendations of the Consultation Draft Guidelines, thus ensuring that flood risk<br />
is comprehensively managed and contributing to the aim of sustainable development into the future.<br />
Summary<br />
The Lee CFRAM Study is the pilot flood risk management study under the new flood policy in<br />
Ireland. To understand the flood risk, a hydrological and hydraulic assessment of the main<br />
watercourses in the Lee catchment has been undertaken.<br />
To communicate the flood risk a suite of flood maps comprising flood extent, depth, velocity and<br />
hazard maps have been generated. These provide a visual interpretation of the results for the current<br />
and future risk of flooding. The results are communicated to a wide variety of stakeholders through<br />
hard copy and web based formats.<br />
All aspects of the flood mapping formats produced on the Lee CFRAM Study, from the extent maps<br />
and uncertainty line-types, through to the depth and velocity hazard maps, directly facilitate the<br />
application of the recommendations of the Planning Systems Consultation Draft Guidelines.<br />
62