DEVELOPMENT OF FLOOD MAPPING FORMATS FOR THE LEE ...
DEVELOPMENT OF FLOOD MAPPING FORMATS FOR THE LEE ...
DEVELOPMENT OF FLOOD MAPPING FORMATS FOR THE LEE ...

You also want an ePaper? Increase the reach of your titles
YUMPU automatically turns print PDFs into web optimized ePapers that Google loves.
Irish National Hydrology Conference 2008<br />
• Flood risk management planning and design<br />
• Public awareness and preparedness<br />
• Emergency response planning<br />
Each of these uses requires different levels of information and the flood mapping formats take this into<br />
account. The formats developed map flood information in a number of ways, including flood extent,<br />
depth, velocity and hazard.<br />
Summary of hydrological assessment<br />
The hydrological analysis undertaken in Lee CFRAMS was centred on applying long term flow<br />
records to flood estimates for gauged and ungauged subcatchments. A broad overview of the<br />
hydrology methodology is provided below:<br />
Maximise record accuracy<br />
A hydraulic model based review of rating curves was undertaken for 11 of the gauges used in the<br />
analysis to improve high flow accuracy.<br />
Index Flood Estimation (Q med )<br />
Based on UK Flood Estimation Handbook 1 (FEH) recommendations, the median annual maximum<br />
flood (Q med ) was adopted as the index flood over the traditional Flood Studies Report 2 (FSR) mean<br />
annual maximum flood (Q bar ).<br />
Gauged catchment Q med values were derived<br />
directly for the statistical records. Gauged<br />
Q med values were then inferred to ungauged<br />
catchments using the FEH Donor Catchment<br />
approach, thereby providing either a direct<br />
or indirect correlation of all flood estimates<br />
to actual flood records. This approach is<br />
based on deriving scaling SPR and T p<br />
parameters at gauged catchments, and<br />
applying the scaling parameters to ungauged<br />
catchments.<br />
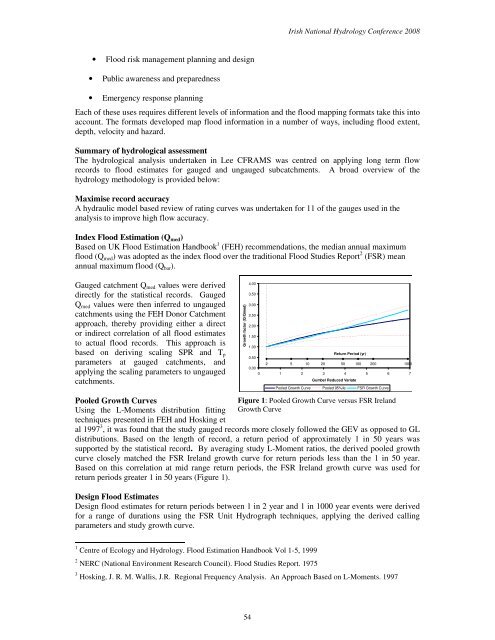
Pooled Growth Curves<br />
Using the L-Moments distribution fitting<br />
techniques presented in FEH and Hosking et<br />
Growth factor (Q/Qmed)<br />
al 1997 3 , it was found that the study gauged records more closely followed the GEV as opposed to GL<br />
distributions. Based on the length of record, a return period of approximately 1 in 50 years was<br />
supported by the statistical record. By averaging study L-Moment ratios, the derived pooled growth<br />
curve closely matched the FSR Ireland growth curve for return periods less than the 1 in 50 year.<br />
Based on this correlation at mid range return periods, the FSR Ireland growth curve was used for<br />
return periods greater 1 in 50 years (Figure 1).<br />
Design Flood Estimates<br />
Design flood estimates for return periods between 1 in 2 year and 1 in 1000 year events were derived<br />
for a range of durations using the FSR Unit Hydrograph techniques, applying the derived calling<br />
parameters and study growth curve.<br />
4.00<br />
3.50<br />
3.00<br />
2.50<br />
2.00<br />
1.50<br />
1.00<br />
0.50<br />
Return Period (yr)<br />
2 5 10 20 50 100 200 1000<br />
0.00<br />
0 1 2 3 4 5 6 7<br />
Gumbel Reduced Variate<br />
Pooled Growth Curve Pooled 95%ile FSR Growth Curve<br />
Figure 1: Pooled Growth Curve versus FSR Ireland<br />
Growth Curve<br />
1 Centre of Ecology and Hydrology. Flood Estimation Handbook Vol 1-5, 1999<br />
2 NERC (National Environment Research Council). Flood Studies Report. 1975<br />
3 Hosking, J. R. M. Wallis, J.R. Regional Frequency Analysis. An Approach Based on L-Moments. 1997<br />
54