National Hydrology Seminar 2007 - The Office of Public Works
National Hydrology Seminar 2007 - The Office of Public Works
National Hydrology Seminar 2007 - The Office of Public Works

You also want an ePaper? Increase the reach of your titles
YUMPU automatically turns print PDFs into web optimized ePapers that Google loves.
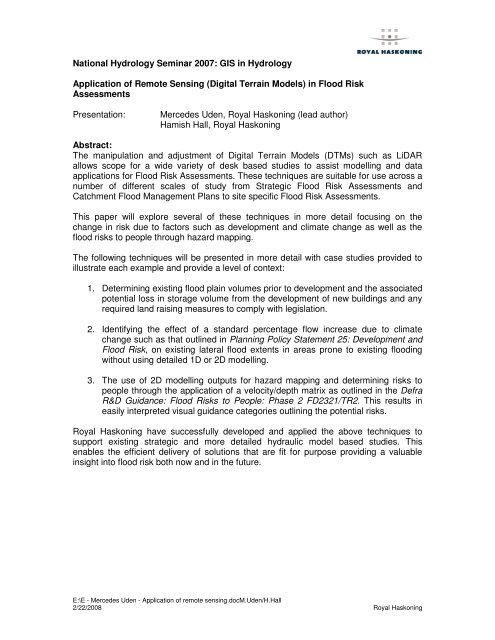
<strong>National</strong> <strong>Hydrology</strong> <strong>Seminar</strong> <strong>2007</strong>: GIS in <strong>Hydrology</strong><br />
Application <strong>of</strong> Remote Sensing (Digital Terrain Models) in Flood Risk<br />
Assessments<br />
Presentation:<br />
Mercedes Uden, Royal Haskoning (lead author)<br />
Hamish Hall, Royal Haskoning<br />
Abstract:<br />
<strong>The</strong> manipulation and adjustment <strong>of</strong> Digital Terrain Models (DTMs) such as LiDAR<br />
allows scope for a wide variety <strong>of</strong> desk based studies to assist modelling and data<br />
applications for Flood Risk Assessments. <strong>The</strong>se techniques are suitable for use across a<br />
number <strong>of</strong> different scales <strong>of</strong> study from Strategic Flood Risk Assessments and<br />
Catchment Flood Management Plans to site specific Flood Risk Assessments.<br />
This paper will explore several <strong>of</strong> these techniques in more detail focusing on the<br />
change in risk due to factors such as development and climate change as well as the<br />
flood risks to people through hazard mapping.<br />
<strong>The</strong> following techniques will be presented in more detail with case studies provided to<br />
illustrate each example and provide a level <strong>of</strong> context:<br />
1. Determining existing flood plain volumes prior to development and the associated<br />
potential loss in storage volume from the development <strong>of</strong> new buildings and any<br />
required land raising measures to comply with legislation.<br />
2. Identifying the effect <strong>of</strong> a standard percentage flow increase due to climate<br />
change such as that outlined in Planning Policy Statement 25: Development and<br />
Flood Risk, on existing lateral flood extents in areas prone to existing flooding<br />
without using detailed 1D or 2D modelling.<br />
3. <strong>The</strong> use <strong>of</strong> 2D modelling outputs for hazard mapping and determining risks to<br />
people through the application <strong>of</strong> a velocity/depth matrix as outlined in the Defra<br />
R&D Guidance: Flood Risks to People: Phase 2 FD2321/TR2. This results in<br />
easily interpreted visual guidance categories outlining the potential risks.<br />
Royal Haskoning have successfully developed and applied the above techniques to<br />
support existing strategic and more detailed hydraulic model based studies. This<br />
enables the efficient delivery <strong>of</strong> solutions that are fit for purpose providing a valuable<br />
insight into flood risk both now and in the future.<br />
E:\E - Mercedes Uden - Application <strong>of</strong> remote sensing.docM.Uden/H.Hall<br />
2/22/2008 Royal Haskoning
Determination <strong>of</strong> flood plain volumes:<br />
Planning Policy Statement 25 (PPS25):Development and Flood Risk recommends that if<br />
flood plain volumes are removed from one area through development, space must be<br />
allowed for in another area to ensure that there is not a net reduction in flood storage<br />
capacity, which may affect this site or other sites downstream. Assessment <strong>of</strong> the loss <strong>of</strong><br />
flood plain volume due to development is therefore a key aspect in determining how<br />
much storage volume should be provided for mitigation and attenuation options for flood<br />
risk management.<br />
Using the outputs from either a 1D or 2D hydraulic model enables the maximum water<br />
elevation for a particular return period or flow to be determined. <strong>The</strong> model needs to be<br />
built to take account <strong>of</strong> out <strong>of</strong> bank flow, and 1D models such as ISIS or HEC-RAS<br />
should include storage areas or reservoirs to allow overland flow to be simulated. <strong>The</strong>se<br />
water levels are then used to flood a Digital Terrain Model (DTM) <strong>of</strong> the area to be<br />
developed, to assess the extent <strong>of</strong> flooding that may occur.<br />
For 1D models, the maximum water surface elevations at cross sections in the model<br />
are used to create an interpolated layer covering the channel extents to just beyond the<br />
top <strong>of</strong> bank locations. <strong>The</strong> creation <strong>of</strong> a Triangulated Irregular Network (TIN) creates a<br />
continuous surface along the extents <strong>of</strong> the modelled channel, representative <strong>of</strong> the<br />
changes in elevation along the longitudinal pr<strong>of</strong>ile <strong>of</strong> the hydraulic model. This TIN is<br />
then converted to a grid to allow it to be mosaiced along with a grid <strong>of</strong> the maximum<br />
water surface from the reservoirs or storage areas. This results in a grid based dataset<br />
<strong>of</strong> maximum water elevation covering the whole study area.<br />
For 2D models the grid output <strong>of</strong> water depth can be used as long as the resolution cell<br />
size is adjusted to match the cell size <strong>of</strong> the underlying DTM.<br />
<strong>The</strong> DTM data used for flood plain volume analysis is generally Light Detection and<br />
Ranging (LiDAR) data which is available from the Environment Agency and provides<br />
extensive coverage across England and Wales. Grid resolution varies from 0.5m to 2m<br />
with a RMS (Route Mean Square) vertical accuracy <strong>of</strong> +/- 0.15m. Both bare earth (DTM)<br />
models and Digital Elevation Models (DEMs) are available with the DEM taking account<br />
<strong>of</strong> building heights, structures and vegetation.<br />
For flood plain assessment a bare earth DTM is used with the buildings added back in.<br />
This prevents misleading results through the presence <strong>of</strong> trees and other large areas <strong>of</strong><br />
vegetation that may be present in the DEM potentially distorting the flooded extents but<br />
allows for the presence <strong>of</strong> flow rates around buildings to be accounted for. A buildings<br />
polygon dataset such as OS MasterMap is attributed with suitable building heights<br />
relative to the surrounding topography before being converted to a grid and combined<br />
with the underlying DTM grid. This creates a ‘building relief’ dataset as shown in Figure<br />
1. <strong>The</strong> proposed area <strong>of</strong> development can also be added to the buildings polygon<br />
dataset using information from planning documents and Master Plans to build a 3D<br />
projection <strong>of</strong> the built environment in the future. Adapted DTM datasets can be created<br />
for both pre and post development works.<br />
E:\E - Mercedes Uden - Application <strong>of</strong> remote sensing.docM.Uden/H.Hall<br />
2/22/2008 Royal Haskoning
<strong>The</strong> area <strong>of</strong> interest is then ‘flooded’ with the grid <strong>of</strong> maximum water elevations by<br />
subtracting the water levels from the adjusted DTM dataset. <strong>The</strong> positive values from the<br />
resulting grid are the areas where flooding will potentially occur.<br />
Figure 1: Buildings dataset stamped onto LiDAR DTM<br />
N<br />
©Crown Copyright. All rights reserved<br />
EA 100026380 2006<br />
By making an assessment <strong>of</strong> the fill volume <strong>of</strong> an area using the maximum water<br />
elevation grid before and after adjustment <strong>of</strong> the underlying DTM for increased<br />
development the difference due to post development building volume can be calculated.<br />
This area is normally the storage area or reservoir held within the 1D model. This allows<br />
the potential loss <strong>of</strong> flood plain volume to be calculated. <strong>The</strong>se calculations can be<br />
carried out using a tool such as Pr<strong>of</strong>ile Extractor.<br />
Connectivity within the DTM is assumed as walls and barriers are not taken account <strong>of</strong><br />
unless they are in the DTM as earth banks or specifically added to the data through the<br />
adjustment <strong>of</strong> the DTM.<br />
E:\E - Mercedes Uden - Application <strong>of</strong> remote sensing.docM.Uden/H.Hall<br />
2/22/2008 Royal Haskoning
Effects <strong>of</strong> a standard percentage flow increase on lateral flood extents:<br />
<strong>The</strong> possible impacts <strong>of</strong> climate change on fluvial flows are still being investigated. <strong>The</strong><br />
latest guidance given by Defra Flood and Coastal Defence Appraisal Guidance<br />
FCDPAG3 Economic Appraisal: Supplementary Note to Operating Authorities- Climate<br />
Change Impacts, October 2006 and contained within PPS25 suggests dealing with<br />
climate change by increasing the magnitude <strong>of</strong> peak flows by up to 20% from 2025 to<br />
2115. Assuming river flows are increased by 20% as a result <strong>of</strong> climate change, new<br />
future fluvial flood extents based on existing current scenario flood data can be created<br />
based on LiDAR DTM data as part <strong>of</strong> a broad scale methodology. This can be done<br />
without detailed hydraulic modelling and is therefore suited to strategic level studies. An<br />
example <strong>of</strong> where we have used this method is the Tamar Catchment Flood<br />
Management Plan (CFMP).<br />
<strong>The</strong> locations to investigate were identified through analysis <strong>of</strong> known flooding hotspots<br />
(using the Flood Reconnaissance Information System (FRIS), an Environment Agency<br />
dataset). <strong>The</strong> lateral increases in each <strong>of</strong> the areas affected by a 1% annual probability<br />
flood in each flooding hotspot were calculated using Flood Zone 3 extents. This is known<br />
as the lateral increase in flood extent expected due to climate change.<br />
Cross sections were created as a polyline dataset for the extent to be mapped,<br />
perpendicular to the river channel and at 50-100m spacing. <strong>The</strong>se cross sections were<br />
then attributed with the average height above sea level for the meeting point between<br />
cross section and current flood extent. This was not always equal on the right and left<br />
bank so an average was taken for each cross section to provide the mean flood extent<br />
water elevation level at each cross section as indicated in Figure 2. <strong>The</strong> flow increase<br />
was then determined based on the nature <strong>of</strong> the study i.e. 10%, 20% or 30%.<br />
Figure 2: use <strong>of</strong> flood extents to determine water elevations<br />
Points here used to create<br />
new flood extents<br />
Area increased<br />
by 20%- new<br />
flood extent<br />
Current flood<br />
extent: height<br />
attributed to data<br />
<strong>The</strong> cross sectional area (CSA) for the flood extent level average (at each cross section) is<br />
calculated using Pr<strong>of</strong>ile Extractor for each <strong>of</strong> the cross sections along the channel length.<br />
E:\E - Mercedes Uden - Application <strong>of</strong> remote sensing.docM.Uden/H.Hall<br />
2/22/2008 Royal Haskoning
This CSA can then be increased by the required percentage flow increase to determine a<br />
new water elevation level for the increased flows. By attributing each cross section with the<br />
projected future water level a TIN can be created for these water surface elevations to<br />
create a continuous surface along the extents <strong>of</strong> the channel.<br />
<strong>The</strong> area was then ‘flooded’ with the grid <strong>of</strong> maximum water elevations by subtracting the<br />
water levels from the adjusted DTM dataset as before. <strong>The</strong> positive values from the resulting<br />
grid are the areas where flooding will potentially occur. An example <strong>of</strong> these extents is given<br />
in Figure 3.<br />
Figure 3:<br />
Climate change extents for<br />
Altarnun, Tamar catchment<br />
for 1.0% annual probability<br />
flood. <strong>The</strong> orange area<br />
represents the climate<br />
change scenario.<br />
By digitising around these flooded areas a new lateral flood extent due to climate change can<br />
be created. A visual check followed by manual adjustment to the new flood extents should be<br />
carried out to verify and look for any situations where the new flood extent may be below the<br />
original flood extent due to the horizontal differences between left and right banks.<br />
E:\E - Mercedes Uden - Application <strong>of</strong> remote sensing.docM.Uden/H.Hall<br />
2/22/2008 Royal Haskoning
2D modelling outputs for hazard mapping<br />
Using 2D hydraulic modelling s<strong>of</strong>tware, flood events <strong>of</strong> different magnitudes can be modelled<br />
in order to find maximum flood extents and estimates <strong>of</strong> likely depths and velocity <strong>of</strong> moving<br />
floodwater. This can be used to create Flood Hazard mapping to provide an overview <strong>of</strong><br />
flood risk to people within the study area. Presenting flood risk in this way means that the<br />
impact <strong>of</strong> flooding can be easily understood. Flood Hazard mapping can be used to assess<br />
the flood risk at specific sites <strong>of</strong> existing and potential development in order to inform the<br />
allocation <strong>of</strong> development sites within the Local Development Framework (LDF) process.<br />
This enables us to define the possible access/egress routes available under flood conditions,<br />
the consequences <strong>of</strong> infilling flood plain and viable mitigation measures and provide a<br />
general overview on the safety <strong>of</strong> the site for redevelopment based on flood risk.<br />
<strong>The</strong> degree <strong>of</strong> hazard that floodwaters present to people (and to vehicles and property) is a<br />
function <strong>of</strong> both velocity and depth. <strong>The</strong> hazard rating used in our work is set out in the report<br />
Flood Risk Assessment Guidance for New Development Phase 2, Framework and Guidance<br />
for Assessing and Managing Flood Risk For New Development (FD2320/TR2) HR<br />
Wallingford (October 2005). <strong>The</strong> velocity/depth matrix used as part <strong>of</strong> this study is given in<br />
table 1.<br />
Table 1: Flood Hazard Matrix*<br />
Velocity<br />
Depth (m)<br />
(m/s) 0.05 0.10 0.20 0.30 0.40 0.50 0.60 0.80 1.00 1.50 2.00 2.50<br />
0.00<br />
0.10<br />
0.25<br />
0.50<br />
1.00<br />
1.50<br />
2.00<br />
2.50<br />
3.00<br />
3.50<br />
4.00<br />
4.50<br />
5.00<br />
*<strong>The</strong> green colour code is not specified in FD2320/TR2 and has been employed in order to show maximum flood extent<br />
Grids <strong>of</strong> depth and velocity can be directly output from the model or can be created from a<br />
point dataset <strong>of</strong> x,y,z values using a grid interpolation methodology. This information will be<br />
created from the underlying DTM used within the model. By analysing the combinations <strong>of</strong><br />
outputs <strong>of</strong> grids <strong>of</strong> depth and velocity from a 2D model the hazard rating for any location<br />
within the study area can be determined. This allows hazard ratings within different areas to<br />
be easily compared.<br />
Hazards are generally categorised into the following four degrees <strong>of</strong> hazard: low, moderate,<br />
significant and extreme. <strong>The</strong> colours in Table 1 correspond to the degree <strong>of</strong> flood hazard in<br />
E:\E - Mercedes Uden - Application <strong>of</strong> remote sensing.docM.Uden/H.Hall<br />
2/22/2008 Royal Haskoning
Table 2 and are based on the increasing severity <strong>of</strong> the combination <strong>of</strong> depth and velocity<br />
and its potential severity <strong>of</strong> risk. As a simplified explanation danger classifications are based<br />
on the groups <strong>of</strong> people that should be considered as falling into these danger<br />
classifications. <strong>The</strong>se groups <strong>of</strong> people are given in the description column <strong>of</strong> table 2.<br />
Table 2: Description <strong>of</strong> Hazard categories<br />
Degree <strong>of</strong> flood hazard Colour Code Description<br />
Low<br />
Caution<br />
Moderate<br />
Significant<br />
Extreme<br />
Danger for Some<br />
Includes children, the elderly, and the infirm<br />
Danger for most<br />
Includes the general public<br />
Danger for All<br />
Includes the emergency services<br />
We have created a series <strong>of</strong> SQL (Standard Query Language) queries that assess both data<br />
sets in order to categorise the flood risk in terms <strong>of</strong> Caution, Danger for Some, Danger for<br />
Most and Danger for All. <strong>The</strong> hazard becomes increasingly dangerous to people as depths<br />
and velocity increase. <strong>The</strong>se queries are applied to data points from grids <strong>of</strong> velocity and<br />
depth and attributed with the appropriate hazard matrix rating. This enables us to build up a<br />
hazard map across the study area which can be given a thematic legend to represent these<br />
risks spatially as shown in Figure 3.<br />
Figure 3 Flood Hazard Map for 1 in 200 year tidal event (defended)<br />
E:\E - Mercedes Uden - Application <strong>of</strong> remote sensing.docM.Uden/H.Hall<br />
2/22/2008 Royal Haskoning
Further queries and analysis can be carried out using these thematic maps such as the<br />
percentage <strong>of</strong> new development within an extreme flood risk area. This mapping can also be<br />
used to usefully inform the EA’s flood warning service and local emergency planning<br />
arrangements for potential development sites<br />
Conclusions<br />
This paper whilst by no means a definitive guide to the use <strong>of</strong> Remote Sensing within Flood<br />
Risk Assessments, provides an outline methodology for three key areas at this level <strong>of</strong> study.<br />
A significant amount <strong>of</strong> assessment can be carried out as part <strong>of</strong> a desk based study to<br />
inform the FRA process and provide key information as to the potential effect <strong>of</strong> development<br />
on the existing flood plain, the impact <strong>of</strong> flow increases through climate change and changes<br />
in land use practice as well as the potential risk to people particularly vulnerable groups in<br />
society. This enables all levels <strong>of</strong> the FRA process, as set out in PPS25 to provide a more<br />
informed solution to the developer, the Environment Agency and the local planning authority.<br />
This can provide significant benefits to the amount <strong>of</strong> time and resources required to deliver<br />
an FRA whether it has been carried out at the Regional, Strategic or Site-specific level.<br />
E:\E - Mercedes Uden - Application <strong>of</strong> remote sensing.docM.Uden/H.Hall<br />
2/22/2008 Royal Haskoning