automated flood estimation using gis - The Office of Public Works
automated flood estimation using gis - The Office of Public Works
automated flood estimation using gis - The Office of Public Works
You also want an ePaper? Increase the reach of your titles
YUMPU automatically turns print PDFs into web optimized ePapers that Google loves.
Many <strong>of</strong> the above catchment descriptors are being used in the FSU research (OPW, 2007). <strong>The</strong> above set <strong>of</strong> catchment<br />
descriptors was used to apply FEH methods to Ireland. Ireland is not covered by most <strong>of</strong> the geographic data used to derive the<br />
original FEH catchment descriptors for the UK. In some cases, equivalent datasets could be identified. Rather more effort was<br />
needed to derive some other datasets, making the best use <strong>of</strong> available digital information and accepting that it would not be<br />
possible to obtain data <strong>of</strong> the same quality as the original FEH in the time available. In brief, the following information was used:<br />
• A digital elevation model (DTM) with 20m grid size, processed to be “hydrologically correct”, i.e. to ensure that drainage paths<br />
can be followed continuously from source to sea. A digital river network was used to aid the processing. <strong>The</strong> DTM was used to<br />
obtain catchment boundaries and land form descriptors.<br />
• A vector map <strong>of</strong> lake shorelines which was connected to the river network and used to derive FARL.<br />
• A grid <strong>of</strong> annual average rainfall for 1961-90, used for SAAR and also to assist in an approximate calculation <strong>of</strong> PROPWET.<br />
• Land cover data from the CORINE Land Cover 2000 project (Bossard et al, 2000), used to identify urban areas and to assist in<br />
developing the HOST classification for peatlands.<br />
• <strong>The</strong> General Soil Map <strong>of</strong> Ireland, which shows 44 soil associations (Gardiner & Ratford, 1980). This was used, in conjunction<br />
with a partial map <strong>of</strong> Quaternary deposits (subsoil) (Fealy et al., 2004) and the CORINE data, to derive a provisional HOST<br />
classification for Ireland.<br />
All digital datasets were manually checked and adjusted, for example to add recent urban developments to the CORINE data and to<br />
ensure that lakes were properly connected to the drainage network.<br />
<strong>The</strong> largest amount <strong>of</strong> effort went into the HOST classification. <strong>The</strong> 29 HOST classes were developed for the UK and are based on<br />
features such as the flow mechanisms and permeability <strong>of</strong> the soil substrate, the depth to an impermeable or gleyed layer, and the<br />
presence <strong>of</strong> absence <strong>of</strong> peat (Boorman et al., 1995). <strong>The</strong> requirement for this project was not to produce a full HOST classification<br />
for Ireland, but rather to obtain enough information to produce good estimates <strong>of</strong> the hydrological variables SPRHOST and<br />
BFIHOST.<br />
An initial map was produced by expert judgement, identifying equivalent HOST classes for each soil association on the General Soil<br />
map. Some associations (those containing a significant proportion <strong>of</strong> gleys, which tend to occur in valley bottoms) were allocated a<br />
mixture <strong>of</strong> two HOST classes. Next, additional spatial detail was added by subdividing some associations into several HOST classes<br />
<strong>using</strong> information on the depth <strong>of</strong> groundwater interpreted from the Quaternary mapping. <strong>The</strong> classification was also refined,<br />
particularly in peat areas, <strong>using</strong> the CORINE data (which identifies features such as inland marshes, raised bogs and improved<br />
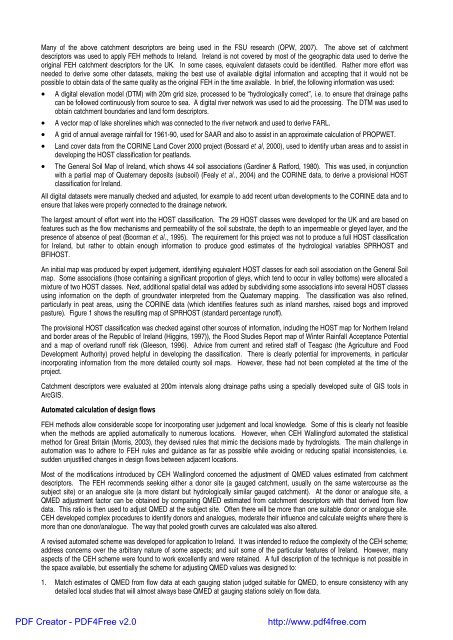
pasture). Figure 1 shows the resulting map <strong>of</strong> SPRHOST (standard percentage run<strong>of</strong>f).<br />
<strong>The</strong> provisional HOST classification was checked against other sources <strong>of</strong> information, including the HOST map for Northern Ireland<br />
and border areas <strong>of</strong> the Republic <strong>of</strong> Ireland (Higgins, 1997)), the Flood Studies Report map <strong>of</strong> Winter Rainfall Acceptance Potential<br />
and a map <strong>of</strong> overland run<strong>of</strong>f risk (Gleeson, 1996). Advice from current and retired staff <strong>of</strong> Teagasc (the Agriculture and Food<br />
Development Authority) proved helpful in developing the classification. <strong>The</strong>re is clearly potential for improvements, in particular<br />
incorporating information from the more detailed county soil maps. However, these had not been completed at the time <strong>of</strong> the<br />
project.<br />
Catchment descriptors were evaluated at 200m intervals along drainage paths <strong>using</strong> a specially developed suite <strong>of</strong> GIS tools in<br />
ArcGIS.<br />
Automated calculation <strong>of</strong> design flows<br />
FEH methods allow considerable scope for incorporating user judgement and local knowledge. Some <strong>of</strong> this is clearly not feasible<br />
when the methods are applied automatically to numerous locations. However, when CEH Wallingford <strong>automated</strong> the statistical<br />
method for Great Britain (Morris, 2003), they devised rules that mimic the decisions made by hydrolo<strong>gis</strong>ts. <strong>The</strong> main challenge in<br />
automation was to adhere to FEH rules and guidance as far as possible while avoiding or reducing spatial inconsistencies, i.e.<br />
sudden unjustified changes in design flows between adjacent locations.<br />
Most <strong>of</strong> the modifications introduced by CEH Wallingford concerned the adjustment <strong>of</strong> QMED values estimated from catchment<br />
descriptors. <strong>The</strong> FEH recommends seeking either a donor site (a gauged catchment, usually on the same watercourse as the<br />
subject site) or an analogue site (a more distant but hydrologically similar gauged catchment). At the donor or analogue site, a<br />
QMED adjustment factor can be obtained by comparing QMED estimated from catchment descriptors with that derived from flow<br />
data. This ratio is then used to adjust QMED at the subject site. Often there will be more than one suitable donor or analogue site.<br />
CEH developed complex procedures to identify donors and analogues, moderate their influence and calculate weights where there is<br />
more than one donor/analogue. <strong>The</strong> way that pooled growth curves are calculated was also altered.<br />
A revised <strong>automated</strong> scheme was developed for application to Ireland. It was intended to reduce the complexity <strong>of</strong> the CEH scheme;<br />
address concerns over the arbitrary nature <strong>of</strong> some aspects; and suit some <strong>of</strong> the particular features <strong>of</strong> Ireland. However, many<br />
aspects <strong>of</strong> the CEH scheme were found to work excellently and were retained. A full description <strong>of</strong> the technique is not possible in<br />
the space available, but essentially the scheme for adjusting QMED values was designed to:<br />
1. Match estimates <strong>of</strong> QMED from flow data at each gauging station judged suitable for QMED, to ensure consistency with any<br />
detailed local studies that will almost always base QMED at gauging stations solely on flow data.<br />
PDF Creator - PDF4Free v2.0<br />
http://www.pdf4free.com


