
Create successful ePaper yourself
Turn your PDF publications into a flip-book with our unique Google optimized e-Paper software.
WORKING PAPER SERIES<br />
WORKING PAPER NO 2, 2008<br />
Swedish Business School at Örebro University<br />
Good Times Are Drinking Times:<br />
Empirical Evidence on Business Cycles <strong>and</strong> <strong>Alcohol</strong> Sales in Sweden<br />
1861-2000<br />
by<br />
Niclas A Krüger<br />
niclas.kruger@esi.oru.se<br />
Swedish Business School<br />
Örebro University<br />
Sweden<br />
Mikael Svensson<br />
mikael.svensson@esi.oru.se<br />
Swedish Business School<br />
Örebro University<br />
Sweden<br />
http://www.oru.se/esi/wps<br />
SE-701 82 Örebro<br />
Sweden<br />
ISSN 1403-0586
Good Times Are Drinking Times:<br />
Empirical Evidence on Business Cycles <strong>and</strong> <strong>Alcohol</strong> Sales in Sweden 1861-<br />
2000<br />
Niclas Krüger a a, b, 1<br />
<strong>and</strong> Mikael Svensson<br />
a<br />
Department of Economics, Örebro University<br />
b Adolescent Health Research, Karlstad University<br />
Abstract: This paper studies the relationship between the business cycle <strong>and</strong> alcohol sales in<br />
Sweden using a data set for the years 1861-2000. Using wavelet based b<strong>and</strong>-pass filtering it is<br />
found that there is a pro-cyclical relationship, i.e. alcohol sales increases in short-term<br />
economic upturns. Using moving window techniques we see that the pro-cyclical relationship<br />
holds over the entire time period. We also find that alcohol sales are a long-memory process<br />
with non-stationary behavior, i.e. a shock in alcohol sales has persistent effects.<br />
Key-words: Business cycles, <strong>Alcohol</strong>, Sweden<br />
JEL-Code: E32, I12<br />
Body-text word count: 1,459<br />
Figure count: 3<br />
Table count: 3<br />
No conflicts of interest reported.<br />
1<br />
Corresponding author:<br />
mikael.svensson@esi.oru.se<br />
Adolescent Health Research, Karlstad University<br />
Universitetsgatan 2, 651 88, Karlstad, Sweden<br />
+46-54-700-16-61
I. Introduction<br />
Recently there have been a number of papers exploring the relationship between<br />
macroeconomic conditions <strong>and</strong> health. Even though long-term <strong>GDP</strong> growth is beneficial <strong>and</strong> a<br />
necessity for improved health status, short-term fluctuations may have other consequences. In<br />
a series of papers based on US data it has been shown that the short-term impact of increases<br />
in the growth rate of <strong>GDP</strong> is bad for your health (Ruhm, 2000; Ruhm, 2003; Ruhm, 2005).<br />
These results have also been confirmed on studies based on German <strong>and</strong> Spanish data<br />
(Neumayer, 2004; Granados, 2005). There have been some exceptions to these results, using<br />
data from Nordic countries a counter-cyclical relationship has been found for some causespecific<br />
mortality rates (Gerdtham <strong>and</strong> Johannesson, 2005; Johansson et al., 2006; Svensson,<br />
2007).<br />
Considering these results, there is a general interest in exploring how different health<br />
behaviors changes with the business cycle in order to underst<strong>and</strong> what explains the<br />
relationship between mortality rates <strong>and</strong> business cycles. An important health behavior that<br />
may change with economic conditions is alcohol consumption. In economic upturns alcoholconsumption<br />
may increase due to increases in income, if alcohol is a normal good. However,<br />
alcohol consumption may also increase in economic downturns due to increases in leisure<br />
time, decreasing the opportunity cost of drinking. Drinking may also increase if individuals<br />
use alcohol as self-medication to cope with economic-related stress. Direct evidence is<br />
available from self-reported data, where individuals report that alcohol is a way to deal with<br />
job-related <strong>and</strong> economic-related stress. Further, the evidence for stress-related drinking is<br />
reinforced from experimental animal studies, which has shown that stress induces alcohol<br />
abuse (Poherecky, 1991; NIAAA, 1996; Dee, 2001).
Some findings based on aggregate state-level US data, as well as individual level data,<br />
indicates that drinking, <strong>and</strong> binge drinking, varies pro-cyclically; i.e. increases in economic<br />
upturns (Ruhm, 1995; Ruhm <strong>and</strong> Black, 2002). Other studies have found that average<br />
drinking is pro-cyclical, but binge-drinking is counter-cyclical (Dee, 2001). Considering non-<br />
US data, a recent study using Finnish data finds that aggregate alcohol-related mortality<br />
decreases in economic upturns (counter-cyclical), while micro-level data indicates that<br />
alcohol consumption increases in economic upturns (pro-cyclical).<br />
Taking into account the literature discussed above, the contributions of this paper are the<br />
following: (i) we examine the relationship between business cycles <strong>and</strong> alcohol sales over a<br />
much longer time period (between 1861 <strong>and</strong> 2000), (ii) we explore if the relationship has<br />
changed over time, which may be particularly interesting since it has been shown that the<br />
relationship between business cycles <strong>and</strong> mortality has changed significantly over time (Tapia<br />
Granados, 2007), <strong>and</strong> (iii) performing the analysis on Swedish data, since it is not necessarily<br />
so that the results based mostly on US data are globally valid.<br />
The methodological approach in the paper is (i) using long-memory tests for persistence in<br />
alcohol sales over time, <strong>and</strong> (ii) using business cycle dynamics based on wavelet b<strong>and</strong>-pass<br />
filtering estimating the relationship between the cyclicality of <strong>GDP</strong> <strong>and</strong> alcohol sales. Our<br />
results indicate that there is a pro-cyclical relationship, i.e. alcohol sales increases in<br />
economic upturns. The results on the long-memory test suggest that a shock in alcohol sales<br />
has a persistent effect. Both conclusions have a major impact on public health policy,<br />
necessitating measures taken with consideration of economic conditions.
II. Results<br />
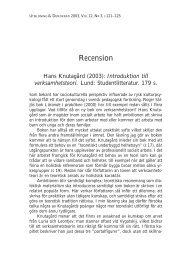
Figure 1 gives an illustration of the development of alcohol sales in Sweden between 1861-<br />
2000 as liters of pure alcohol per capita <strong>and</strong> year, data coming from CAN (CAN, 2007). In the<br />
end of WWI we see a sharp decline in alcohol sales. In 1917 a rationing system was<br />
implemented, such that an individual were allowed to purchase a maximum of 2 liters (not<br />
pure alcohol) per quarter. 2 Until the 1960s alcohol sales mostly consisted of hard liquor,<br />
which has decreased since. After the 1960s sales of beer <strong>and</strong> wine (expressed in pure liters of<br />
alcohol) have, on the other h<strong>and</strong>, increased.<br />
[Insert Figure 1 here]<br />
We do not see any precise deterministic trend; the observed trend in the series may well be<br />
stochastic in nature. Since alcohol sales cannot grow without boundaries we reject, on<br />
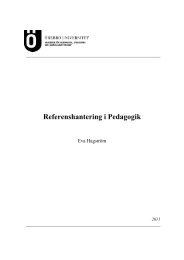
theoretical grounds, a pure r<strong>and</strong>om-walk process. Examining the autocorrelation function,<br />
however, reveals a long-range dependency in the stochastic process followed by alcohol sales<br />
(see Figure 2). We see that alcohol sales one year depend significantly on sales in the<br />
preceding 10 years. The autocorrelation function looks similar if we remove a deterministic<br />
linear time trend from the series.<br />
[Insert Figure 2 here]<br />
In order to formally test for long-memory in alcohol sales, we employ a battery of tests for the<br />
estimate of the long memory (fractional integration) parameter d of a time series, based on the<br />
log-periodogram regression (Phillips, 1999; Phillips, 2007) <strong>and</strong> the local Whittle estimation<br />
2 Low income-earners, married women or the unemployed were not allowed to purchase alcohol at all.
(Kuensch, 1987; Robinson, 1995; Shimotsu <strong>and</strong> Phillips, 2005; Shimotsu, 2006). If a series<br />
exhibits long memory it is a fractionally integrated process I(d) with d being a real number.<br />
Table 1 shows the results.<br />
[Insert Table 1 here]<br />
We conclude that alcohol sales are a long-memory process with non-stationary behavior since<br />
d lies between 0.5 <strong>and</strong> 1 (Percival <strong>and</strong> Walden, 2000). This has interesting implications since<br />
it implies that a shock in alcohol sales has persistent effects on sales (for a unit root process<br />
this would be a permanent effect) <strong>and</strong> thus creating non-periodic cycles which can be<br />
misinterpreted as local trends. The evidence for persistence in the time series of alcohol sales<br />
is clearly in accordance with the hypotheses that alcohol establishes modified consumption<br />
patterns <strong>and</strong> addiction.<br />
The next question is whether deviations from trend growth, i.e. business cycles, increase or<br />
decrease alcohol consumption. We use alcohol sales as a proxy for consumption, considering<br />
that the correlation between the two is close to one. We use the Haar-wavelet as a filter in<br />
order to separate business cycle dynamics from noise <strong>and</strong> underlying trend behavior. It can be<br />
shown that the Haar-wavelet is approximating an ideal b<strong>and</strong>-pass filter, capturing dynamics<br />
with a frequency in the interval [1/8, 1/4]. 3 This implies that it captures the typical business<br />
cycle variations with a period of 4 to 8 years. Moreover, it removes non-stationarity <strong>and</strong> longterm<br />
dependence from the time series.<br />
3 We use the second scale in a maximum overlap discrete wavelet transform (MODWT), see e.g. Percival <strong>and</strong><br />
Walden (2000).
The results from the contemporaneous correlation coefficient between alcohol sales (natural<br />
log differences) <strong>and</strong> <strong>GDP</strong> is highly significant (p-value
order to conclude that causality is unidirectional we must have that one null hypothesis is<br />
rejected <strong>and</strong> that one null hypothesis is accepted at conventional significance levels. The<br />
results are shown in Table 2.<br />
[Insert Table 2 here]<br />
We find that the granger causality tests for business cycle dynamics are inconclusive,<br />
probably because the contemporaneous effect dominates. However, if we filter the data to<br />
capture 8 to 16 year period dynamics we are better able to distinguish dynamic effects <strong>and</strong><br />
find that <strong>GDP</strong> granger causes sales.<br />
III. Conclusions<br />
Using a data set on alcohol sales <strong>and</strong> <strong>GDP</strong> in Sweden for the years 1861 to 2000, we find that<br />
alcohol sales, which is naturally closely connected to alcohol consumption, increases in<br />
economic upturns. In good economic times, drinking increases. This has potential policy<br />
implications for the timing of public health policy interventions to reduce consumption.<br />
Further, we also found that alcohol sales are a long memory process with non-stationary<br />
behavior. The implication is that that a shock in alcohol sales has persistent effect on sales,<br />
e.g. consistent with the fact that alcohol creates an addiction.
References<br />
CAN. (2007) Drogutvecklingen i Sverige 2007, Centralförbundet för alkohol- och<br />
narkotikaupplysning, Rapport nr 107.<br />
Dee, T. (2001) <strong>Alcohol</strong> abuse <strong>and</strong> economic conditions: Evidence from repeated crosssections<br />
of individual-level data, Health Economics, 10, 257-70.<br />
Gerdtham, U. G. <strong>and</strong> Johannesson, M. (2005) Business cycles <strong>and</strong> mortality: results from<br />
Swedish microdata., Social Science & Medicine 60, 205-18.<br />
Granados, J. A. T. (2005) Recessions <strong>and</strong> Mortality in Spain, 1980-1997, International<br />
Journal of Population, 21, 393-422.<br />
Granger, C. (1969) Investigating causal relations by economic models <strong>and</strong> cross-spectral<br />
methods, Econometrica, 37, 24-36.<br />
Granger, C. (1986) Forecasting Economic Time Series, Academic Press, New York.<br />
Johansson, E., Böckerman, P., Prättälä, R. <strong>and</strong> Uutela, A. (2006) <strong>Alcohol</strong>-related mortality,<br />
drinking behavior, <strong>and</strong> business cycles: Are slumps really dry seasons?, European<br />
Journal of Health Economics, 7, 215-20.<br />
Kuensch, H. (1987) Statistical aspects of self-similar processes, in Proceedings of the First<br />
World Congress of the Bernoulli Society, (Ed.) Y. Prokhorov <strong>and</strong> V. V. Sazanov,<br />
VNU Science Press, Utrecht, 167-74.<br />
Neumayer, E. (2004) Recessions lower (some) mortality rates: evidence from Germany Social<br />
Science & Medicine, 58, 1037-47.<br />
NIAAA. (1996) <strong>Alcohol</strong> <strong>and</strong> Stress, National Institute of Health, US Department of Health<br />
<strong>and</strong> Human Services, Washington D.C.<br />
Percival, P. D. <strong>and</strong> Walden, T. A. (2000) Walevet Methods for Time Series Analysis,<br />
Cambridge University Press.<br />
Phillips, P. (1999) Discrete Fourier Transforms of Fractional Processes, Cowles Foundation<br />
Discussion Papers 1243, Cowles Foundation, Yale University.<br />
Phillips, P. (2007) Unit root log periodogram regression, Journal of Econometrics, 127, 104-<br />
24.<br />
Poherecky, L. A. (1991) Stress <strong>and</strong> alcohol interaction: An update of human research,<br />
<strong>Alcohol</strong>ism: Clinical <strong>and</strong> Experimental Research, 15.<br />
Robinson, P. M. (1995) Gaussian semiparametric estimation of long range dependence,<br />
Annals of Statistics, 23, 1630-61.<br />
Ruhm, C. J. (1995) Economic conditions <strong>and</strong> alcohol problems, Journal of Health Economics,<br />
14, 583-603.
Ruhm, C. J. (2000) Are Recessions Good for your Health?, Quarterly Journal of Economics,<br />
115, 617-50.<br />
Ruhm, C. J. (2003) Good times make you sick, Journal of Health Economics, 22, 637-58.<br />
Ruhm, C. J. (2005) Healthy living in hard times, Journal of Health Economics, 24, 341-63.<br />
Ruhm, C. J. <strong>and</strong> Black, W. E. (2002) Does drinking really decrease in bad times? , Journal of<br />
Health Economics, 21, 659-78<br />
Shimotsu, K. (2006) Exact local Whittle estimation of fractional integration with unknown<br />
mean <strong>and</strong> time trend, Queen's University:<br />
http://ideas.repec.org/p/qed/wpaper/1061.html.<br />
Shimotsu, K. <strong>and</strong> Phillips, P. C. B. (2005) Exact local Whittle estimation of fractional<br />
integration, Annals of Statistics, 33, 1890-933.<br />
Svensson, M. (2007) Do not go breaking your heart: Do economic upturns really increase<br />
heart attack mortality?, Social Science & Medicine, 65, 833-41.<br />
Tapia Granados, J. (2007) The reversal of the relation between economic growth <strong>and</strong> health<br />
progress: Sweden in the 19th <strong>and</strong> 20th centuries, Journal of Health Economics,<br />
forthcoming.
Tables<br />
Table 1. Estimate of fractional differencing parameter d for alcohol<br />
Method<br />
Estimate of d<br />
Modified Log-Periodogram Regression estimator 0.82<br />
Local Whittle (LW) estimator 0.72<br />
Exact LW (ELW) estimator 0.82<br />
Feasible ELW estimator 0.73<br />
Feasible ELW estimator (detrended) 0.73<br />
2-step feasible ELW estimator 0.70<br />
2-step feasible ELW estimator (detrended) 0.72
Table 2. Granger causality SALES <strong>and</strong> <strong>GDP</strong> 1861-2000<br />
Filter<br />
Direction of causality<br />
D2 (4-8 years)<br />
Inconclusive<br />
D3 (8-16 years)<br />
<strong>GDP</strong>=>SALES***<br />
***p
Figures<br />
Figure 1. <strong>Alcohol</strong> sales (liters of pure alcohol per person) in Sweden 1861-2006<br />
2 4 6 8 10 12<br />
<strong>Alcohol</strong> sales per capita (pure liters of alcohol)<br />
AB Vin & Spritcentralen sales monopoly created<br />
Individual−level purchase rationing ab<strong>and</strong>oned<br />
1850 1900 1950 2000<br />
Year
Figure 2. Autocorrelation function for alcohol sales<br />
Autocorrelations of alcohol sales<br />
−1.00 −0.50 0.00 0.50 1.00<br />
0 10 20 30 40<br />
Lag<br />
Bartlett’s formula for MA(q) 95% confidence b<strong>and</strong>s
Figure 3. Correlation for moving windows (width 20 years, step 5 years)<br />
r(rho)<br />
−.2 0 .2 .4 .6 .8<br />
1850 1900 1950 2000<br />
end