Report - Office of Statewide Health Planning and Development ...
Report - Office of Statewide Health Planning and Development ...
Report - Office of Statewide Health Planning and Development ...

You also want an ePaper? Increase the reach of your titles
YUMPU automatically turns print PDFs into web optimized ePapers that Google loves.
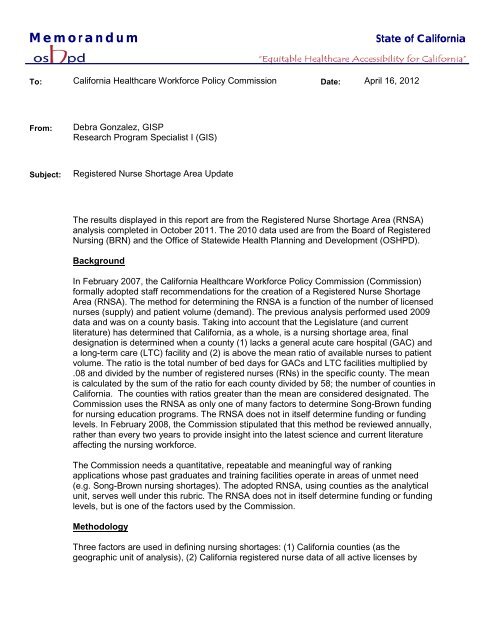
Memor<strong>and</strong>um<br />
State <strong>of</strong> California<br />
To: California <strong>Health</strong>care Workforce Policy Commission Date: April 16, 2012<br />
From:<br />
Debra Gonzalez, GISP<br />
Research Program Specialist I (GIS)<br />
Subject:<br />
Registered Nurse Shortage Area Update<br />
The results displayed in this report are from the Registered Nurse Shortage Area (RNSA)<br />
analysis completed in October 2011. The 2010 data used are from the Board <strong>of</strong> Registered<br />
Nursing (BRN) <strong>and</strong> the <strong>Office</strong> <strong>of</strong> <strong>Statewide</strong> <strong>Health</strong> <strong>Planning</strong> <strong>and</strong> <strong>Development</strong> (OSHPD).<br />
Background<br />
In February 2007, the California <strong>Health</strong>care Workforce Policy Commission (Commission)<br />
formally adopted staff recommendations for the creation <strong>of</strong> a Registered Nurse Shortage<br />
Area (RNSA). The method for determining the RNSA is a function <strong>of</strong> the number <strong>of</strong> licensed<br />
nurses (supply) <strong>and</strong> patient volume (dem<strong>and</strong>). The previous analysis performed used 2009<br />
data <strong>and</strong> was on a county basis. Taking into account that the Legislature (<strong>and</strong> current<br />
literature) has determined that California, as a whole, is a nursing shortage area, final<br />
designation is determined when a county (1) lacks a general acute care hospital (GAC) <strong>and</strong><br />
a long-term care (LTC) facility <strong>and</strong> (2) is above the mean ratio <strong>of</strong> available nurses to patient<br />
volume. The ratio is the total number <strong>of</strong> bed days for GACs <strong>and</strong> LTC facilities multiplied by<br />
.08 <strong>and</strong> divided by the number <strong>of</strong> registered nurses (RNs) in the specific county. The mean<br />
is calculated by the sum <strong>of</strong> the ratio for each county divided by 58; the number <strong>of</strong> counties in<br />
California. The counties with ratios greater than the mean are considered designated. The<br />
Commission uses the RNSA as only one <strong>of</strong> many factors to determine Song-Brown funding<br />
for nursing education programs. The RNSA does not in itself determine funding or funding<br />
levels. In February 2008, the Commission stipulated that this method be reviewed annually,<br />
rather than every two years to provide insight into the latest science <strong>and</strong> current literature<br />
affecting the nursing workforce.<br />
The Commission needs a quantitative, repeatable <strong>and</strong> meaningful way <strong>of</strong> ranking<br />
applications whose past graduates <strong>and</strong> training facilities operate in areas <strong>of</strong> unmet need<br />
(e.g. Song-Brown nursing shortages). The adopted RNSA, using counties as the analytical<br />
unit, serves well under this rubric. The RNSA does not in itself determine funding or funding<br />
levels, but is one <strong>of</strong> the factors used by the Commission.<br />
Methodology<br />
Three factors are used in defining nursing shortages: (1) California counties (as the<br />
geographic unit <strong>of</strong> analysis), (2) California registered nurse data <strong>of</strong> all active licenses by
RNSA<br />
April 16, 2012<br />
Page 2<br />
county from the Board <strong>of</strong> Registered Nursing (BRN) 1 , <strong>and</strong> (3) the patient day <strong>and</strong> census<br />
data from all LTCs <strong>and</strong> GACs from OSHPD. 2<br />
OSHPD maintains data on patient volume for GACs <strong>and</strong> LTCs. These data are maintained<br />
on the OSHPD Automated Licensing Information <strong>and</strong> <strong>Report</strong> Tracking System (ALIRTS) <strong>and</strong><br />
available on the OSHPD website as data products. These GAC <strong>and</strong> LTC locations employ<br />
nearly 70% <strong>of</strong> the total nursing workforce in California. No current data exist on patient<br />
volume for the other 30% <strong>of</strong> the workforce.<br />
OSHPD facility census 3 data for 2010 were obtained by county. There are more licensed<br />
bed days in LTCs than GACs in California <strong>and</strong> LTCs only account for 5% <strong>of</strong> the registered<br />
nurse workforce. 4 Therefore, a scale factor representing the percent <strong>of</strong> the nursing<br />
workforce at LTCs in this function was applied to ensure the census data were not skewed. 5<br />
A total census was created by summing the two numbers <strong>and</strong> a ratio was used <strong>of</strong> census<br />
divided by registered nurses for each <strong>of</strong> the 58 counties.<br />
Ratio Equation:<br />
∑ (CensusDaysGAC + [(PatientDaysLTC) * 0.08])<br />
RNCount<br />
Where:<br />
Limitations<br />
CensusDaysGAC is the number <strong>of</strong> days a patient is occupying a bed in General<br />
Acute Care Hospitals in 2010<br />
PatientDaysLTC is the number <strong>of</strong> days a patient is occupying a bed in Long-Term<br />
Care Facilities in 2010<br />
RNCount is the number <strong>of</strong> licensed, active registered nurses per county in 2010<br />
This designation methodology has two limitations. First, only about 70% <strong>of</strong> the nursing<br />
workforce is accounted for in this function. The remaining 30% <strong>of</strong> the workforce is employed<br />
at schools, home health agencies, <strong>and</strong> other facilities, for which no ratio <strong>of</strong> average daily<br />
census or population served can be readily analyzed. 6 Second, nurses <strong>and</strong> patients both<br />
travel outside county boundaries to give <strong>and</strong> receive care. However, we are unable to<br />
obtain data on commute patterns by occupation at this time due to confidentiality constraints<br />
regarding the release <strong>of</strong> healthcare providers’ Social Security Numbers.<br />
1 Source: 2010, Department <strong>of</strong> Consumer Affairs, Board <strong>of</strong> Registered Nursing, County Count Summary for<br />
Clear Licenses.<br />
2 Source: 2010, <strong>Office</strong> <strong>of</strong> <strong>Statewide</strong> <strong>Health</strong> <strong>Planning</strong> <strong>and</strong> <strong>Development</strong>, <strong>Health</strong>care Information Division (HID)<br />
Data Products. http://www.oshpd.ca.gov/HID/DataFlow/index.html<br />
3 Census Day Totals are a measure <strong>of</strong> service delivery. This value is the sum <strong>of</strong> the number <strong>of</strong> days that a given<br />
bed was occupied by a patient. Each night healthcare facilities take a census <strong>of</strong> patients in each bed. The<br />
census is kept by bed type (Acute Respiratory Care, Burn, Coronary Care, Intensive Care, Intensive Care –<br />
Newborn Nursery, Perinatal, Pediatric, Rehabilitation Center, <strong>and</strong> Unspecified General Acute Care). The GAC<br />
Census Days are the sum <strong>of</strong> the census for each <strong>of</strong> the nine GAC bed designations. A similar number is<br />
obtained for Long-Term Care Facilities.<br />
4 5% <strong>of</strong> the RN workforce is at LTC facilities, while 64% <strong>of</strong> the RN workforce is at GACs.<br />
5 The scale factor is 0.08. This number is the percent <strong>of</strong> the workforce at LTC facilities, in our function. It is<br />
derived from 5 (percent <strong>of</strong> nurses employed at LTC facilities) / 64 (percent <strong>of</strong> nurses employed at GACs).<br />
6 CA Workforce Initiative, Center for <strong>Health</strong> Pr<strong>of</strong>essions, UCSF. 2001. Nursing in CA: A Workforce Crisis.
RNSA<br />
April 16, 2012<br />
Page 3<br />
Other methodological approaches were explored by OSHPD staff <strong>and</strong> were indicated in a<br />
separate report on March 9, 2009, “Registered Nurse Shortage Area Alternative<br />
Methodologies.”<br />
Assessment<br />
Song-Brown staff was contacted during the year regarding the RNSA. No new data sources<br />
currently exist which would enhance or change the adopted approach.<br />
Staff contacted Dr. Joanne Spetz, University <strong>of</strong> California, San Francisco (UCSF), The<br />
Center for the <strong>Health</strong> Pr<strong>of</strong>essions, to inquire about any new methodologies relating to<br />
measuring nursing shortages. Dr. Spetz reviewed the methodology <strong>and</strong> results <strong>of</strong>fering<br />
observations <strong>and</strong> suggestions to consider for future analysis. She notes since the measure<br />
<strong>of</strong> need for RNSA is based on hospital <strong>and</strong> long term care volume, the RN data should<br />
count RNs most likely to work in those settings <strong>and</strong> not count advanced practice RNs. Dr.<br />
Spetz makes several observations about problematic areas <strong>of</strong> California: In the Bay Area,<br />
San Francisco is showing as a shortage area but San Mateo is not, yet RNs travel from<br />
Marin or San Mateo to work in San Francisco. According UCSF employer surveys, San<br />
Francisco is not an area with shortage currently. Dr. Spetz questions why counties with “no<br />
facilities” are automatically designated shortage areas. She questions this aspect <strong>of</strong> the<br />
methodology because even if there are RNs in counties with no facilities, RNs would not be<br />
hired. In addition, Dr. Spetz <strong>of</strong>fers the UCSF employer survey as part <strong>of</strong> OSHPD analysis<br />
once the county level data is robust enough to be utilized for the RNSA analysis.<br />
Results<br />
The results from the last adopted approach are displayed in a separate memo, “Registered<br />
Nurse Shortage Area Update” on April 21, 2011.<br />
This analysis was performed by using the current methodology <strong>of</strong> counties as the analytical<br />
unit. The mean ratio for counties was 44.88. In the county analysis, 28 counties were<br />
designated as RNSAs. Since the February 2010 Commission meeting, designation status<br />
has changed for four counties. Del Norte, Lake <strong>and</strong> Riverside Counties have gained<br />
designation. Sutter County lost designation.<br />
Alpine County <strong>and</strong> Sierra County are automatically designated since there are no counts for<br />
Long-Term Care Facilities (LTCs) or General Acute Care Hospitals (GACs). (See map on<br />
page 8)<br />
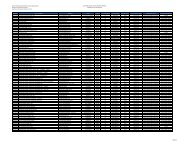
Table 1 on Page 4 illustrates the RNSA listed alphabetically by county, where LTCPatient is<br />
the patient days for long-term care facilities, GACCensus is the patient census days for<br />
general acute care hospitals, BRNCount is the number <strong>of</strong> registered nurses per county from<br />
the BRN, Ratio is the ratio <strong>of</strong> each county derived from the Ratio Equation, <strong>and</strong> Designated<br />
is whether that particular county has been designated according to the mean. The mean is<br />
calculated by the sum <strong>of</strong> the ratio for each county divided by 58; the number <strong>of</strong> counties in<br />
California. Table 2 on Page 5 ranks the counties by ratio. A map is also included on Page 8<br />
to show the county designations. *Note: the yellow highlighted rows in Tables 1 <strong>and</strong> 2<br />
indicate the four counties whose designation status has changed since the last RNSA<br />
update in February 2010.
RNSA<br />
April 16, 2012<br />
Page 4<br />
Table 1 – RNSA Listed Alphabetically by County; Mean Designation Cut<strong>of</strong>f >44.88<br />
County LTCPatient GACCensus BRNCount Ratio Designated<br />
Alameda 1645910 614425 13092 56.99 Yes<br />
Alpine 0 0 9 0.00 Yes<br />
Amador 41203 7601 308 35.38 No<br />
Butte 339968 118438 2333 62.42 Yes<br />
Calaveras 33702 5114 443 17.63 No<br />
Colusa 30621 3106 54 102.88 Yes<br />
Contra Costa 883902 353087 11218 37.78 No<br />
Del Norte 26419 8001 222 45.56 Yes<br />
El Dorado 77411 31736 2180 17.40 No<br />
Fresno 956370 383515 7574 60.74 Yes<br />
Glenn 26132 1116 98 32.72 No<br />
Humboldt 123317 46655 1399 40.40 No<br />
Imperial 81654 47864 878 61.95 Yes<br />
Inyo 28135 2742 179 27.89 No<br />
Kern 513581 324497 5171 70.70 Yes<br />
Kings 97692 36654 869 51.17 Yes<br />
Lake 77721 14154 454 44.87 Yes<br />
Lassen 0 4007 218 18.38 No<br />
Los Angeles 11848304 4765336 70888 80.59 Yes<br />
Madera 135636 105901 863 135.29 Yes<br />
Marin 309820 84641 3373 32.44 No<br />
Mariposa 0 793 137 5.79 No<br />
Mendocino 78367 21442 758 36.56 No<br />
Merced 229511 54677 1148 63.62 Yes<br />
Modoc 0 789 47 16.79 No<br />
Mono 0 1591 99 16.07 No<br />
Monterey 312561 148503 2921 59.40 Yes<br />
Napa 239097 59194 2122 36.91 No<br />
Nevada 125546 24868 1310 26.65 No<br />
Orange 2169995 1151329 24974 53.05 Yes<br />
Placer 325341 161481 4572 41.01 No<br />
Plumas 18400 4089 161 34.54 No<br />
Riverside 1395191 669787 16553 47.21 Yes<br />
Sacramento 1119840 632963 12360 58.46 Yes<br />
San Benito 0 7286 332 21.95 No<br />
San Bernardino 1354571 819632 17081 54.33 Yes<br />
San Diego 2598381 1219544 28540 50.01 Yes<br />
San Francisco 423018 539950 7395 77.59 Yes<br />
San Joaquin 856413 232822 4966 60.68 Yes
RNSA<br />
April 16, 2012<br />
Page 5<br />
County LTCPatient GACCensus BRNCount Ratio Designated<br />
San Luis<br />
Obispo 268719 80014 2869 35.38 No<br />
San Mateo 418002 190364 8142 27.49 No<br />
Santa Barbara 340205 128987 2781 56.17 Yes<br />
Santa Clara 1551789 738467 13914 62.00 Yes<br />
Santa Cruz 175375 71955 2661 32.31 No<br />
Shasta 269647 103601 2187 57.23 Yes<br />
Sierra 0 0 28 0.00 Yes<br />
Siskiyou 19055 8300 410 23.96 No<br />
Solano 257725 132092 5466 27.94 No<br />
Sonoma 464794 137574 4967 35.18 No<br />
Stanislaus 583695 263956 4088 75.99 Yes<br />
Sutter 126470 11567 736 29.46 No<br />
Tehama 18115 8806 318 32.25 No<br />
Trinity 0 1923 71 27.08 No<br />
Tulare 454503 160918 2823 69.88 Yes<br />
Tuolumne 42756 19942 613 38.11 No<br />
Ventura 502611 261743 7207 41.90 No<br />
Yolo 229850 18865 1370 27.19 No<br />
Yuba 29775 39185 378 109.97 Yes<br />
Table 2 – RNSA Listed by Ratio (for Counties); Mean Designation Cut<strong>of</strong>f >44.88<br />
Rank County LTCPatient GACCensus BRNCount Ratio Designated<br />
1 Mariposa 0 793 137 5.79 No<br />
2 Mono 0 1591 99 16.07 No<br />
3 Modoc 0 789 47 16.79 No<br />
4 El Dorado 77411 31736 2180 17.40 No<br />
5 Calaveras 33702 5114 443 17.63 No<br />
6 Lassen 0 4007 218 18.38 No<br />
7 San Benito 0 7286 332 21.95 No<br />
8 Siskiyou 19055 8300 410 23.96 No<br />
9 Nevada 125546 24868 1310 26.65 No<br />
10 Trinity 0 1923 71 27.08 No<br />
11 Yolo 229850 18865 1370 27.19 No<br />
12 San Mateo 418002 190364 8142 27.49 No<br />
13 Inyo 28135 2742 179 27.89 No<br />
14 Solano 257725 132092 5466 27.94 No<br />
15 Sutter 126470 11567 736 29.46 No<br />
16 Tehama 18115 8806 318 32.25 No<br />
17 Santa Cruz 175375 71955 2661 32.31 No
RNSA<br />
April 16, 2012<br />
Page 6<br />
Rank County LTCPatient GACCensus BRNCount Ratio Designated<br />
18 Marin 309820 84641 3373 32.44 No<br />
19 Glenn 26132 1116 98 32.72 No<br />
20 Plumas 18400 4089 161 34.54 No<br />
21 Sonoma 464794 137574 4967 35.18 No<br />
22 Amador 41203 7601 308 35.38 No<br />
23 San Luis Obispo 268719 80014 2869 35.38 No<br />
24 Mendocino 78367 21442 758 36.56 No<br />
25 Napa 239097 59194 2122 36.91 No<br />
26 Contra Costa 883902 353087 11218 37.78 No<br />
27 Tuolumne 42756 19942 613 38.11 No<br />
28 Humboldt 123317 46655 1399 40.40 No<br />
29 Placer 325341 161481 4572 41.01 No<br />
30 Ventura 502611 261743 7207 41.90 No<br />
31 Lake 77721 14154 454 44.87 Yes<br />
32 Del Norte 26419 8001 222 45.56 Yes<br />
33 Riverside 1395191 669787 16553 47.21 Yes<br />
34 San Diego 2598381 1219544 28540 50.01 Yes<br />
35 Kings 97692 36654 869 51.17 Yes<br />
36 Orange 2169995 1151329 24974 53.05 Yes<br />
37 San Bernardino 1354571 819632 17081 54.33 Yes<br />
38 Santa Barbara 340205 128987 2781 56.17 Yes<br />
39 Alameda 1645910 614425 13092 56.99 Yes<br />
40 Shasta 269647 103601 2187 57.23 Yes<br />
41 Sacramento 1119840 632963 12360 58.46 Yes<br />
42 Monterey 312561 148503 2921 59.40 Yes<br />
43 San Joaquin 856413 232822 4966 60.68 Yes<br />
44 Fresno 956370 383515 7574 60.74 Yes<br />
45 Imperial 81654 47864 878 61.95 Yes<br />
46 Santa Clara 1551789 738467 13914 62.00 Yes<br />
47 Butte 339968 118438 2333 62.42 Yes<br />
48 Merced 229511 54677 1148 63.62 Yes<br />
49 Tulare 454503 160918 2823 69.88 Yes<br />
50 Kern 513581 324497 5171 70.70 Yes<br />
51 Stanislaus 583695 263956 4088 75.99 Yes<br />
52 San Francisco 423018 539950 7395 77.59 Yes<br />
53 Los Angeles 11848304 4765336 70888 80.59 Yes<br />
54 Colusa 30621 3106 54 102.88 Yes<br />
55 Yuba 29775 39185 378 109.97 Yes<br />
56 Madera 135636 105901 863 135.29 Yes<br />
57 Alpine 0 0 9 0.00 Yes<br />
58 Sierra 0 0 28 0.00 Yes
RNSA<br />
April 16, 2012<br />
Page 7<br />
Recommendation<br />
Since the development <strong>and</strong> implementation <strong>of</strong> the current RNSA methodology, there has not<br />
been a formal method <strong>of</strong> measuring the nursing shortage. Staff recommends the<br />
continued use <strong>of</strong> the current methodology using the county mean as the analytical<br />
unit.
RNSA<br />
April 16, 2012<br />
Page 8